
Group
Results
The BBVA Group obtained a result of €2,698m in the first quarter of 2025, which represents a year-on-year increase of 22.7%. This growth rises to 46.3% if the impact of currency fluctuations is excluded. The solid results are supported by the strong performance of recurring revenues from the banking business and the NTI. In addition, there was a significantly lower negative impact on the other operating income and expenses line than in the same period of 2024, mainly due to a lower hyperinflation adjustment.
| CONSOLIDATED INCOME STATEMENT (MILLIONS OF EUROS) | ||||
|---|---|---|---|---|
| 1Q25 | ∆ % | ∆ % at constant exchange rates | 1Q24 | |
| Net interest income | 6,398 | (1.7) | 8.5 | 6,512 |
| Net fees and commissions | 2,060 | 9.2 | 19.3 | 1,887 |
| Net trading income | 948 | 22.7 | 40.1 | 772 |
| Other operating income and expenses | (82) | (91.4) | (92.0) | (952) |
| Gross income | 9,324 | 13.5 | 28.2 | 8,218 |
| Operating expenses | (3,562) | 5.3 | 14.2 | (3,383) |
| Personnel expenses | (1,901) | 6.9 | 15.8 | (1,778) |
| Other administrative expenses | (1,283) | 4.4 | 14.0 | (1,229) |
| Depreciation | (378) | 0.8 | 7.1 | (375) |
| Operating income | 5,762 | 19.2 | 38.7 | 4,835 |
| Impairment on financial assets not measured at fair value through profit or loss | (1,385) | 1.8 | 11.9 | (1,361) |
| Provisions or reversal of provisions | (51) | (11.5) | (5.5) | (57) |
| Other gains (losses) | 22 | (45.6) | (43.7) | 40 |
| Profit (loss) before tax | 4,348 | 25.8 | 49.8 | 3,458 |
| Income tax | (1,466) | 27.3 | 47.7 | (1,151) |
| Profit (loss) for the period | 2,882 | 25.0 | 50.9 | 2,307 |
| Non-controlling interests | (184) | 72.6 | 180.7 | (107) |
| Net attributable profit (loss) | 2,698 | 22.7 | 46.3 | 2,200 |
| Adjusted earning (loss) per share (euros) (1) | 0.45 | 0.37 | ||
| Earning (loss) per share (euros) (1) | 0.45 | 0.36 | ||
(1) For more information, see Alternative Performance Measures at this report.
Unless expressly indicated otherwise, for a better understanding of the changes under the main headings of the Group's income statement, the rates of change provided below refer to constant exchange rates. When comparing two dates or periods presented in this report, the impact of changes in the exchange rates against the euro of the currencies of the countries in which BBVA operates is sometimes excluded, assuming that exchange rates remain constant. For this purpose, the average exchange rate of the currency of each geographical area of the most recent period is used for both periods, except for those countries whose economies have been considered hyperinflationary, for which the closing exchange rate of the most recent period is used.
| CONSOLIDATED INCOME STATEMENT: QUARTERLY EVOLUTION (MILLIONS OF EUROS) | ||||||
|---|---|---|---|---|---|---|
| 1Q | 4Q | 3Q | 2Q | 1Q | ||
| Net interest income | 6,398 | 6,406 | 5,868 | 6,481 | 6,512 | |
| Net fees and commissions | 2,060 | 2,234 | 1,912 | 1,955 | 1,887 | |
| Net trading income | 948 | 983 | 1,044 | 1,114 | 772 | |
| Other operating income and expenses | (82) | (303) | (107) | (324) | (952) | |
| Gross income | 9,324 | 9,320 | 8,716 | 9,227 | 8,218 | |
| Operating expenses | (3,562) | (4,004) | (3,330) | (3,477) | (3,383) | |
| Personnel expenses | (1,901) | (2,216) | (1,810) | (1,855) | (1,778) | |
| Other administrative expenses | (1,283) | (1,380) | (1,154) | (1,238) | (1,229) | |
| Depreciation | (378) | (408) | (366) | (384) | (375) | |
| Operating income | 5,762 | 5,316 | 5,386 | 5,751 | 4,835 | |
| Impairment on financial assets not measured at fair value through profit or loss | (1,385) | (1,466) | (1,440) | (1,479) | (1,361) | |
| Provisions or reversal of provisions | (51) | (99) | (61) | 19 | (57) | |
| Other gains (losses) | 22 | 8 | (19) | 31 | 40 | |
| Profit (loss) before tax | 4,348 | 3,759 | 3,867 | 4,322 | 3,458 | |
| Income tax | (1,466) | (1,171) | (1,135) | (1,374) | (1,151) | |
| Profit (loss) for the period | 2,882 | 2,588 | 2,732 | 2,949 | 2,307 | |
| Non-controlling interests | (184) | (155) | (105) | (154) | (107) | |
| Net attributable profit (loss) | 2,698 | 2,433 | 2,627 | 2,794 | 2,200 | |
| Adjusted earning (loss) per share (euros) (1) | 0.45 | 0.41 | 0.44 | 0.47 | 0.37 | |
| Earning (loss) per share (euros) (1) | 0.45 | 0.40 | 0.44 | 0.47 | 0.36 | |
(1) For more information, see Alternative Performance Measures at this report.
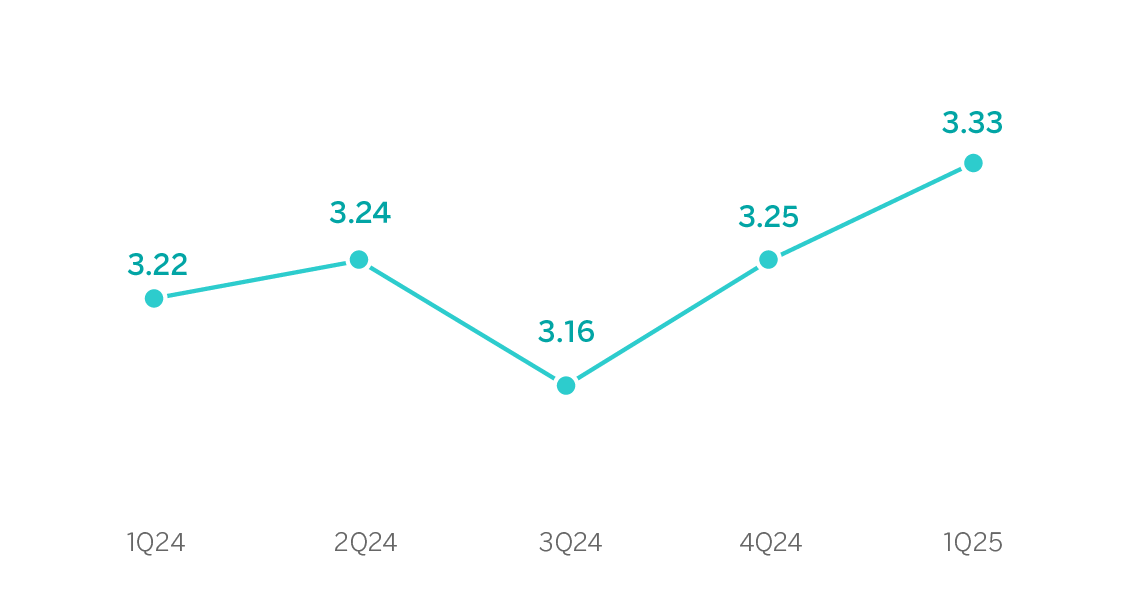
The accumulated net interest income as of March 31, 2025 exceeded that recorded in the same period of the previous year (+8.5%), driven by growth in Turkey, favored by the improvement in customer spreads and, to a lesser extent, by Mexico, driven in this case by higher lending volumes and by the reduction in the cost of funding. Rest of Business and Spain also recorded growth in this line. Moreover, net interest income over average total assets has shown a positive and sustained evolution over the last few quarters, reflecting greater efficiency in the management of the traditional banking business. The growing trend of the indicator is evidence of the bank's capacity to generate solid interest income, even in a challenging economic environment.
Likewise, net fees and commissions experienced a year-on-year growth of 19.3%, thanks to the performance of fees and commissions due to payment fees and, to a lesser extent, asset management fees and commissions. Turkey made an outstanding contribution, well above the other business areas.
As a result, overall recurring banking business revenues, increased by 10.9% compared to the first three months of 2024.
NET INTEREST INCOME / AVERAGE TOTAL ASSETS
(PERCENTAGE AT CONSTANT EXCHANGE RATES)
NET INTEREST INCOME PLUS NET FEES AND COMMISSIONS
(MILLIONS OF EUROS AT CONSTANT EXCHANGE RATES)
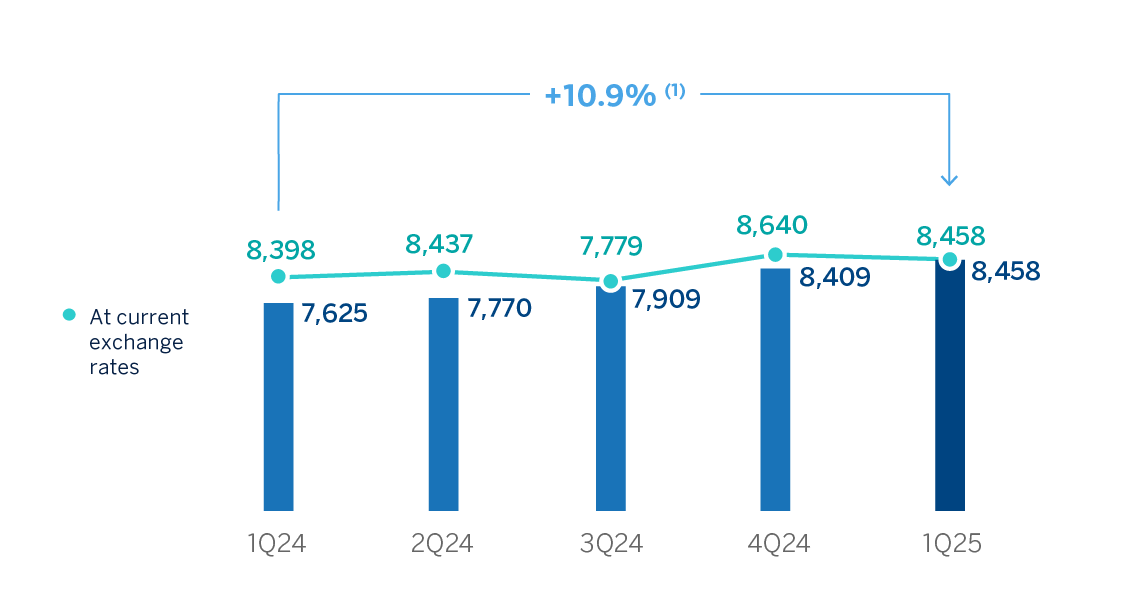
(1) At current exchange rates: +0.7%.
The NTI reported a 40.1% year-on-year growth at the end of the first quarter of 2025, mainly driven by the performance of the Corporate Center due to the hedging of the Group's foreign currency positions, especially the Mexican peso. All business areas showed a positive year-on-year evolution in this line, supported by the Global Markets contribution, except in Turkey, which was impacted by the foreign currency positions held in this area.
The other operating income and expenses line accumulated, as of March 31, 2025, a significantly improved result compared to the same period of the previous year. This is due to a lower negative impact derived from the hyperinflation in Argentina, as well as to the recording in the first quarter of 2024 of the total annual amount of the temporary tax on credit institutions and financial credit establishments for 285 million euros. The results of the insurance business, also recorded in this line, had a positive evolution.
GROSS INCOME
(MILLIONS OF EUROS AT CONSTANT EXCHANGE RATES)
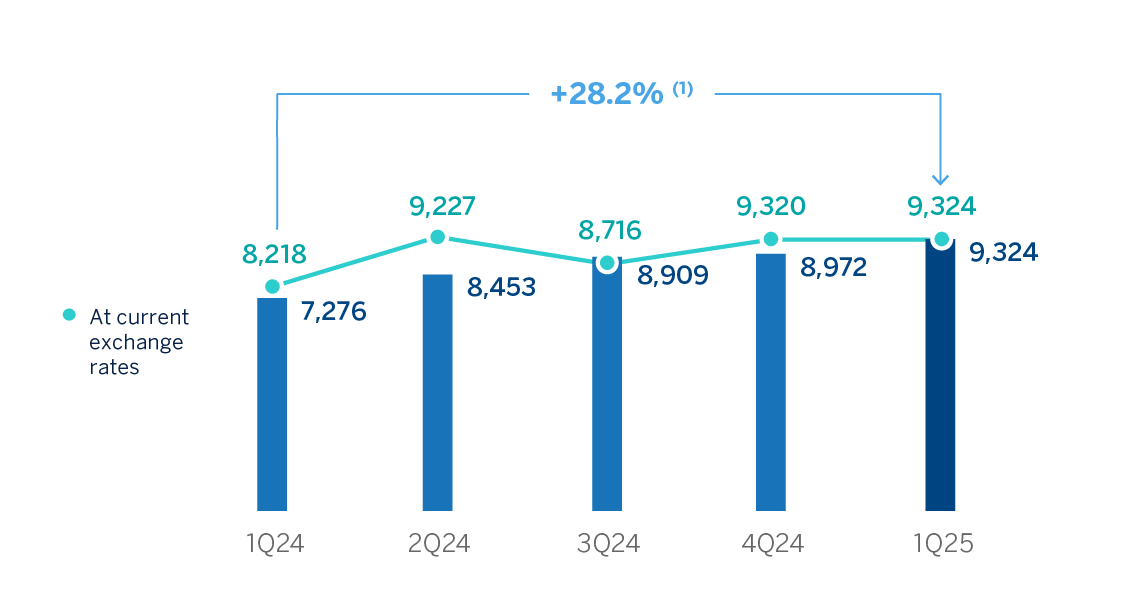
(1) At current exchange rates: +13.5%.
On a year-on-year basis, the increase in operating expenses at the Group level stood at 14.2%, a rate that is below the inflation rates observed in the countries in which the Group has a presence (an average of 16.7% in the last 12 months8).
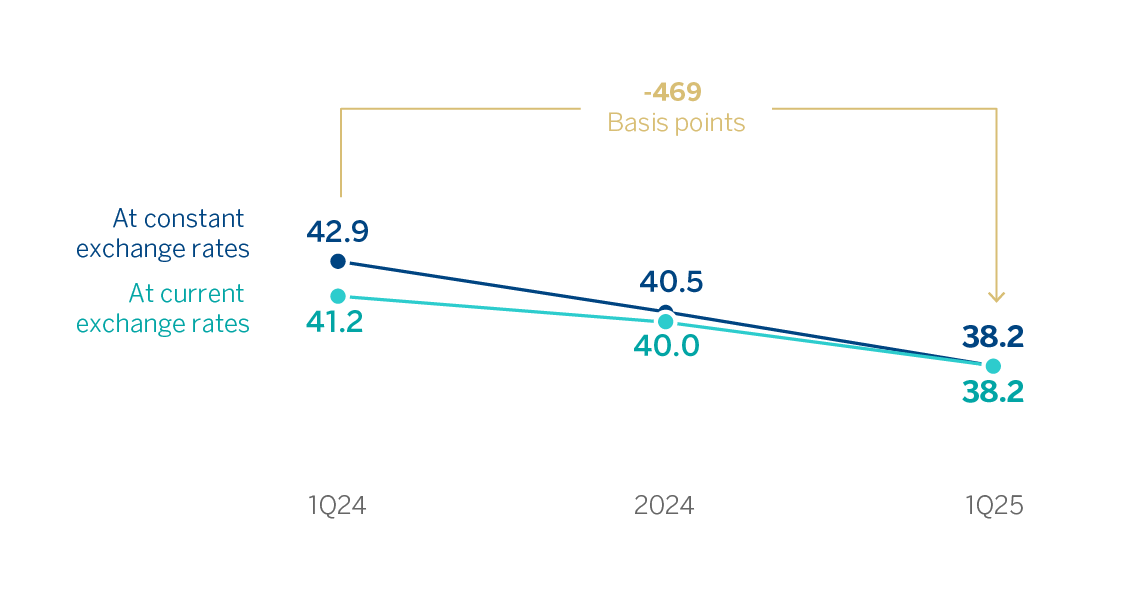
Thanks to the remarkable growth in gross income (+28.2%, higher than the growth in operating expenses, which stood at 14.2%), the efficiency ratio fell to 38.2% as of March 31, 2025, which represents an improvement of 469 basis points compared to the ratio as of March 31, 2024, at constant exchange rates.
OPERATING EXPENSES
(MILLIONS OF EUROS AT CONSTANT EXCHANGE RATES)
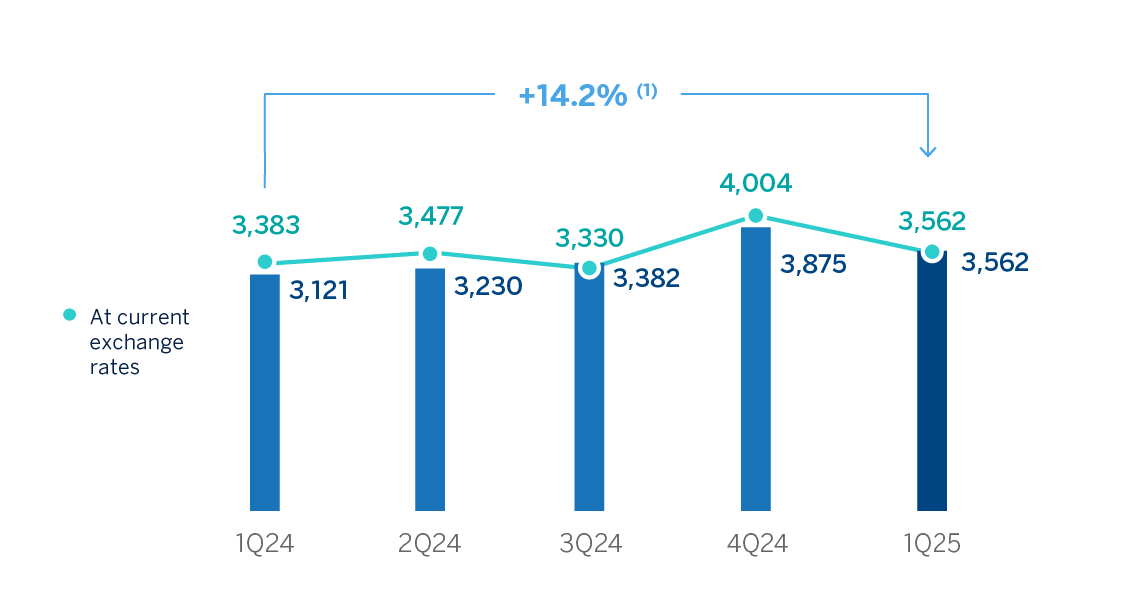
(1) At current exchange rates: +5.3%.
EFFICIENCY RATIO
(PERCENTAGE)
The impairment on financial assets not measured at fair value through profit or loss (impairment on financial assets) stood at the end of March 2025 at 11.9% above than the same period of the previous year, due to a higher rate of year-on-year growth in lending, both to companies and retail customers. Turkey and Mexico required an increase in the level of provisions, which was partially offset by lower needs in South America and Spain.
OPERATING INCOME
(MILLIONS OF EUROS AT CONSTANT EXCHANGE RATES)
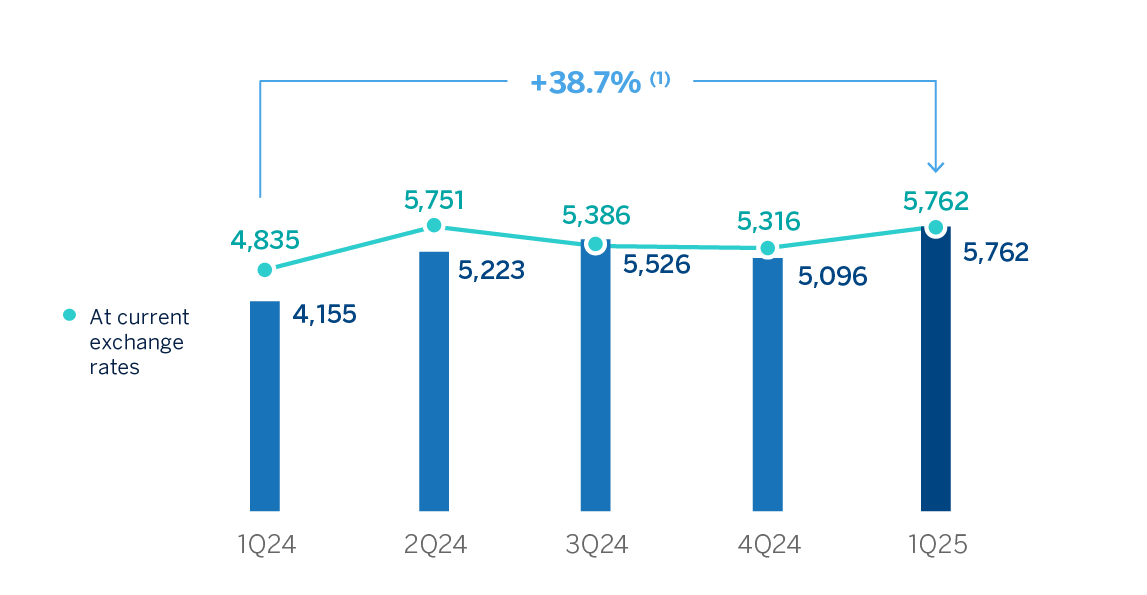
(1) At current exchange rates: +19.2%.
IMPAIRMENT ON FINANCIAL ASSETS
(MILLIONS OF EUROS AT CONSTANT EXCHANGE RATES)
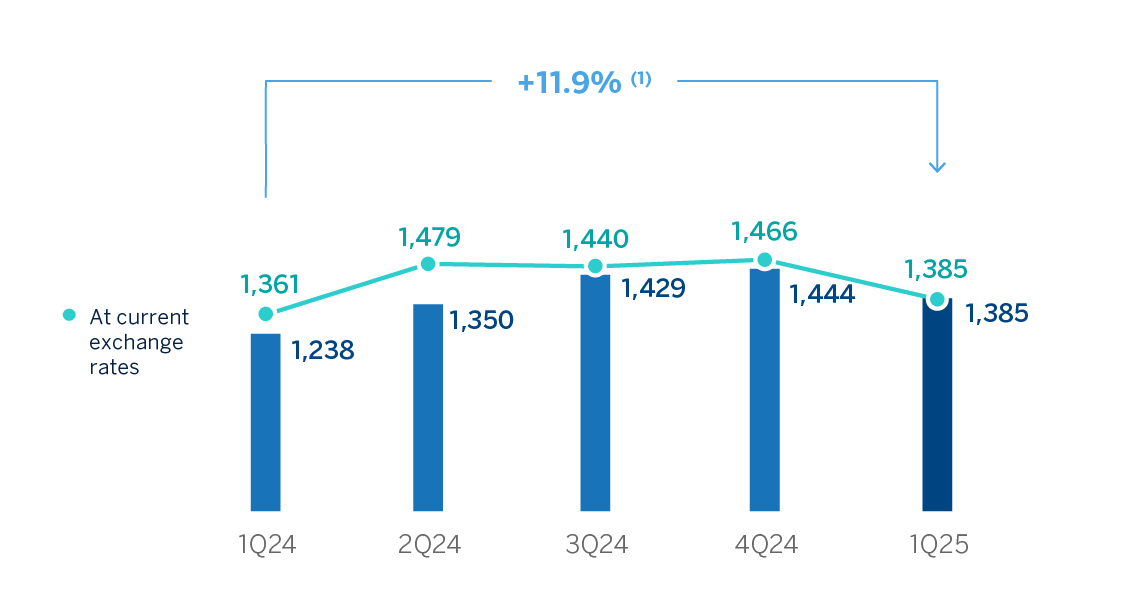
(1) At current exchange rates: +1.8%.
The provisions or reversal of provisions line (hereinafter provisions) registered at the end of March 31, 2025 lower provisions compared to the same period of the previous year, mainly due to the releases in South America, which offset the allocations in the rest of the areas.
On the other hand, the other gains (losses) line ended March 2025 with a balance of €22m, that is, 43.7% lower than in the same period of the previous year, which included the positive impact of the reversal of investment impairment in associated companies, recorded at the Corporate Center.
As a result of the above, the BBVA Group reached a net attributable profit of €2,698m in the first quarter of 2025, showing a significant growth compared to the same period of the previous year (+46.3%). This solid result is supported by the positive evolution of the recurring banking business income, and a less negative impact of hyperinflation, which, together with an improved NTI, have been able to offset both the increase in operating expenses and the rise in provisions for impairment losses on financial assets.
The net attributable profits, in millions of euros and accumulated at the end of March 2025 for the business areas that compose the Group were as follows: 1,024 in Spain, 1,332 in Mexico, 158 in Turkey, 218 in South America and 173 in Rest of Business.
NET ATTRIBUTABLE PROFIT (LOSS)
(MILLIONS OF EUROS AT CONSTANT EXCHANGE RATES)
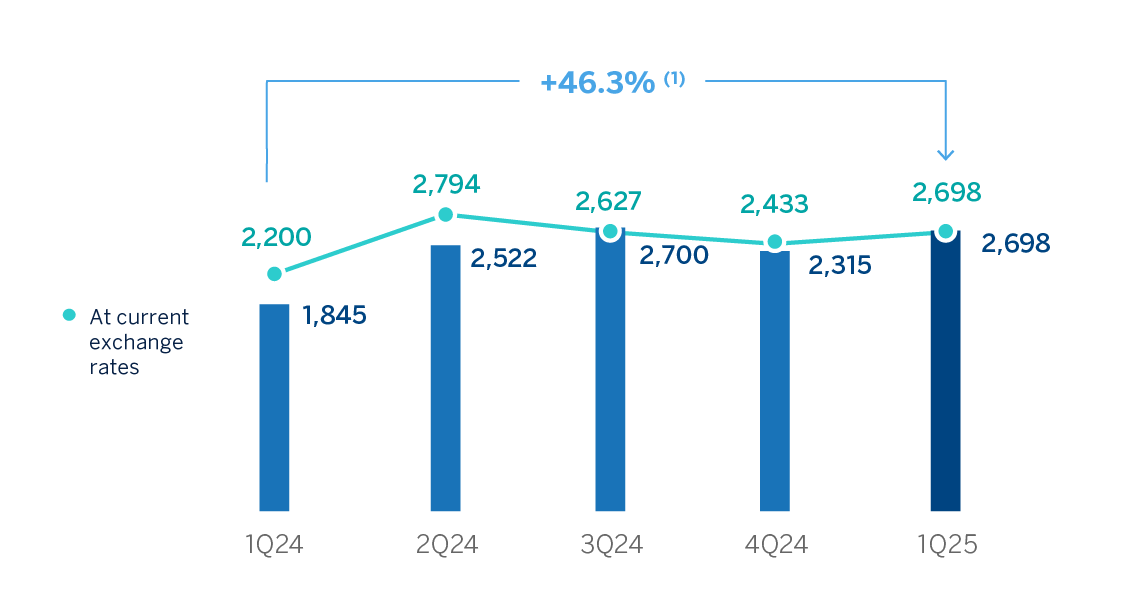
(1) At current exchange rates: +22.7%.
The Group's excellent performance has also allowed it to continue generating value, as is reflected in the growth of the tangible book value per share and dividends, which at the end of March 2025 was 14.1% higher than at the same period of the previous year.
TANGIBLE BOOK VALUE PER SHARE AND DIVIDENDS
(EUROS)
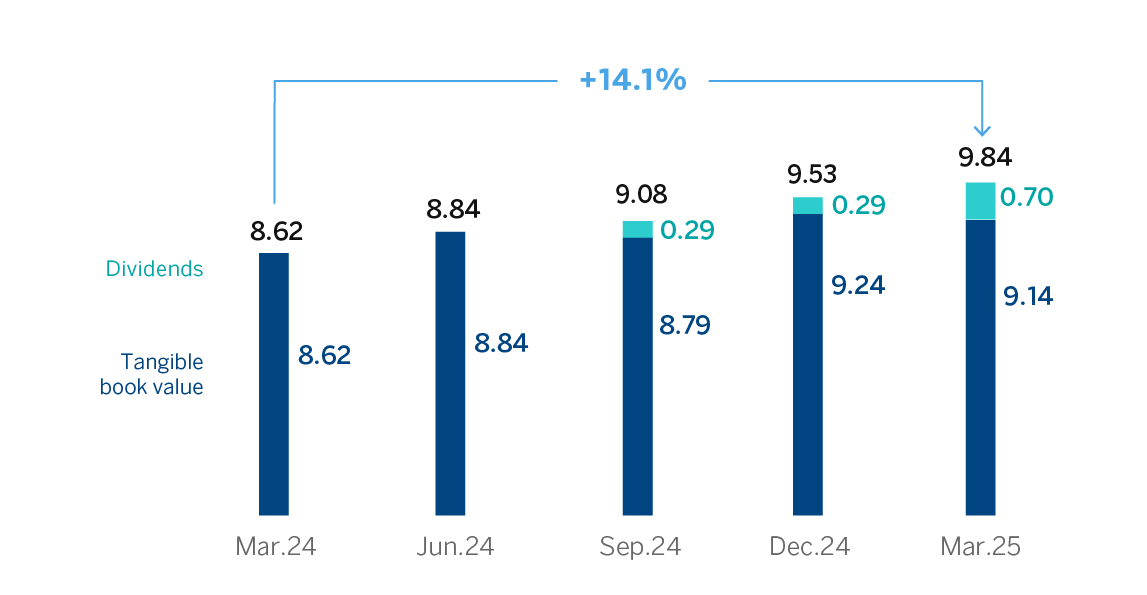
General note: replenishing dividends paid in the period. For more information, see Alternative Performance Measures at this report.
EARNING (LOSS) PER SHARE
(EUROS)
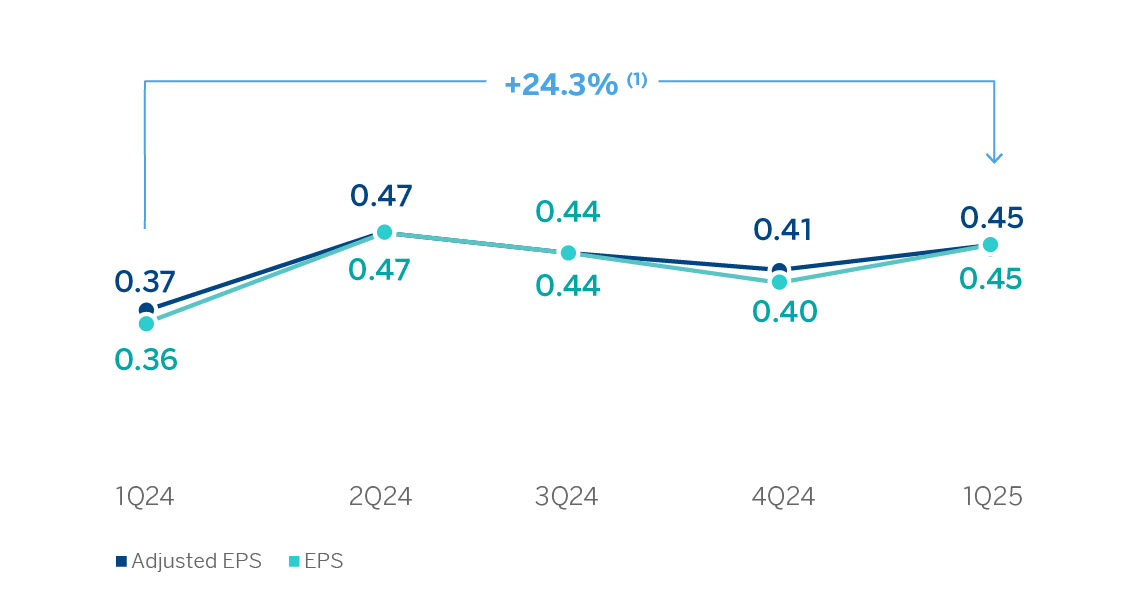
General note: Adjusted by additional Tier 1 instrument remuneration. For more information, see Alternative Performance Measures at this report.
(1) The year-on-year variation of adjusted EPS stands at 22.9%
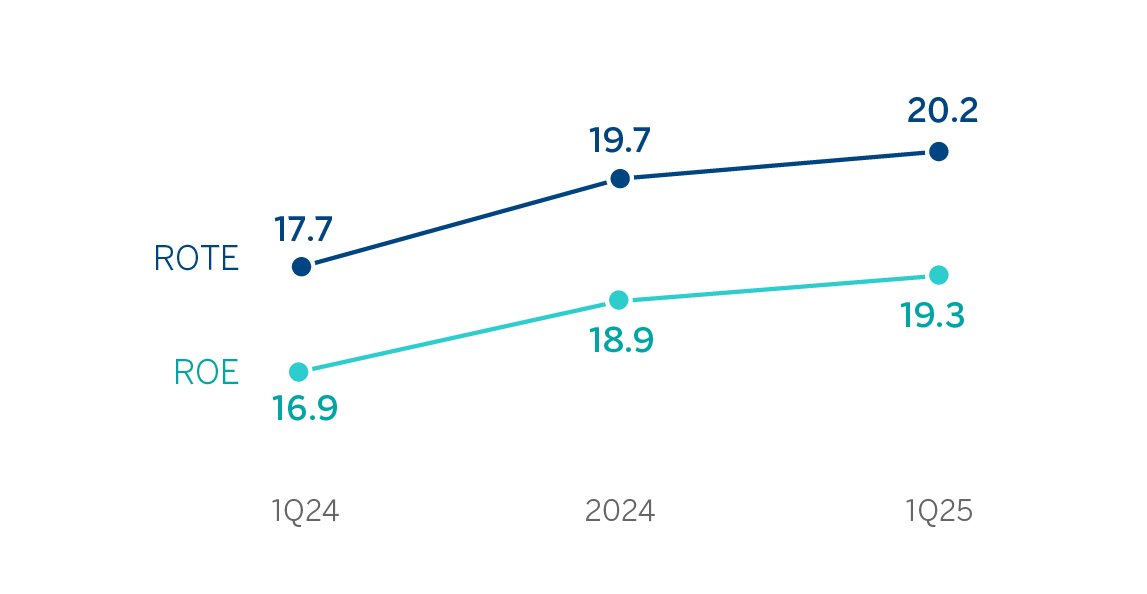
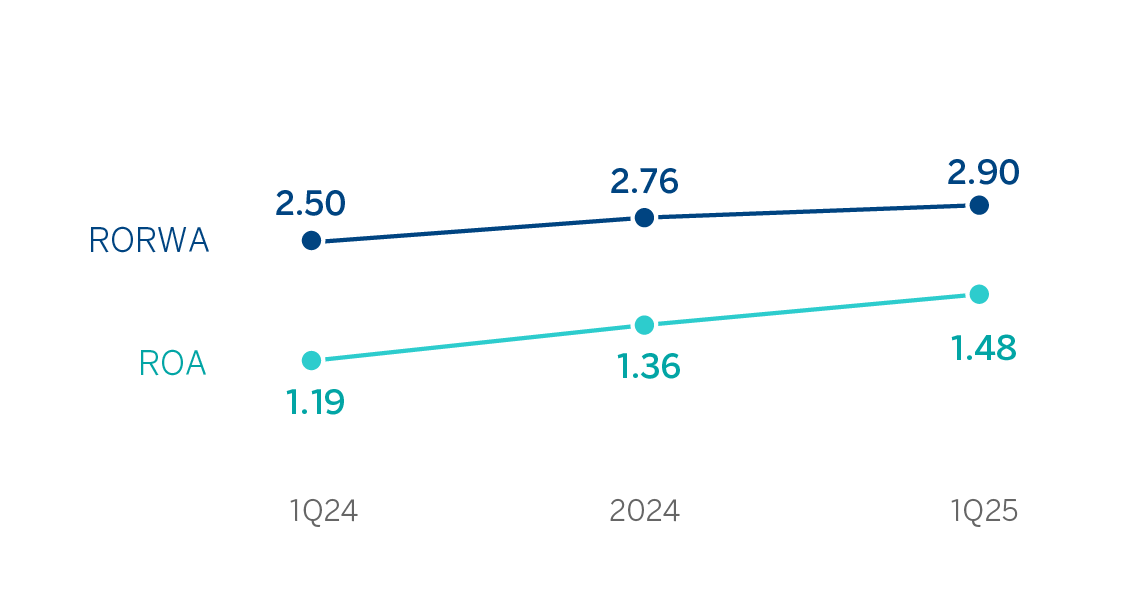
Lastly, the Group’s profitability indicators show BBVA's ability to combine higher growth rates and better profitability ratios in a way that differentiates it from its peers. All the indicators improved in year-on-year terms supported by the favorable performance of the results.
ROE AND ROTE
(PERCENTAGE)
ROA AND RORWA
(PERCENTAGE)
8 Weighted by operating expenses and excluding Venezuela.