

In the first quarter of 2013, the BBVA Group generated a net attributable profit of €1,734m, 72.6% above the figure for the same period in the previous year. This is the result of the following:
1. Resilience of the most recurring revenue, specifically net interest income plus income from fees and commissions.
2. Strong contribution of NTI.
3. Evolution of expenses in line with previous quarters.
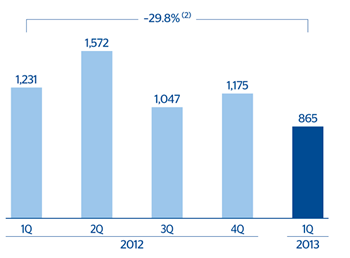
Net attributable profit (1)
(Million euros)
Consolidated income statement: quarterly evolution (1)
(Million euros)
|
|
2013 | 2012 | |||
|---|---|---|---|---|---|
|
|
1Q | 4Q | 3Q | 2Q | 1Q |
| Net interest income | 3,623 | 3,910 | 3,877 | 3,741 | 3,594 |
| Net fees and commissions | 1,052 | 1,126 | 1,104 | 1,061 | 1,062 |
| Net trading income | 719 | 646 | 319 | 461 | 340 |
| Dividend income | 19 | 17 | 35 | 311 | 27 |
| Income by the equity method | 51 | 191 | 169 | 175 | 191 |
| Other operating income and expenses | 7 | (32) | 6 | 57 | 51 |
| Gross income | 5,471 | 5,858 | 5,512 | 5,806 | 5,265 |
| Operating costs | (2,758) | (2,855) | (2,771) | (2,633) | (2,528) |
| Personnel expenses | (1,458) | (1,472) | (1,447) | (1,396) | (1,347) |
| General and administrative expenses | (1,025) | (1,089) | (1,064) | (1,001) | (951) |
| Depreciation and amortization | (276) | (294) | (259) | (236) | (230) |
| Operating income | 2,712 | 3,003 | 2,741 | 3,173 | 2,738 |
| Impairment on financial assets (net) | (1,376) | (2,675) | (2,038) | (2,182) | (1,085) |
| Provisions (net) | (167) | (228) | (195) | (98) | (130) |
| Other gains (losses) | 343 | (269) | (561) | (311) | (223) |
| Income before tax | 1,513 | (168) | (53) | 582 | 1,299 |
| Income tax | (395) | 220 | 275 | 3 | (223) |
| Net income from on-going operations | 1,118 | 52 | 222 | 584 | 1,076 |
| Net income from discontinued operations | 823 | 138 | 83 | 75 | 96 |
| Net income | 1,941 | 190 | 305 | 659 | 1,173 |
| Non-controlling interests | (206) | (170) | (159) | (154) | (168) |
| Net attributable profit | 1,734 | 20 | 146 | 505 | 1,005 |
| Adjusted (2) | 870 | (1,155) | (901) | (1,067) | (226) |
| Net attributable profit (adjusted) (2) | 865 | 1,175 | 1,047 | 1,572 | 1,231 |
| Basic earnings per share (euros) | 0.31 | 0.01 | 0.03 | 0.10 | 0.19 |
| Basic earnings per share adjusted (euros) (2) | 0.16 | 0.21 | 0.19 | 0.29 | 0.23 |
Consolidated income statement: quarterly evolution (1)
(Million euros)
|
|
1Q13 | Δ % | Δ % at constant exchange rates | 1Q12 |
|---|---|---|---|---|
| Net interest income | 3,623 | 0.8 | 2.5 | 3,594 |
| Net fees and commissions | 1,052 | (1.0) | (0.0) | 1,062 |
| Net trading income | 719 | 111.5 | 117.6 | 340 |
| Dividend income | 19 | (28.0) | (27.2) | 27 |
| Income by the equity method | 51 | (73.5) | (73.4) | 191 |
| Other operating income and expenses | 7 | (86.1) | (89.3) | 51 |
| Gross income | 5,471 | 3.9 | 5.2 | 5,265 |
| Operating costs | (2,758) | 9.1 | 10.2 | (2,528) |
| Personnel expenses | (1,458) | 8.2 | 9.2 | (1,347) |
| General and administrative expenses | (1,025) | 7.8 | 8.9 | (951) |
| Depreciation and amortization | (276) | 20.2 | 21.9 | (230) |
| Operating income | 2,712 | (0.9) | 0.5 | 2,738 |
| Impairment on financial assets (net) | (1,376) | 26.7 | 26.5 | (1,085) |
| Provisions (net) | (167) | 28.4 | 35.8 | (130) |
| Other gains (losses) | 343 | n.m. | n.m. | (223) |
| Income before tax | 1,513 | 16.4 | 19.6 | 1,299 |
| Income tax | (395) | 77.3 | 82.4 | (223) |
| Net income from on-going operations | 1,118 | 3.8 | 6.7 | 1,076 |
| Net income from discontinued operations | 823 | n.m. | n.m. | 96 |
| Net income | 1,941 | 65.5 | 69.3 | 1,173 |
| Non-controlling interests | (206) | 23.0 | 33.4 | (168) |
| Net attributable profit | 1,734 | 72.6 | 74.9 | 1,005 |
| Adjusted (2) | 870 | n.m. | n.m. | (226) |
| Net attributable profit (adjusted) (2) | 865 | (29.8) | (28.9) | 1,231 |
| Basic earnings per share (euros) | 0.31 |
|
|
0.19 |
| Basic earnings per share adjusted (euros) (2) | 0.16 |
|
|
0.23 |
4. Increased provisions, focused primarily on the commercial loans portfolio in Spain, as expected.
5. Generation of capital gains through a reinsurance operation for 90% of the individual life insurance portfolio in Spain and the closing of the sale of the pension business in Mexico.
In short, a quarter with high earnings, influenced by one-offs and with strong recurring revenue, despite the environment.