

Earnings and activity in South America in 2013 will be influenced by seasonality and the devaluation of the Venezuelan Bolivar Fuerte. This government action taken in February 2013 has an impact on each of the items on the financial statements in the area, but does not have a significant impact from the point of view of net attributable profit generated.
With respect to revenue, gross income in the first quarter of 2013 was €1,340m, 17.1% higher than 12 months before. This increase is due to the strong growth in activity in all the geographical areas, maintenance of spreads and the favorable NTI during the period.
On the side of costs, South America is continuing with its expansion and technological transformation plans in order to make the most of the growth opportunities presented by the region. These factors, combined with the inflation in the area, explain why operating expenses have remained high, with a year-on-year increase of 20.7% to €568m. Specifically, in the first quarter of the year branches have been opened in Chile, Colombia and Peru, and there has been a boost to the development of alternative distribution channels other than branches, such as mobile banking, online banking and the extension and renewal of the ATM network. Progress also continues to be made in changing the focus of how banking is carried out, shifting from product-centered banking to a customer-centric approach. Finally, a cross-cutting development plan is being undertaken in some businesses, such as payment channels, private banking, consumer finance and asset management. The efficiency ratio has improved in comparison with 2012 and ended the quarter at 42.4%. Finally, operating income stands at €772m, 14.6% up on the figure reported in the same period in 2012.
Impairment losses on financial assets amounted to €151m, with a double-digit increase that reflects the increased activity over recent quarters. As a result, the cumulative risk premium to March 2013 closed at 1.30%.
Overall, South America generated a net attributable profit in the first quarter of 2013 of €348m, a year-on-year fall of 1.3%. This can be broken down by country as follows:
- Argentina contributed €44m, thanks to strong performance of recurrent revenue, which has absorbed the increase in expenses and loan-loss provisions (the latter closely linked to the increase in activity).
- In Chile the net attributable profit stood at €49m, in an increasingly sophisticated market where there has been strong pressure in the first quarter on spreads and an unexpected rise in inflation.
- Colombia generated €80 million in earnings, strongly influenced by the good performance of activity and the increase in operating expenses and provisions.
- In Peru, the net attributable profit was €48m, with a positive trend in net interest income and NTI. They offset the fall in income from fees and commissions due to the coming into force of the new transparency regulations for the banking system, which since January 1, 2013 have banned the charging of certain fees. The above, together with increased expenses and loan-loss provisions (the latter closely linked to the positive performance of activity), explain the year-on-year growth of 3.8% in the country’s net attributable profit.
- Venezuela has shown a significant growth in earnings in the first quarter of the year to €96m. This was due to the good performance of activity and the revaluation of the US dollar positions in the bank as a result of the devaluation announced by the Venezuelan government in February.
- Lastly, BBVA Panama reported net attributable profit of €6m, BBVA Paraguay €5m and BBVA Uruguay €7m.
South America. Operating income(Million euros at constant exchange rates) |
South America. Net attributable profit(Million euros at constant exchange rates) |
|---|---|
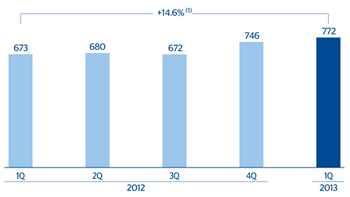
(1) At current exchange rates: +6.1%. |
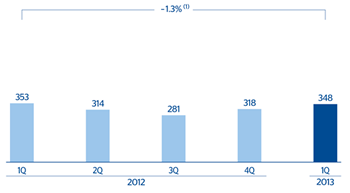
(1) At current exchange rates: -6.9%. |
South America. Data per country
(Million euros)
|
|
Operating income | Net attributable profit | ||||||
|---|---|---|---|---|---|---|---|---|
| Country | 1Q13 | Δ % | Δ % at constant exchange rates | 1Q12 | 1Q13 | Δ % | Δ % at constant exchange rates | 1Q12 |
| Argentina | 104 | (7.4) | 7.7 | 112 | 44 | (24.1) | (11.7) | 58 |
| Chile | 72 | (12.2) | (14.7) | 82 | 49 | (38.1) | (39.8) | 80 |
| Colombia | 128 | 0.1 | 0.3 | 128 | 80 | (4.0) | (3.8) | 84 |
| Peru | 159 | 11.9 | 8.2 | 142 | 48 | 4.6 | 1.1 | 46 |
| Venezuela | 273 | 17.7 | 46.7 | 232 | 96 | 13.0 | 40.9 | 85 |
| Other countries (1) | 35 | 14.9 | 11.8 | 31 | 30 | 41.2 | 39.7 | 21 |
| Total | 772 | 6.1 | 14.6 | 727 | 348 | (6.9) | (1.3) | 374 |