

At the end of the first quarter of 2013, the Group’s main asset quality indicators had evolved as expected:
- An uptick in the NPA ratio to 5.3%, as a result of the deteriorating situation in Spain. The coverage ratio remains at the levels reported at the close of 2012.
- The asset quality indicators, in terms of NPA and coverage ratios, improved in the United States and remained stable in the rest of geographical areas.
As of 31-Mar-2013, the Group’s total risks with customers (including contingent liabilities) totaled €410,440m. This represents a 0.8% increase over the quarter, due basically to the positive impact of exchange rates, the temporary rise in the most volatile balances from repo agreements related to market operations in Spain and stronger activity in emerging economies. All this in a context of reduced lending activity in Spain and in the Group’s CIB portfolios. In year-on-year terms, the increase is 2.5%, due mainly to the incorporation of Unnim in the second quarter of 2012 and also to the positive impact of currencies.
Credit risk management (1)
(Million euros)
|
|
31-03-13 | 31-12-12 | 30-09-12 | 30-06-12 | 31-03-12 |
|---|---|---|---|---|---|
| Non-performing assets | 21,808 | 20,603 | 20,114 | 16,481 | 16,096 |
| Total risks | 410,440 | 407,126 | 417,405 | 409,145 | 400,553 |
| Provisions | 15,482 | 14,804 | 13,877 | 10,822 | 9,726 |
| Specific | 10,754 | 9,752 | 9,687 | 7,744 | 6,665 |
| Generic and country-risk | 4,729 | 5,052 | 4,190 | 3,078 | 3,061 |
| NPA ratio (%) | 5.3 | 5.1 | 4.8 | 4.0 | 4.0 |
| NPA coverage ratio (%) | 71 | 72 | 69 | 66 | 60 |
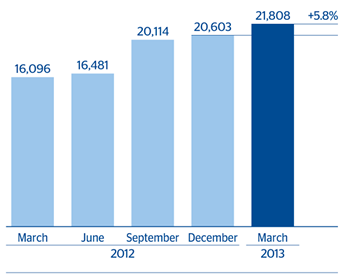
The balance of non-performing assets ended as of 31-Mar-2013 at €21,808m, compared to €20,603m in December 2012 (up 5.8%). The increase is concentrated in Spain, where the NPA ratio continues to increase in line with estimates, mainly as a result of the impairment of the commercial loan portfolio. Both additions and recoveries declined over the quarter, with net additions to NPA ending the period at €1,944m.
Non-performing assets evolution
(Million euros)
|
|
1Q13 | 4Q12 | 3Q12 | 2Q12 | 1Q12 |
|---|---|---|---|---|---|
| Beginning balance | 20,603 | 20,114 | 16,481 | 16,096 | 15,866 |
| Entries | 3,603 | 4,041 | 3,634 | 3,717 | 3,092 |
| Recoveries | (1,659) | (2,400) | (1,883) | (2,090) | (1,887) |
| Net variation | 1,944 | 1,642 | 1,751 | 1,627 | 1,204 |
| Write-offs | (655) | (1,172) | (1,096) | (1,121) | (1,002) |
| Exchange rate differences and other | (84) | 19 | 2,979 | (121) | 28 |
| Period-end balance | 21,808 | 20,603 | 20,114 | 16,481 | 16,096 |
| Memorandum item: |
|
|
|
|
|
| Non-performing loans | 21,460 | 20,287 | 19,834 | 16,243 | 15,880 |
| Non-performing contingent liabilities | 348 | 317 | 280 | 238 | 216 |
Non-performing assets
(Million euros)
The Group’s NPA ratio ended March 2013 at 5.3%, up 25 basis points over the quarter. This is mainly due to the worsening economic situation in Spain mentioned above, which mostly affects commercial lending, and the decreased business activity. The NPA ratio of the banking business in the country stands at 4.3%, up 32 basis points over the quarter. The ratio in real-estate activity in Spain closed the quarter at 46.6% (42.8% as of 31-Dec-2012). In Eurasia, the NPA ratio closed March at 3.0%, while in the United States it improved substantially, by 53 basis points to 1.8%. In the rest of geographical areas this ratio has remained practically stable over the quarter. In Mexico it ended at 3.7% (3.8% in December 2012) and in South America at 2.2% (2.1% as of 31-Dec-2012).
Lastly, coverage provisions for customer risk amount to €15,482m, up 4.6% quarter-on-quarter, due mainly to increased provisions in Spain. The Group’s coverage ratio at the close of March was 71%. By business area, the ratio increased significantly in the United States, from 90% to 109%. It remains stable in Spain, Eurasia and Latin America, at 50%, 87% and 143%, respectively, at the end of the first quarter of 2013 (48%, 87% and 146%, respectively, at the close of December 2012). In real-estate activity in Spain it stands at 76% (82% at the close of 2012). Finally, in Mexico the figure has increased to 117% (114% as of December 2012).
NPA and coverage ratios
(Percentage)
