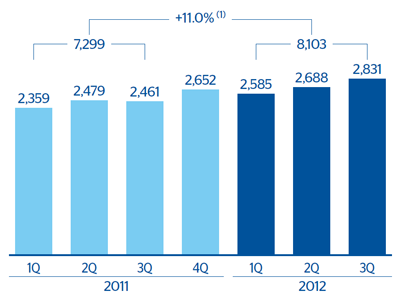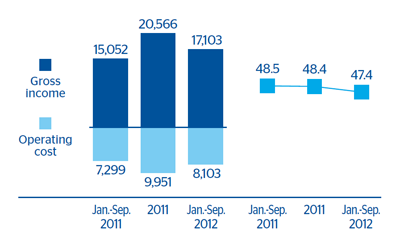
The most significant aspect of operating expenses continues to be their strict control in developed countries and their growth in emerging areas, in line with the figures mentioned in previous quarters. In the cumulative figure through September 2012, this heading totaled €8,103m, 11.0% up year-on-year, well below the increase in revenue. As a result:
- There was an improvement of the efficiency ratio on the figure for the same period in 2011 to 47.4% at the end of September.
- The Bank maintained its leadership position in efficiency among its peer group.
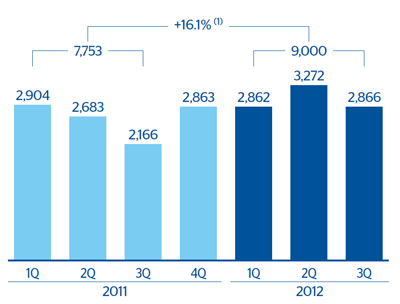
- Cumulative operating income amounted to €9,000m, 16.1% up on the figure for the first nine months of 2011.
BBVA closed September with 117,475 employees, 3,028 of them in Unnim. Excluding the incorporation of Unnim, the figure increased last year by 3,822, mainly in Mexico and to a lesser extent in South America, and fell in the United States and Spain. The number of branches, which stood at 8,072 as of 30-Sep-2012, includes 556 Unnim branches. Excluding these, the increase is also concentrated in South America and Mexico. Finally, ATMs amounted to 20,181, and reflected the same trend as the number for employees and branches. The figure includes 715 Unnim ATMs, and the increase continued to be concentrated basically in the countries of Latin America.