CIB highlights in the third quarter
- Positive performance of lending activity in Latin America and reduction in Europe and the United States.
- Favorable performance of customer funds in September, which represents a turning point.
- Resilience and recurrence of earnings in a very complex environment.
Industry Trends
The economic environment in the third quarter of 2012 was very complex, with extremely high volatility in the financial markets at the start of the period. Half-way through the quarter, the trend changed, mainly due to the already mentioned announcement by the ECB of possible sovereign debt purchases in cases where economies within the euro zone needed stabilization. This new environment has helped reduce volatility and pushed-up the fixed-income and equity markets globally. These effects are positive for banks with exposure to the global markets business. Against this backdrop, transactional and lending activity remains well below pre-2009 levels. Trade finance is also down as a result of a slight slowdown in some of the most dynamic economies (such as China and Brazil).
In this turbulent situation, Corporate & Investment Banking has managed to improve its earnings compared with those for the first nine months of 2011, by leveraging its relationship with key clients and its geographical diversification.
Unless indicated otherwise, all comments below on percentage changes refer to constant exchange rates.
Income statement
(Million euros)
|
Corporate & Investment Banking |
|
January-Sep. 12 |
Δ% |
Δ% (1) |
January-Sep. 11 |
| Net interest income |
1,289 |
12.2 |
9.8 |
1,149 |
| Net fees and commissions |
529 |
8.7 |
6.6 |
486 |
| Net trading income |
183 |
(10.6) |
(15.7) |
205 |
| Other income/expenses |
66 |
3.4 |
7.0 |
63 |
| Gross income |
2,067 |
8.6 |
6.0 |
1,904 |
| Operating costs |
(659) |
5.5 |
3.3 |
(625) |
| Personnel expenses |
(370) |
0.5 |
(1.0) |
(368) |
| General and administrative expenses |
(279) |
10.5 |
7.3 |
(253) |
| Deprecation and amortization |
(11) |
119.5 |
113.0 |
(5) |
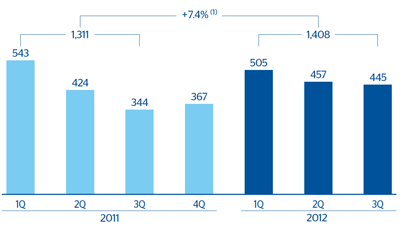
| Operating income |
1,408 |
10.0 |
7.4 |
1,279 |
| Impairment on financial assets (net) |
(109) |
82.3 |
78.8 |
(60) |
| Provisions (net) and other gains (losses) |
(11) |
50.4 |
38.6 |
(7) |
| Income before tax |
1,288 |
6.2 |
3.7 |
1,212 |
| Income tax |
(379) |
9.3 |
6.7 |
(346) |
| Net income |
909 |
5.0 |
2.5 |
866 |
| Non-controlling interests |
(90) |
52.0 |
38.1 |
(59) |
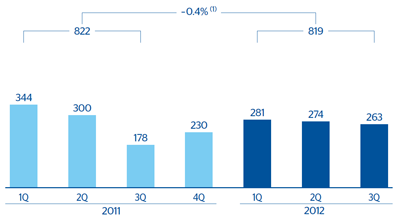
| Net attributable profit |
819 |
1.5 |
(0.4) |
806 |
(1) At constant exchange rate.
Balance sheet
(Million euros)
|
Corporate & Investment Banking |
|
30-09-12 |
Δ% |
Δ% (1) |
30-09-11 |
| Cash and balances with central banks |
8,131 |
(4.7) |
(6.1) |
8,528 |
| Financial assets |
87,474 |
10.3 |
7.8 |
79,298 |
| Loans and receivables |
65,161 |
(12.6) |
(14.4) |
74,547 |
| Loans and advances to customers |
53,712 |
(2.3) |
(5.0) |
54,997 |
| Loans and advances to credit institutions and other |
11,449 |
(41.4) |
(41.5) |
19,549 |
| Inter-area positions |
16,534 |
n.m. |
n.m. |
2,903 |
| Tangible assets |
35 |
42.0 |
39.0 |
25 |
| Other assets |
3,004 |
27.0 |
23.7 |
2,365 |
| Total assets/Liabilities and equity |
180,340 |
7.6 |
5.2 |
167,666 |
| Deposits from central banks and credit institutions |
73,093 |
32.2 |
28.7 |
55,302 |
| Deposits from customers |
36,274 |
(25.6) |
(27.8) |
48,769 |
| Debt certificates |
(106) |
(46.9) |
(46.9) |
(199) |
| Subordinated liabilities |
1,623 |
(17.7) |
(20.7) |
1,973 |
| Inter-area positions |
- |
- |
- |
- |
| Financial liabilities held for trading |
58,509 |
19.9 |
19.5 |
48,779 |
| Other liabilities |
5,395 |
(41.9) |
(43.9) |
9,283 |
| Economic capital allocated |
5,550 |
47.7 |
43.2 |
3,758 |
(1) At constant exchange rate.
C&IB. Operating income
(Million euros at constant exchange rates)
(1) At current exchange rates: +10.0%.
C&IB. Net attributable profit
(Million euros at constant exchange rates)
(1) At current exchange rates: +1.5%.