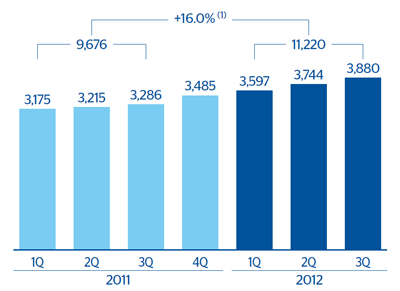
The BBVA Group’s net interest income maintained the growth path started in the last quarter of 2010. It totaled €3,880m in the third quarter of 2012 and €11,220m between January and September, up 16.0% year-on-year. The increase is due to the defense of customer spreads in practically all the geographical areas where the Bank operates, strong activity in emerging markets and positive management of structural interest-rate risk in an environment marked by low interest rates. By geographical area, the following results are worth noting:
- Spain has recorded a steady increase in quarterly net interest income since the end of last year, thanks to good price management through the repricing of loans and greater contribution from mortgage floors. All this against a backdrop of lower volumes, as a result of the necessary deleveraging taking place in the country and falling interest rates. Overall, this area generated cumulative net interest income of €3,571m, with a rise of 8.0% compared with the figure for the same period in 2011.
- Eurasia has posted strong growth in net interest income due to the incorporation of Garanti on March 22, 2011. Like for like, this heading grew 23% at Garanti Bank thanks to strong activity with retail customers and very good figures from customer spreads, particularly due to the reduced cost of liabilities. However, the CIB business in the area shows a 28.3% drop in this line owing to falling volumes. As of September 2012, the net interest income contributed by Eurasia was 16.0% higher than in the same period last year, totaling €603m.
- Cumulative net interest income in Mexico amounted to €3,079m, an increase of 8.5% year-on-year at constant exchange rates, despite the current low interest rates in the country. This is basically due to sustained growth in activity, especially from the retail portfolio.
- Once again, net interest income in South America performed very well. Strong business activity, combined with the defense of spreads through good price management, explain this excellent performance. The cumulative figure as of September 2012 was €3,087m, up 25.6% on the same period last year (excluding the impact of the exchange rate).
- In the United States, net interest income continued to be negatively affected by the Guaranty run-off, lower business volume in CIB, write-downs in securities portfolios and the current environment of low interest rates with a practically flat curve. On the other hand, the increase in loan volumes and the year-on-year reduction in the cost of deposits had a positive impact. As a result, over the quarter this heading remained at the level of previous quarters, totaling €1,285m for the year, down 3.6% year-on-year at constant exchange rates.