Eurasia highlights in the third quarter
- Favorable trend in retail customer activity.
- Positive performance of the more recurrent revenue.
- CNCB announces 28.9% year-on-year growth of earnings.
- Strong solvency and liquidity position in Garanti.
- Garanti successfully completes the largest Eurobond issue ever made by a Turkish bank.
Industry Trends
The economic backdrop in the third quarter of 2012 for Europe was difficult, with highly volatile markets. However, progress was clearly achieved in the European project following the summit held at the end of June, laying the foundations for future banking union in the area.
In Turkey, the most important feature over the quarter was that the less restrictive monetary policy applied by the Turkish central bank. This should help boost economic growth. Basel II regulations began to be applied in July. The impact has been slightly negative on the capital ratio of the sector as a whole, but positive in the case of Garanti.
Finally, in China the two consecutive interest rate cuts (in June and July), the reductions of 150 basis points in the reserve ratio announced in December and the increased regulatory flexibility, have boosted bank lending. At the same time, the fall in real estate prices has stabilized and an upturn in lending through the banking system is helping to moderate credit growth in the informal financial industry.
Income statement
(Million euros)
|
Eurasia |
|
January-Sep. 12 |
Δ% |
January-Sep. 11 |
| Net interest income |
603 |
16.0 |
519 |
| Net fees and commissions |
336 |
17.2 |
287 |
| Net trading income |
91 |
0.8 |
90 |
| Other income/expenses |
595 |
37.4 |
433 |
| Gross income |
1,624 |
22.2 |
1,329 |
| Operating costs |
(576) |
32.2 |
(436) |
| Personnel expenses |
(299) |
21.4 |
(246) |
| General and administrative expenses |
(232) |
46.3 |
(159) |
| Deprecation and amortization |
(45) |
45.7 |
(31) |
| Operating income |
1,048 |
17.3 |
893 |
| Impairment on financial assets (net) |
(138) |
105.5 |
(67) |
| Provisions (net) and other gains (losses) |
(20) |
n.m. |
17 |
| Income before tax |
890 |
5.5 |
844 |
| Income tax |
(77) |
(37.8) |
(124) |
| Net income |
813 |
13.0 |
719 |
| Non-controlling interests |
- |
- |
- |
| Net attributable profit |
813 |
13.0 |
719 |
Balance sheet
(Million euros)
|
Eurasia |
|
30-09-12 |
Δ% |
30-09-11 |
| Cash and balances with central banks |
2,097 |
9.9 |
1,908 |
| Financial assets |
12,268 |
10.8 |
11,070 |
| Loans and receivables |
34,593 |
(10.1) |
38,492 |
| Loans and advances to customers |
31,457 |
(8.0) |
34,188 |
| Loans and advances to credit institutions and other |
3,136 |
(27.1) |
4,304 |
| Inter-area positions |
- |
- |
- |
| Tangible assets |
587 |
1.9 |
576 |
| Other assets |
1,179 |
0.9 |
1,169 |
| Total assets/Liabilities and equity |
50,724 |
(4.7) |
53,214 |
| Deposits from central banks and credit institutions |
15,523 |
(8.2) |
16,908 |
| Deposits from customers |
18,383 |
(18.3) |
22,504 |
| Debt certificates |
1,015 |
29.8 |
782 |
| Subordinated liabilities |
907 |
(54.7) |
2,003 |
| Inter-area positions |
5,530 |
71.6 |
3,224 |
| Financial liabilities held for trading |
412 |
28.9 |
319 |
| Other liabilities |
4,235 |
60.9 |
2,632 |
| Economic capital allocated |
4,720 |
(2.5) |
4,843 |
Significant ratios
(Percentage)
|
Eurasia |
|
30-09-12 |
30-06-12 |
30-09-11 |
| Efficiency ratio |
35.5 |
33.7 |
32.8 |
| NPA ratio |
1.7 |
1.4 |
1.5 |
| NPA coverage ratio |
114 |
119 |
118 |
| Risk premium |
0.52 |
0.45 |
0.28 |
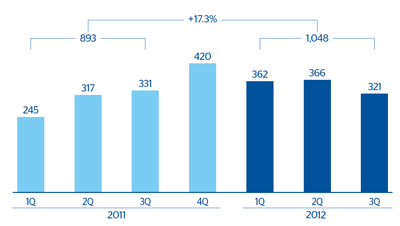
Eurasia. Operating income
(Million euros)
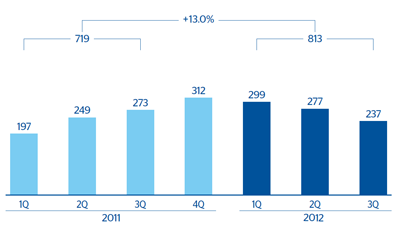
Eurasia. Net attributable profit
(Million euros)


