
Group
Results
The BBVA Group generated a net attributable profit of €2,200m between January and March of 2024, driven by the performance of recurring revenues of the banking business. Thus, the net interest income grew at a year-on-year rate of 15.4% and net fees and commissions by 31.1%. This result represents an increase of 19.1% compared to the same period of the previous year.
It should to be noted that the results of the first quarter of 2024 include the recording for the total annual amount paid for the temporary tax on credit institutions and financial credit institutions3 for €285m, included in the other operating income and expenses line of the income statement. This amount is higher than the recorded in the same line in the same period of the previous year.
| CONSOLIDATED INCOME STATEMENT (MILLIONS OF EUROS) | ||||
|---|---|---|---|---|
| 1Q24 | ∆ % | ∆ % at constant exchange rates | 1Q23 | |
| Net interest income | 6,512 | 15.4 | 24.5 | 5,642 |
| Net fees and commissions | 1,887 | 31.1 | 36.5 | 1,439 |
| Net trading income | 772 | 76.2 | 123.9 | 438 |
| Other operating income and expenses | (952) | 69.7 | 39.5 | (561) |
| Gross income | 8,218 | 18.1 | 31.0 | 6,958 |
| Operating expenses | (3,383) | 12.2 | 19.5 | (3,016) |
| Personnel expenses | (1,778) | 14.7 | 22.9 | (1,551) |
| Other administrative expenses | (1,229) | 9.1 | 17.4 | (1,127) |
| Depreciation | (375) | 10.9 | 11.2 | (339) |
| Operating income | 4,835 | 22.7 | 40.5 | 3,942 |
| Impairment on financial assets not measured at fair value through profit or loss | (1,361) | 40.5 | 40.7 | (968) |
| Provisions or reversal of provisions | (57) | n.s. | n.s. | (14) |
| Other gains (losses) | 40 | n.s. | n.s. | (16) |
| Profit (loss) before tax | 3,458 | 17.4 | 41.2 | 2,944 |
| Income tax | (1,151) | 21.2 | 43.0 | (950) |
| Profit (loss) for the period | 2,307 | 15.7 | 40.4 | 1,994 |
| Non-controlling interests | (107) | (27.9) | 111.1 | (148) |
| Net attributable profit (loss) | 2,200 | 19.1 | 38.1 | 1,846 |
| Adjusted earning (loss) per share (euros) (1) | 0.37 | 0.30 | ||
| Earning (loss) per share (euros) (1) | 0.36 | 0.29 | ||
(1) Adjusted by additional Tier 1 instrument remuneration. For more information, see Alternative Performance Measures at the end of this report.
Unless expressly indicated otherwise, for a better understanding of the changes under the main headings of the Group's income statement, the rates of change provided below refer to constant exchange rates. When comparing two dates or periods in this report, the impact of changes in the exchange rates against the euro of the currencies of the countries in which BBVA operates is sometimes excluded, assuming that exchange rates remain constant. For this purpose, the average exchange rate of the currency of each geographical area of the most recent period is used for both periods, except for those countries whose economies have been considered hyperinflationary, for which the closing exchange rate of the most recent period is used.
| CONSOLIDATED INCOME STATEMENT: QUARTERLY EVOLUTION (MILLIONS OF EUROS) | ||||||
|---|---|---|---|---|---|---|
| 2024 | ||||||
| 1Q | 4Q | 3Q | 2Q | 1Q | ||
| Net interest income | 6,512 | 5,246 | 6,434 | 5,768 | 5,642 | |
| Net fees and commissions | 1,887 | 1,694 | 1,685 | 1,470 | 1,439 | |
| Net trading income | 772 | 753 | 658 | 334 | 438 | |
| Other operating income and expenses | (952) | (255) | (820) | (383) | (561) | |
| Gross income | 8,218 | 7,438 | 7,956 | 7,189 | 6,958 | |
| Operating expenses | (3,383) | (3,068) | (3,303) | (2,922) | (3,016) | |
| Personnel expenses | (1,778) | (1,693) | (1,756) | (1,530) | (1,551) | |
| Other administrative expenses | (1,229) | (1,025) | (1,169) | (1,054) | (1,127) | |
| Depreciation | (375) | (349) | (378) | (337) | (339) | |
| Operating income | 4,835 | 4,370 | 4,654 | 4,267 | 3,942 | |
| Impairment on financial assets not measured at fair value through profit or loss | (1,361) | (1,225) | (1,210) | (1,025) | (968) | |
| Provisions or reversal of provisions | (57) | (163) | (81) | (115) | (14) | |
| Other gains (losses) | 40 | (49) | 2 | 50 | (16) | |
| Profit (loss) before tax | 3,458 | 2,932 | 3,365 | 3,178 | 2,944 | |
| Income tax | (1,151) | (799) | (1,226) | (1,028) | (950) | |
| Profit (loss) for the period | 2,307 | 2,133 | 2,139 | 2,150 | 1,994 | |
| Non-controlling interests | (107) | (75) | (56) | (118) | (148) | |
| Net attributable profit (loss) | 2,200 | 2,058 | 2,083 | 2,032 | 1,846 | |
| Adjusted earning (loss) per share (euros) (1) | 0.37 | 0.34 | 0.34 | 0.34 | 0.30 | |
| Earning (loss) per share (euros) (1) | 0.36 | 0.33 | 0.33 | 0.33 | 0.29 | |
(1) Adjusted by additional Tier 1 instrument remuneration. For more information, see Alternative Performance Measures at the end of this report.
The accumulated net interest income as of March 31, 2024 was higher than in the same period of the previous year (+24.5%), with increases in all business areas except for Turkey, as a result of greater volumes of performing loan. The good evolution in South America and Spain is noteworthy.
Positive evolution in the net fees and commissions line, which increased by 36.5% year-on-year due to the favorable performance in payment systems and, to a lesser extent, asset management. By business areas, Turkey´s and Mexico´s contribution stood out.
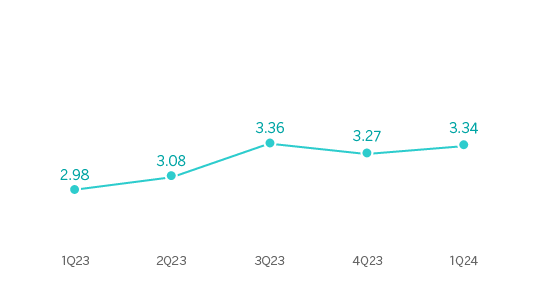
NET INTEREST INCOME / AVERAGE TOTAL ASSETS
(PERCENTAGE AT CONSTANT EXCHANGE RATES)
NET INTEREST INCOME PLUS NET FEES AND COMMISSIONS
(MILLIONS OF EUROS AT CONSTANT EXCHANGE RATES)
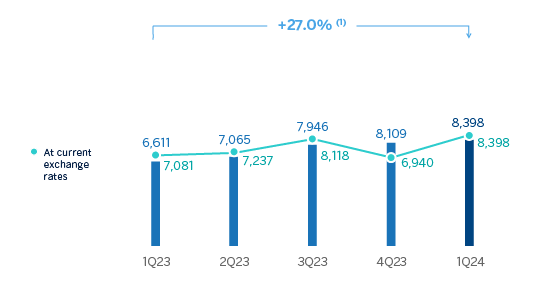
(1) At current exchange rates: +18.6%.
At the end of March 2024, NTI grew by 123.9%, with a positive performance of this line in all business areas, favored by the results of the Global Markets unit, which offset comfortably the negative results recorded in the Corporate Center.
The other operating income and expenses line accumulated as of March 31, 2024 a result that compares negatively with the same date of the same period of last year, mainly due to the recording in the line of a more negative adjustment for hyperinflation in Argentina. This line also reflects the total estimated amount of the temporary tax on credit institutions and financial credit establishments for year 2024 registered in the first quarter of 2024 and 60 million higher than the annual amount estimated for year 2023, registered in the first quarter of that year.
GROSS INCOME
(MILLIONS OF EUROS AT CONSTANT EXCHANGE RATES)
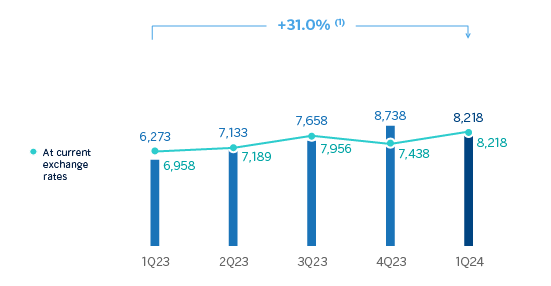
(1) At current exchange rates: +18.1%.
On a year-on-year basis, operating expenses increased by 19.5% at the Group level, a rate that is below the inflation rates observed in the countries in which the Group operates (an average of 19.7% in the last 12 months).
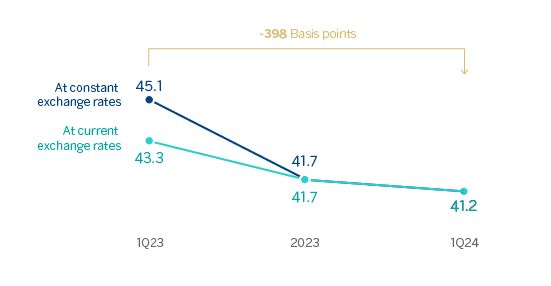
Thanks to the remarkable growth in gross income (+31.0%), the efficiency ratio stood at 41.2% as of March 31, 2024, with an improvement of 398 basis points compared to the ratio recorded 12 months earlier.
OPERATING EXPENSES
(MILLIONS OF EUROS AT CONSTANT EXCHANGE RATES)
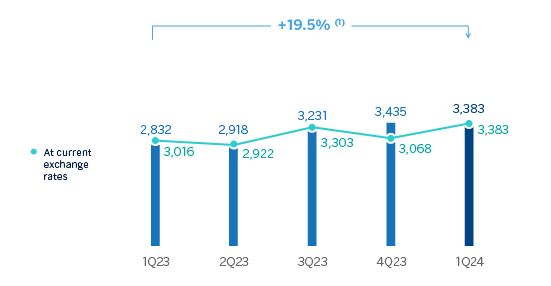
(1) At current exchange rates: +12.2%.
EFFICIENCY RATIO
(PERCENTAGE)
The impairment on financial assets not measured at fair value through profit or loss (impairment on financial assets) at the end of March 2024 was 40.7% higher than in the same period of the previous year, with higher requirements linked to the growth in the most profitable segments, in line with the Group´s strategy.
OPERATING INCOME
(MILLIONS OF EUROS AT CONSTANT EXCHANGE RATES)
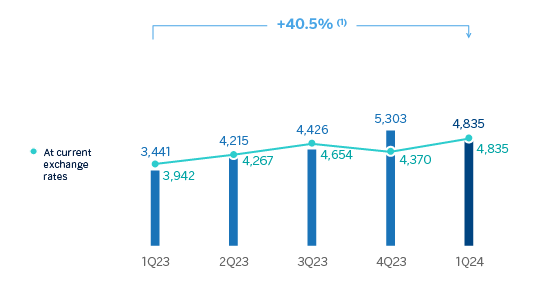
(1) At current exchange rates: +22.7%.
IMPAIRMENT ON FINANCIAL ASSETS
(MILLIONS OF EUROS AT CONSTANT EXCHANGE RATES)
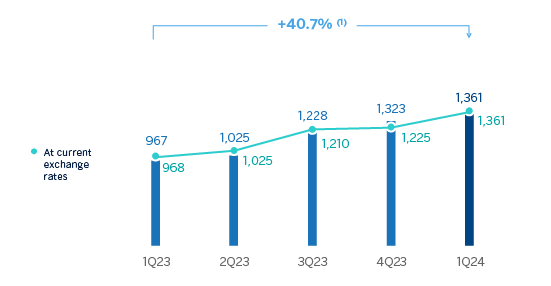
(1) At current exchange rates: +40.5%.
The provisions or reversal of provisions line (hereinafter, provisions) registered at the end of March 2024 higher provisions compared to the same period of the previous year, mainly originated in Spain and South America.
On the other hand, the other gains (losses) line ended March 2024 with a balance of €40m, which compares favorably with the result of the previous year and reflects the positive impact of the reversal of impairments for investments on associated companies.
As a result of the above, the BBVA Group generated a net attributable profit of €2,200m between January and March of the year 2024, which compares very positively with the result of the same period of the previous year. These solid results are supported by the favorable evolution of the banking business recurring income, which offsets the higher operating expenses and the increase in provisions for impairment losses on financial assets.
The cumulative net attributable profits, in millions of euros, at the end of March 2024 for the business areas that compose the Group were as follows: €725m in Spain, €1,441m in Mexico, €144m in Turkey, €119m in South America and €121m in Rest of Business.
NET ATTRIBUTABLE PROFIT (LOSS)
(MILLIONS OF EUROS AT CONSTANT EXCHANGE RATES)
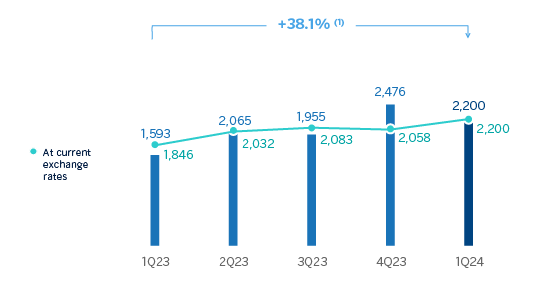
(1) At current exchange rates: +19.1%.
The Group's excellent performance has also allowed to accelerate value creation, as reflected in the growth of the tangible book value per share and dividends, which as of the end of March 2024 was 19.9% higher than in the same period of the previous year.
TANGIBLE BOOK VALUE PER SHARE AND DIVIDENDS
(EUROS)
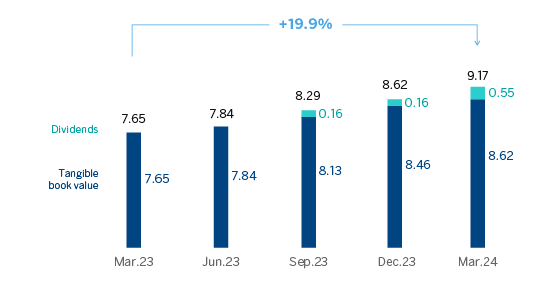
General note: replenishing dividends paid in the period. For more information, see Alternative Performance Measures at the end of this report.
EARNING (LOSS) PER SHARE
(EUROS)
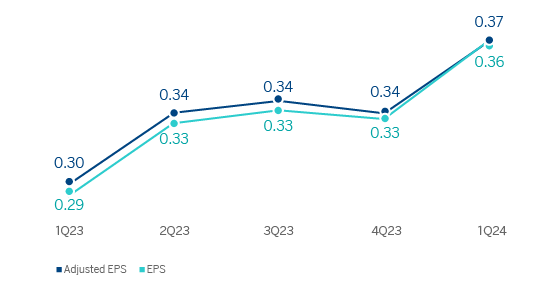
General note; adjusted by additional Tier 1 instrument remuneration. For more information, see Alternative Performance Measures at the end of this report.
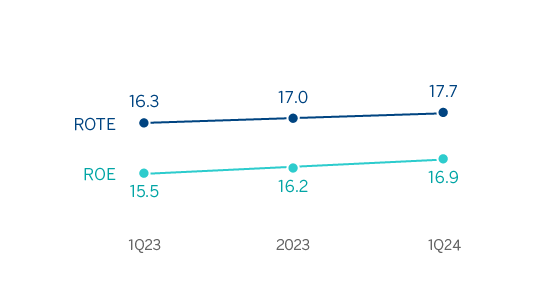
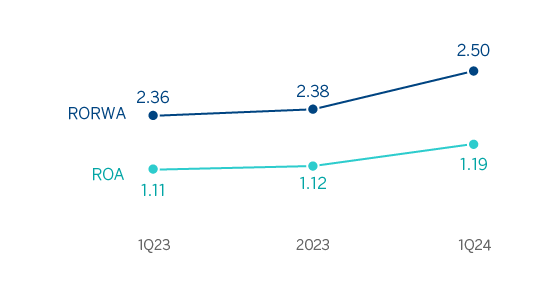
Lastly, the Group’s profitability indicators improved in year-on-year terms supported by the favorable performance of results.
ROE AND ROTE
(PERCENTAGE)
ROA AND RORWA
(PERCENTAGE)
3 In compliance with Law 38/2022, of December 27, which establishes the obligation to pay a patrimonial benefit of a public and non-taxable nature during the years 2023 and 2024 for credit institutions that operate in Spanish territory whose sum of total interest income and fee and commission income corresponding to the year 2019 is equal to or greater than €800m.