
Rest of Business
Highlights
- Favorable evolution of lending activity and significant growth in customers funds
- Dynamism in the net interest income and NTI in the quarter
- The cost of risk remains at low levels
- Good performance of the efficiency ratio
BUSINESS ACTIVITY (1)
(VARIATION AT CONSTANT EXCHANGE RATES COMPARED TO 31-12-23)
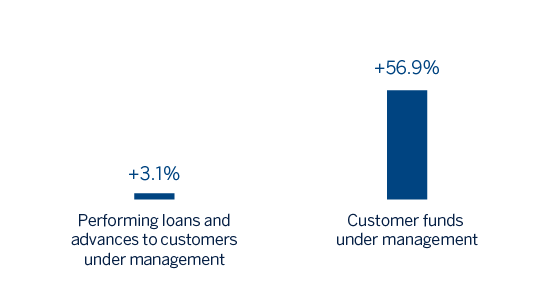
(1) Excluding repos.
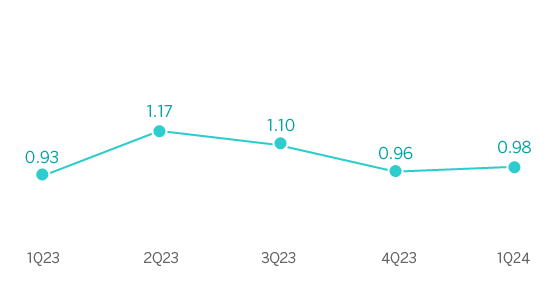
NET INTEREST INCOME / AVERAGE TOTAL ASSETS
(PERCENTAGE AT CONSTANT EXCHANGE RATES)
OPERATING INCOME
(MILLIONS OF EUROS AT CONSTANT EXCHANGE RATES)
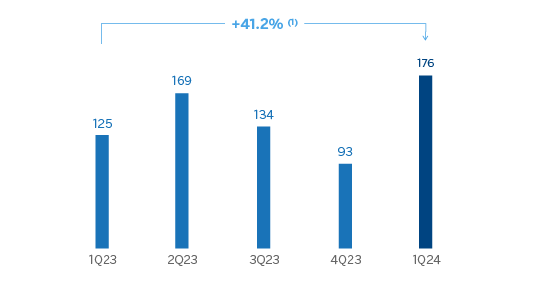
(1) At current exchange rates: +41.6%.
NET ATTRIBUTABLE PROFIT (LOSS)
(MILLIONS OF EUROS AT CONSTANT EXCHANGE RATES)
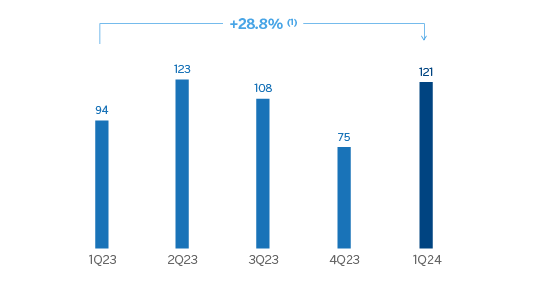
(1) At current exchange rates: +29.2%.
| FINANCIAL STATEMENTS AND RELEVANT BUSINESS INDICATORS (MILLIONS OF EUROS AND PERCENTAGE) | ||||
|---|---|---|---|---|
| Income statement | 1Q24 | ∆ % | ∆ % (2) | 1Q23 (1) |
| Net interest income | 157 | 38.6 | 38.2 | 113 |
| Net fees and commissions | 67 | (2.4) | (3.0) | 69 |
| Net trading income | 111 | 44.6 | 44.5 | 77 |
| Other operating income and expenses | 1 | (23.1) | (28.2) | 1 |
| Gross income | 336 | 29.3 | 28.9 | 260 |
| Operating expenses | (160) | 18.0 | 17.6 | (135) |
| Personnel expenses | (82) | 18.3 | 17.8 | (70) |
| Other administrative expenses | (70) | 17.1 | 16.8 | (60) |
| Depreciation | (7) | 24.9 | 24.2 | (6) |
| Operating income | 176 | 41.6 | 41.2 | 124 |
| Impairment on financial assets not measured at fair value through profit or loss | (16) | (13.0) | (12.9) | (18) |
| Provisions or reversal of provisions and other results | - | (99.4) | (99.4) | 7 |
| Profit (loss) before tax | 160 | 41.3 | 40.9 | 113 |
| Income tax | (40) | 97.8 | 97.1 | (20) |
| Profit (loss) for the period | 121 | 29.2 | 28.8 | 93 |
| Non-controlling interests | - | - | - | - |
| Net attributable profit (loss) | 121 | 29.2 | 28.8 | 93 |
Balance sheets | 31-03-24 | ∆ % | ∆ % (2) | 31-12-23 |
| Cash, cash balances at central banks and other demand deposits | 6,172 | 30.0 | 27.4 | 4,748 |
| Financial assets designated at fair value | 10,528 | (32.0) | (33.4) | 15,475 |
| Of which: Loans and advances | 9,817 | (33.6) | (35.0) | 14,783 |
| Financial assets at amortized cost | 44,809 | 3.3 | 2.7 | 43,363 |
| Of which: Loans and advances to customers | 40,858 | 3.9 | 3.2 | 39,322 |
| Inter-area positions | - | - | - | - |
| Tangible assets | 156 | 3.2 | 2.2 | 151 |
| Other assets | 894 | 66.6 | 64.5 | 537 |
| Total assets/liabilities and equity | 62,559 | (2.7) | (3.7) | 64,274 |
| Financial liabilities held for trading and designated at fair value through profit or loss | 9,693 | (34.6) | (36.0) | 14,831 |
| Deposits from central banks and credit institutions | 2,294 | (25.6) | (26.1) | 3,085 |
| Deposits from customers | 20,865 | 59.8 | 59.3 | 13,056 |
| Debt certificates | 1,498 | 6.0 | 5.2 | 1,413 |
| Inter-area positions | 22,176 | (16.2) | (17.0) | 26,466 |
| Other liabilities | 1,700 | 38.0 | 37.3 | 1,232 |
| Regulatory capital allocated | 4,332 | 3.4 | 2.6 | 4,191 |
Relevant business indicators | 31-03-24 | ∆ % | ∆ % (1) | 31-12-23 |
| Performing loans and advances to customers under management (3) | 40,680 | 3.8 | 3.1 | 39,202 |
| Non-performing loans | 433 | 17.7 | 17.7 | 368 |
| Customer deposits under management (3) | 20,865 | 59.8 | 59.3 | 13,056 |
| Off-balance sheet funds (4) | 581 | 2.7 | 2.7 | 566 |
| Risk-weighted assets | 37,536 | 3.1 | 2.4 | 36,410 |
| Efficiency ratio (%) | 47.6 | 53.1 | ||
| NPL ratio (%) | 0.7 | 0.7 | ||
| NPL coverage ratio (%) | 60 | 69 | ||
| Cost of risk (%) | 0.16 | 0.08 | ||
(1) Restated balances. For more information, please refer to the “Business Areas” section.
(2) At constant exchange rate.
(3) Excluding repos.
(4) Includes pension funds.
Unless expressly stated otherwise, all the comments below on rates of change, for both activity and results, will be given at constant exchange rates. These rates, together with the changes at current exchange rates, can be found in the attached tables of the financial statements and relevant business indicators. Comments that refer to Europe exclude Spain.
Activity
The most relevant aspects of the evolution of BBVA Group's Rest of Business activity during the first quarter of 2024 were:
- Lending activity (performing loans under management) grew at a rate of 3.1%, mainly due to the evolution of corporate loans (+2.0%) and to the public sector (+95.3%). In respect of the geographical areas that compose this area, New York and Europe stood out for their good performance once again.
- Compared to the end of 2023, the NPL ratio remained at 0.7%, and the coverage ratio fell by 60% affected by a NPL inflow from a particular customer.
- Customer funds under management increased by 56.9% due to the performance of deposits in the European branches. On the other hand, off-balance-sheet customer funds registered a growth of 2.7%, originating in Europe as well.
Results
Rest of Business achieved an accumulated net attributable profit of €121m during the first quarter of 2024, 28.8% higher than in the same period of the previous year, favored by the performance of the net interest income and the NTI, which offset the increase in operating expenses.
In the year-on-year evolution of the main lines of the area's income statement at the end of March 2024, the following was particularly noteworthy:
- Net interest income increased by 38.2%. The performance of Europe and, to a lesser extent, of the New York branch, are particularly worthy of mention.
- Net fees and commissions decreased by 3.0%, due to lower commissions from the Group's businesses in Europe and despite the good performance of the commissions from the New York branch in the primary market.
- The NTI grew by 44.5% supported by the good results of the commercial activity in Europe, especially in Credit and the income generated by foreign currency operations, as well as, to a lesser extent, by the business of the Group in the United States, where the evolution of the Equity trading positions stands out.
- Increase in operating expenses of 17.6%, with growth mainly in Europe and in the New York branch.
- The impairment on financial assets line at the end of March 2024 registered a provision of €-16m, mainly originated in Europe.