
Mexico
Highlights
- Dynamism of credit activity in the retail segment
- Recurring revenue growth
- Stability of the efficiency ratio
- Quarterly net attributable profit continues at high levels
BUSINESS ACTIVITY (1)
(VARIATION AT CONSTANT EXCHANGE RATE COMPARED TO 31-12-23)
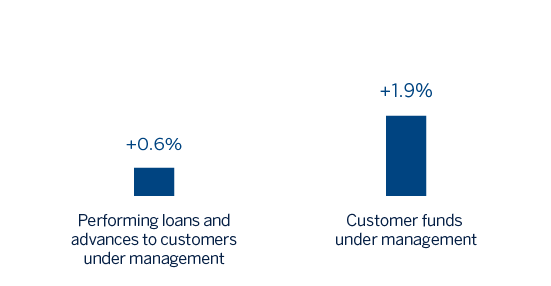
(1) Excluding repos.
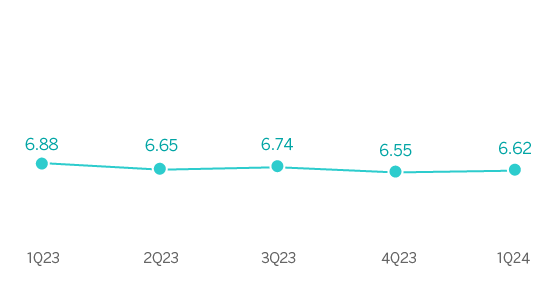
NET INTEREST INCOME / AVERAGE TOTAL ASSETS
(PERCENTAGE AT CONSTANT EXCHANGE RATE)
OPERATING INCOME
(MILLIONS OF EUROS AT CONSTANT EXCHANGE RATE)
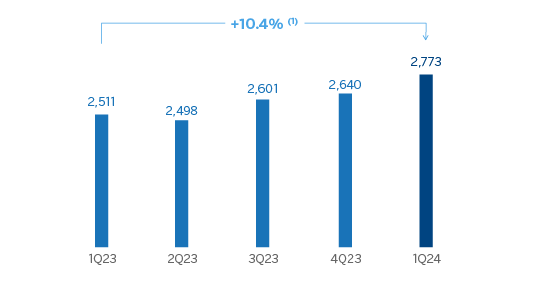
(1) At current exchange rate: +20.0%.
NET ATTRIBUTABLE PROFIT (LOSS)
(MILLIONS OF EUROS AT CONSTANT EXCHANGE RATE)
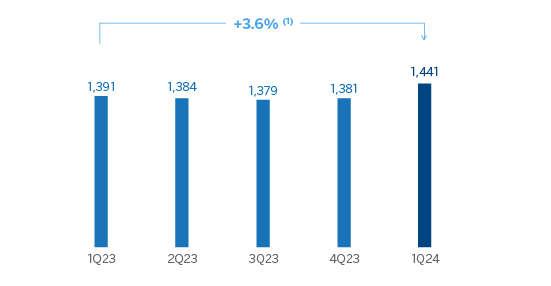
(1) At current exchange rate: +12.6%.
| FINANCIAL STATEMENTS AND RELEVANT BUSINESS INDICATORS (MILLIONS OF EUROS AND PERCENTAGE) | ||||
|---|---|---|---|---|
| Income statement | 1Q24 | ∆ % | ∆ % (2) | 1Q23 (1) |
| Net interest income | 2,999 | 15.8 | 6.5 | 2,589 |
| Net fees and commissions | 642 | 33.0 | 22.4 | 483 |
| Net trading income | 213 | 43.2 | 31.8 | 149 |
| Other operating income and expenses | 113 | 32.6 | 22.0 | 86 |
| Gross income | 3,967 | 20.0 | 10.4 | 3,306 |
| Operating expenses | (1,194) | 19.9 | 10.3 | (996) |
| Personnel expenses | (568) | 24.8 | 14.8 | (455) |
| Other administrative expenses | (498) | 15.3 | 6.1 | (432) |
| Depreciation | (127) | 17.4 | 8.0 | (109) |
| Operating income | 2,773 | 20.0 | 10.4 | 2,311 |
| Impairment on financial assets not measured at fair value through profit or loss | (752) | 36.9 | 26.0 | (549) |
| Provisions or reversal of provisions and other results | (12) | n.s. | n.s. | (1) |
| Profit (loss) before tax | 2,009 | 14.1 | 5.0 | 1,760 |
| Income tax | (568) | 18.1 | 8.7 | (481) |
| Profit (loss) for the period | 1,441 | 12.6 | 3.6 | 1,280 |
| Non-controlling interests | (0) | 10.7 | 1.8 | (0) |
| Net attributable profit (loss) | 1,441 | 12.6 | 3.6 | 1,279 |
Balance sheets | 31-03-24 | ∆ % | ∆ % (2) | 31-12-23 |
| Cash, cash balances at central banks and other demand deposits | 11,577 | 14.7 | 9.8 | 10,089 |
| Financial assets designated at fair value | 63,973 | 6.0 | 1.4 | 60,379 |
| Of which: Loans and advances | 3,080 | (40.5) | (43.1) | 5,180 |
| Financial assets at amortized cost | 101,063 | 4.9 | 0.4 | 96,342 |
| Of which: Loans and advances to customers | 92,776 | 5.3 | 0.8 | 88,112 |
| Tangible assets | 2,469 | 3.5 | (1.0) | 2,387 |
| Other assets | 5,594 | 30.3 | 24.7 | 4,293 |
| Total assets/liabilities and equity | 184,677 | 6.4 | 1.9 | 173,489 |
| Financial liabilities held for trading and designated at fair value through profit or loss | 35,252 | 23.7 | 18.4 | 28,492 |
| Deposits from central banks and credit institutions | 10,177 | 16.5 | 11.4 | 8,739 |
| Deposits from customers | 93,566 | 1.1 | (3.3) | 92,564 |
| Debt certificates | 10,758 | 10.7 | 5.9 | 9,719 |
| Other liabilities | 22,922 | 0.7 | (3.6) | 22,756 |
| Regulatory capital allocated | 12,002 | 7.0 | 2.4 | 11,218 |
Relevant business indicators | 31-03-24 | ∆ % | ∆ % (2) | 31-12-23 |
| Performing loans and advances to customers under management (3) | 93,275 | 5.2 | 0.6 | 88,688 |
| Non-performing loans | 2,673 | 8.1 | 3.5 | 2,472 |
| Customer deposits under management (3) | 92,321 | 1.5 | (2.8) | 90,926 |
| Off-balance sheet funds (4) | 61,154 | 14.8 | 9.9 | 53,254 |
| Risk-weighted assets | 97,517 | 6.2 | 1.6 | 91,865 |
| Efficiency ratio (%) | 30.1 | 30.9 | ||
| NPL ratio (%) | 2.7 | 2.6 | ||
| NPL coverage ratio (%) | 119 | 123 | ||
| Cost of risk (%) | 3.27 | 2.96 | ||
(1) Restated balances. For more information, please refer to the “Business Areas” section.
(2) At constant exchange rate.
(3) Excluding repos.
(4) Includes mutual funds, customer portfolios and other off-balance sheet funds.
Macro and industry trends
After expanding at a relatively high rate during the first three quarters of 2023, growth has moderated in the last months of the year. Nonetheless, GDP has increased 3.2% in 2023, mostly due to the dynamism of private consumption, the resilience of the manufacturing sector, the effects on private investment of the prospects for nearshoring of industrial production outside of China and the impact of higher public spending on the construction sector, in an environment of growth in the United States. According to BBVA Research, GDP could grow around 2.5% in 2024 (40 basis points below the previous forecasts). Annual inflation eased through 2023 and early 2024, reaching 4.4% in March, and it will probably continue to gradually moderate in the coming quarters, converging to around 3.9% in December 2024. Policy rates, which stood at 11.00% in April 2024 after a cut of 25 basis points in the previous month, are expected to continue decrease to around 9.25% by the end of the year.
With respect to the banking system, at the end of February 2024, the volume of outstanding credit to the non-financial private sector increased by 8,1% in year-on-year terms, with a greater boost from the consumer portfolio (+15.9%), followed by mortgages (+9.2%) and loans to business (+7.0%). Growth in total (demand and time) deposits remains at similar levels to those of total credit, with a year-on-year growth of 8.4% at the end of January 2024, with greater dynamism in time deposits (+13.7% year-on-year) than in demand deposits (+8.0% year-on-year). The industry's non-performing loans remained stable at around 2.11% and capital ratios are at comfortable levels.
Unless expressly stated otherwise, all the comments below on rates of change, for both activity and results, will be given at constant exchange rate. These rates, together with changes at current exchange rates, can be found in the attached tables of financial statements and relevant business indicators.
Activity
The most relevant aspects related to the area's activity in the first quarter of 2024 were:
- Lending activity (performing loans under management) grew by 0.6% between January and March 2024, with greater dynamism in the retail portfolio, which grew at a rate of 2.4%. This evolution is supported by the increase in consumer credits (+4.3%, driven by the product "Nómina y Personales BBVA"), mortgage loans (+2.1%) and SMEs (+3.4%). As a result, the weight of the retail portfolio, which is the most profitable for BBVA Mexico, stood at 53.4% at the end of March 2024.
- With regard to the asset quality indicators, the NPL ratio stood at 2.7% at the end of March 2024, which represents a growth of 7 basis points compared to the end of the 2023, affected by a lower dynamism of the wholesale portfolio. On the other hand, the NPL coverage ratio decreased to 119% at the end of March 2024, mainly explained by the evolution of the wholesale portfolio.
- Customer deposits under management increased by 1.9%, favored by the growth of off-balance sheet funds, which increased by 9.9% in the first three months of 2024.
Results
In Mexico, BBVA achieved a cumulative net attributable profit of €1,441m by the end of March 2024, representing an increase of 3.6% compared to the same period of the previous year, mainly as a result of the strength of the recurring income from the banking business.
The most relevant aspects of the year-on-year changes in the income statement as of the end of March 2024 are summarized below:
- Net interest income increased (+6.5%), as a result of growth in lending activity and a higher securities portfolio yield. For its part, the customer spread continues benefiting from a higher bias towards retail portfolios, despite the increase in the cost of funding.
- Net fees and commissions, boosted by greater transactions, continued to increase at double digit (+22.4%), with favorable evolution in almost all commissions types, highlighting credit cards, those derived from mutual funds management and from wholesale activity.
- The contribution from NTI increased (+31.8%) mainly as a result of the performance of Global Markets.
- The other operating income and expenses line grew by 22.0%, driven by the evolution of the insurance business.
- Operating expenses increased (+10.3%), mainly originated in higher personnel expenses linked to the workforce increase over 2023 and, to a lesser extent, in the increase of general expenses, particularly technology expenditure.
- Loan-loss provisions increased (+26.0%), mainly due to the higher provisioning needs of the retail portfolio, mainly in consumer and credit cards, partially affected by the growth of these segments. Consequently, the cumulative cost of risk at the end of March 2024 stood at 3.27%, which represents a growth of 31 basis points compared to the one registered at the end of December 2023.