
Additional pro forma information: Corporate & Investment Banking
Highlights
- Increase in lending activity supported by IB&F and GTB
- Favorable evolution of recurring income and NTI
- Efficiency improvement and increased in business profitability
- Year-on-year increase in net attributable profit
BUSINESS ACTIVITY (1)
(VARIATION AT CONSTANT EXCHANGE RATES COMPARED TO 31-12-23)
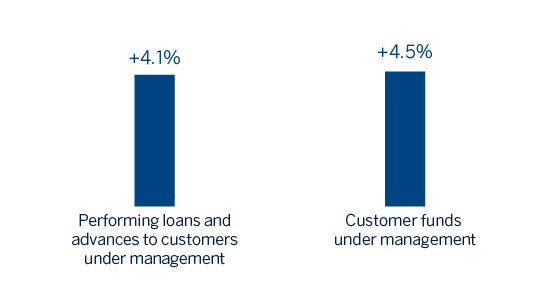
(1) Excluding repos.
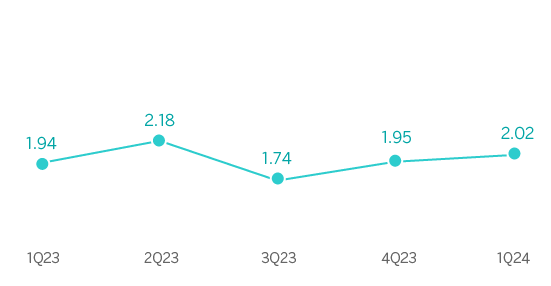
GROSS INCOME / AVERAGE TOTAL ASSETS
(PERCENTAGE AT CONSTANT EXCHANGE RATES)
OPERATING INCOME
(MILLIONS OF EUROS AT CONSTANT EXCHANGE RATES)
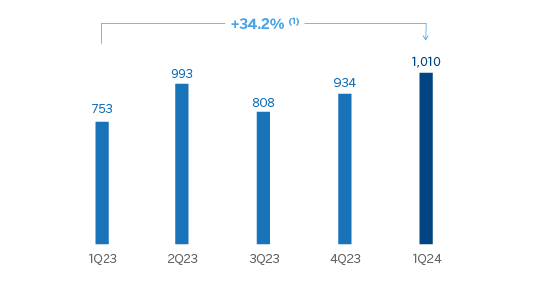
(1) At current exchange rates: +15.7%.
NET ATTRIBUTABLE PROFIT (LOSS)
(MILLIONS OF EUROS AT CONSTANT EXCHANGE RATES)
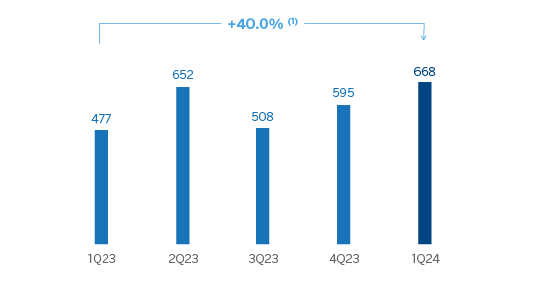
(1) At current exchange rates: +25.7%.
The pro forma information of CIB does not include the application of hyperinflation accounting nor the wholesale business of the Group in Venezuela.
| FINANCIAL STATEMENTS AND RELEVANT BUSINESS INDICATORS (MILLIONS OF EUROS AND PERCENTAGE) | ||||
|---|---|---|---|---|
| Income statement | 1Q24 | ∆ % | ∆ % (2) | 1Q23 (1) |
| Net interest income | 571 | 14.1 | 31.8 | 500 |
| Net fees and commissions | 308 | 11.7 | 19.4 | 276 |
| Net trading income | 512 | 19.2 | 34.7 | 430 |
| Other operating income and expenses | (23) | (18.0) | (9.5) | (28) |
| Gross income | 1,369 | 16.2 | 30.8 | 1,179 |
| Operating expenses | (359) | 17.4 | 22.1 | (306) |
| Personnel expenses | (169) | 18.4 | 21.3 | (143) |
| Other administrative expenses | (161) | 17.5 | 25.6 | (137) |
| Depreciation | (28) | 10.7 | 9.4 | (25) |
| Operating income | 1,010 | 15.7 | 34.2 | 873 |
| Impairment on financial assets not measured at fair value through profit or loss | 34 | n.s. | n.s. | (43) |
| Provisions or reversal of provisions and other results | (1) | n.s. | - | 15 |
| Profit (loss) before tax | 1,043 | 23.5 | 41.0 | 845 |
| Income tax | (309) | 24.0 | 42.3 | (249) |
| Profit (loss) for the period | 734 | 23.3 | 40.5 | 595 |
| Non-controlling interests | (66) | 3.2 | 44.7 | (64) |
| Net attributable profit (loss) | 668 | 25.7 | 40.0 | 531 |
Balance sheets | 31-03-24 | ∆ % | ∆ % (2) | 31-12-23 |
| Cash, cash balances at central banks and other demand deposits | 5,926 | 20.8 | 18.3 | 4,905 |
| Financial assets designated at fair value | 160,532 | 0.7 | 0.1 | 159,372 |
| Of which: Loans and advances | 80,058 | (4.8) | (5.2) | 84,126 |
| Financial assets at amortized cost | 99,643 | 2.4 | 1.5 | 97,302 |
| Of which: Loans and advances to customers | 81,550 | 4.1 | 3.2 | 78,354 |
| Inter-area positions | - | - | - | - |
| Tangible assets | 141 | (0.1) | (1.9) | 141 |
| Other assets | 13,008 | 22.2 | 18.1 | 10,646 |
| Total assets/liabilities and equity | 279,250 | 2.5 | 1.6 | 272,366 |
| Financial liabilities held for trading and designated at fair value through profit or loss | 119,616 | (8.0) | (8.4) | 130,081 |
| Deposits from central banks and credit institutions | 38,832 | 36.2 | 35.4 | 28,502 |
| Deposits from customers | 64,701 | 7.8 | 6.3 | 60,031 |
| Debt certificates | 6,279 | 3.3 | 2.9 | 6,076 |
| Inter-area positions | 32,395 | 7.4 | 7.4 | 30,172 |
| Other liabilities | 5,719 | (22.1) | (22.1) | 7,343 |
| Regulatory capital allocated | 11,709 | 5.3 | 5.3 | 11,115 |
Relevant business indicators | 31-03-24 | ∆ % | ∆ % (2) | 31-12-23 |
| Performing loans and advances to customers under management (3) | 81,328 | 4.9 | 4.1 | 77,510 |
| Non-performing loans | 930 | 2.8 | 7.2 | 905 |
| Customer deposits under management (3) | 57,948 | 6.4 | 5.1 | 54,483 |
| Off-balance sheet funds (4) | 4,188 | - | (2.9) | 4,189 |
| Efficiency ratio (%) | 26.2 | 26.5 | ||
General note: For the translation of the income statement in those countries where hyperinflation accounting is applied, the punctual exchange rate as of March 31, 2024 is used.
(1) Restated balances. For more information, please refer to the “Business Areas” section.
(2) At constant exchange rates.
(3) Excluding repos.
(4) Includes mutual funds, customer portfolios and other off-balance sheet funds.
Unless expressly stated otherwise, all the comments below on rates of change, for both activity and results, will be given at constant exchange rates. For the conversion of these figures in those countries in which accounting for hyperinflation is applied, the end of period exchange rate as of March 31, 2024 is used. These rates, together with changes at current exchange rates, can be found in the attached tables of financial statements and relevant business indicators.
Activity
The most relevant aspects related to the area's activity in the first quarter of 2024 were:
- Rebound in lending activity (performing loans under management), which was higher than at the end of December 2023 (+4.1%), highlighting the favorable evolution of Investment Banking & Finance, especially in the New York branch, with relevant Project Finance and Corporate Lending operations, and of Global Transaction Banking.
- Customer funds grew by 4.5% in the quarter, driven by the increase in volumes in an environment of narrowing margins, thanks to the contribution from Rest of Business and the New York branch.
Results
CIB generated a net attributable profit of €668m between January and March of 2024. These results represent an increase of 40.0% on a year-on-year basis and reflect the contribution of the diversification of products and geographical areas, as well as the progress of the Group's wholesale businesses in its strategy, leveraged on globality and sustainability, with the purpose of being relevant to its clients.12
All divisions have achieved good results, particularly highlighting the performance of Global Transaction Banking (GTB), especially in Mexico and Spain, the contribution of Global Markets supported by intense commercial activity and of Investment Banking & Finance (IB&F), with excellent activity in Project Finance in the Americas and Europe.
The most relevant aspects of the year-on-year evolution in the income statement of this aggregate are summarized below:
- Net interest income for the quarter was 31.8% higher than in the same period of the previous year, supported by the good evolution of the activity with growth in all geographical areas except for Mexico, Colombia and Peru. The positive evolution of GTB in Mexico, Spain and the United States stands out thanks to the preservation of volumes and customer spreads in loans and obtaining, furthermore, good factoring results.
- Net fees and commissions increased 19.4%, with positive evolution in all businesses. The primary market issuance activity, the liquidity management in South America and relevant operations in Project Finance and Corporate Lending are noteworthy.
- Excellent NTI evolution (+34.7%), mainly due to the performance of the Global Markets unit. Commercial activity showed significant growth in all areas, with Spain, México and Rest of Business standing out while the activity in emerging markets continues its positive evolution, even though a moderation of the year-on-year growth is observed.
- Operating expenses increased by 22.1% due to new personnel hires carried out during 2023. On the other hand, general expenses continue to be affected by inflation and higher technology expenses linked to the execution of strategic projects for the area. Despite this, the efficiency ratio stood at 26.2%, which represents an improvement compared to the figure registered twelve months before.
- Provisions for impairment on financial assets stood below the previous year, partly due to the releases in Mexico and Turkey.
12 CIB results do not include the application of hyperinflation accounting.