
Spain
Highlights for the period January - December 2025
- Increase in lending, with more dynamic growth of wholesale portfolio
- Sustained growth in recurring revenues throughout the year
- Good performance of the risk indicators
- Double-digit year-on-year growth in the area's net attributable profit
BUSINESS ACTIVITY (1)
(VARIATION COMPARED TO 31-12-24)
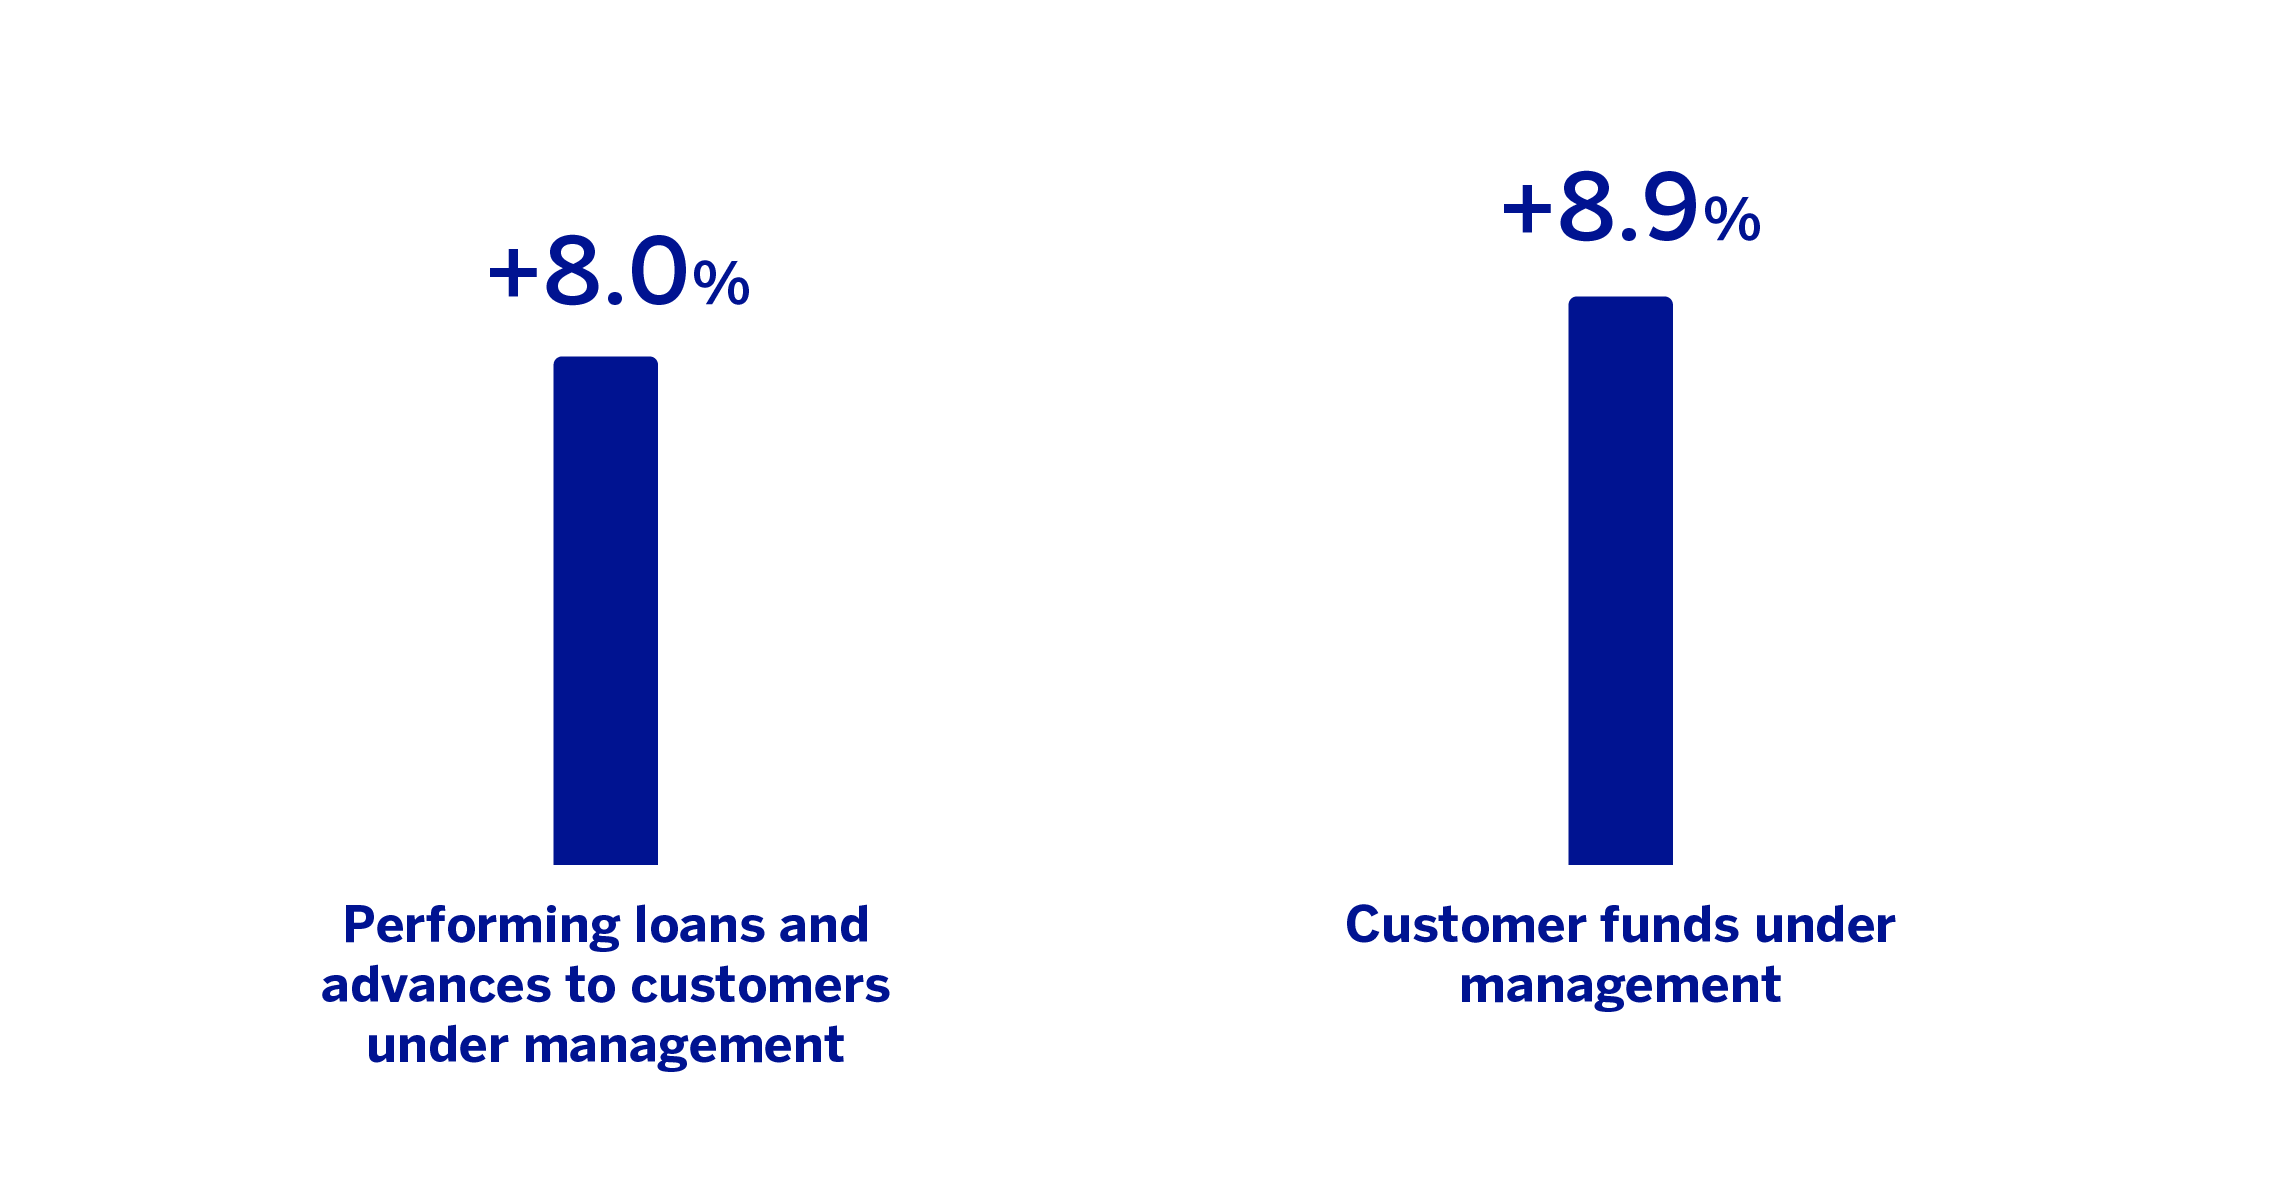
(1) Excluding repos.
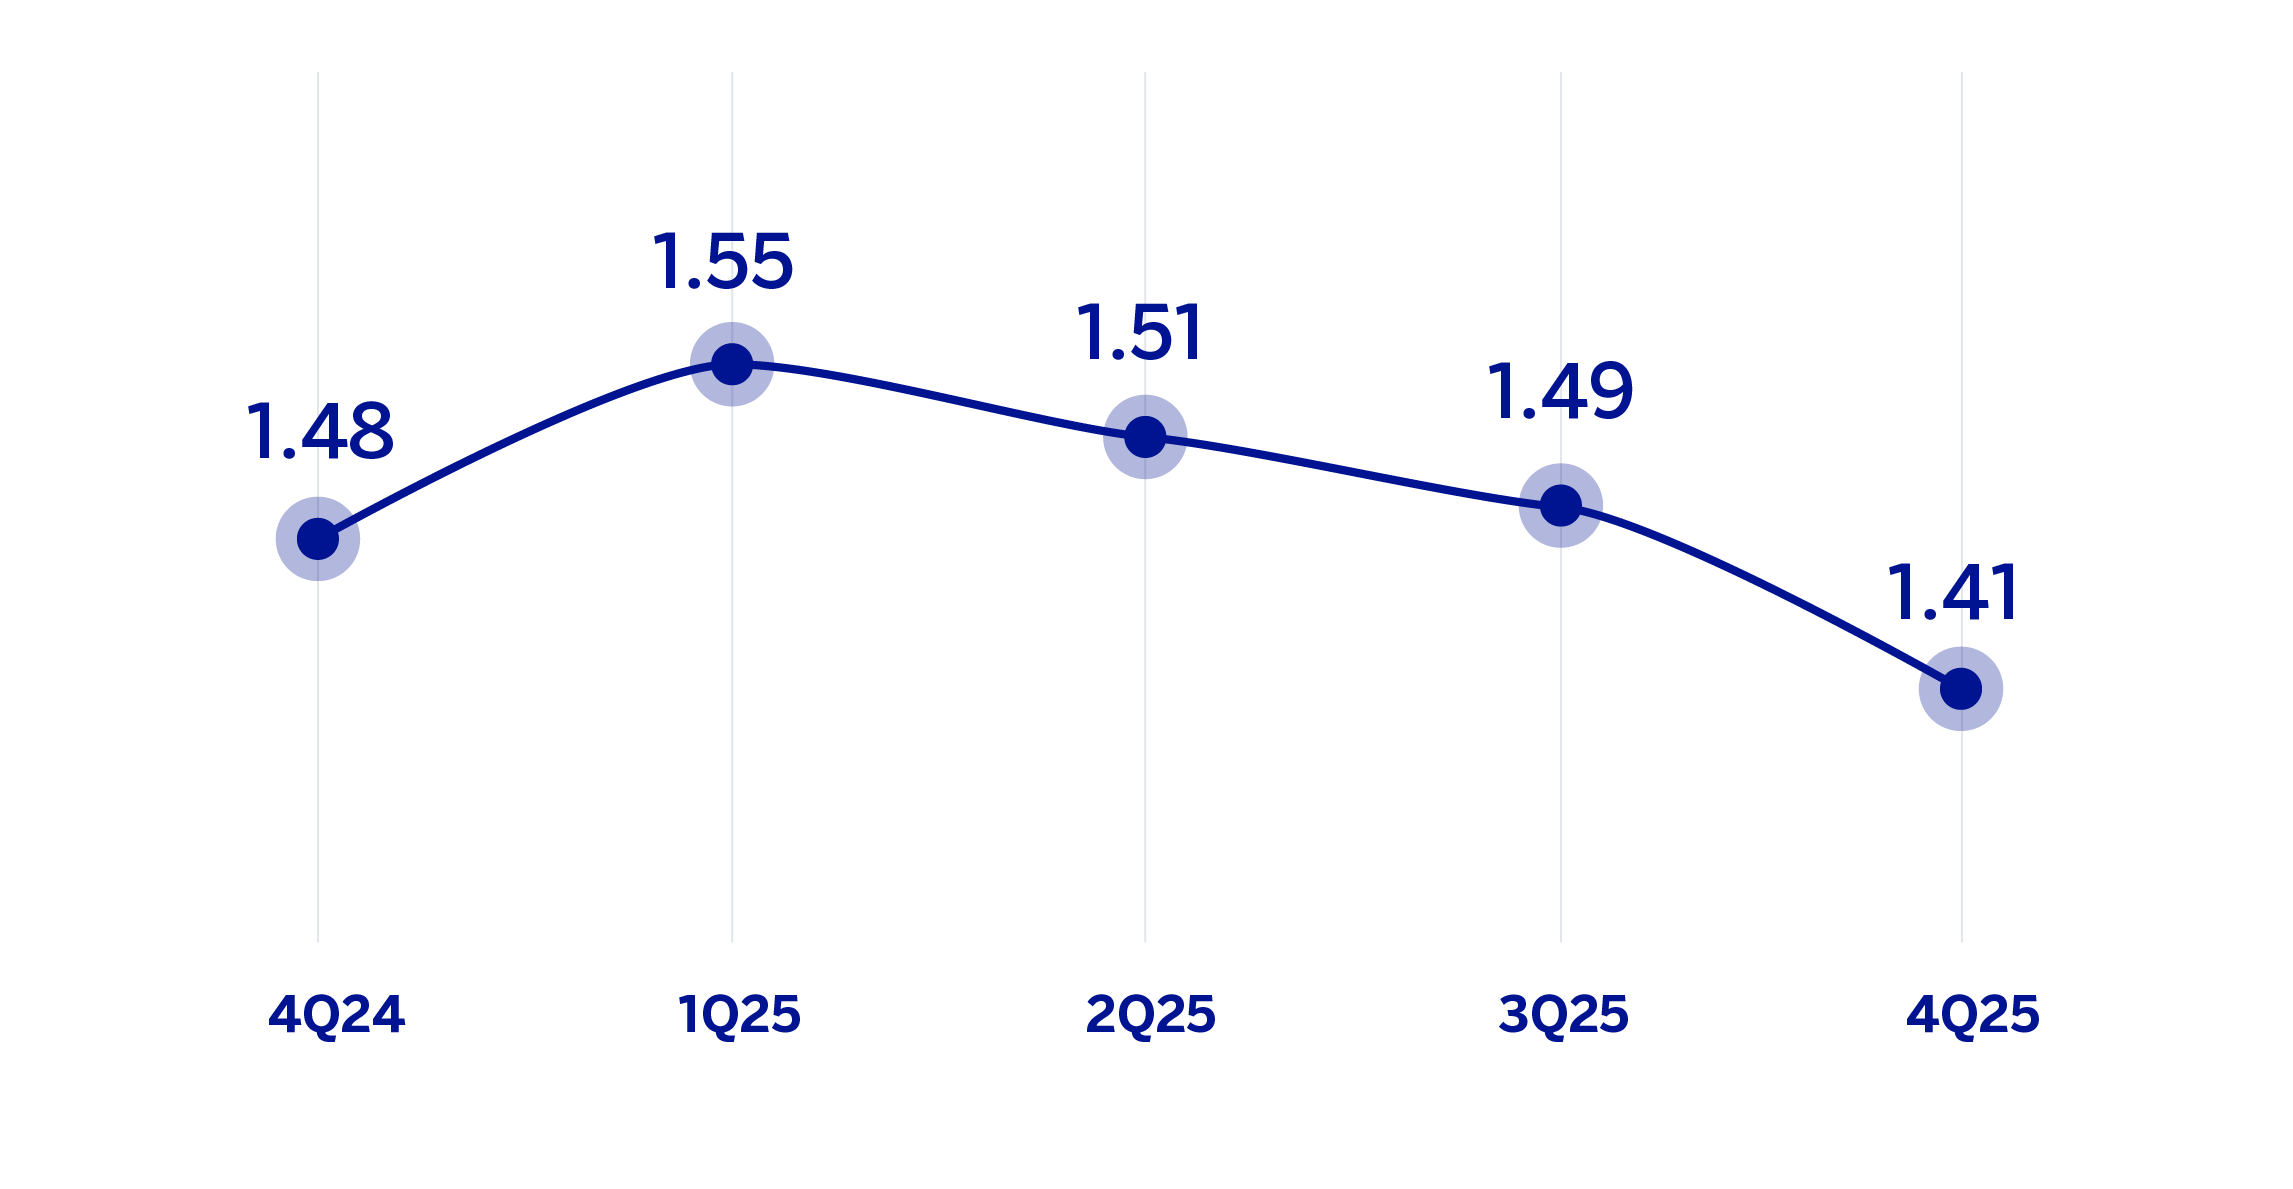
NET INTEREST INCOME / AVERAGE TOTAL ASSETS
(PERCENTAGE)
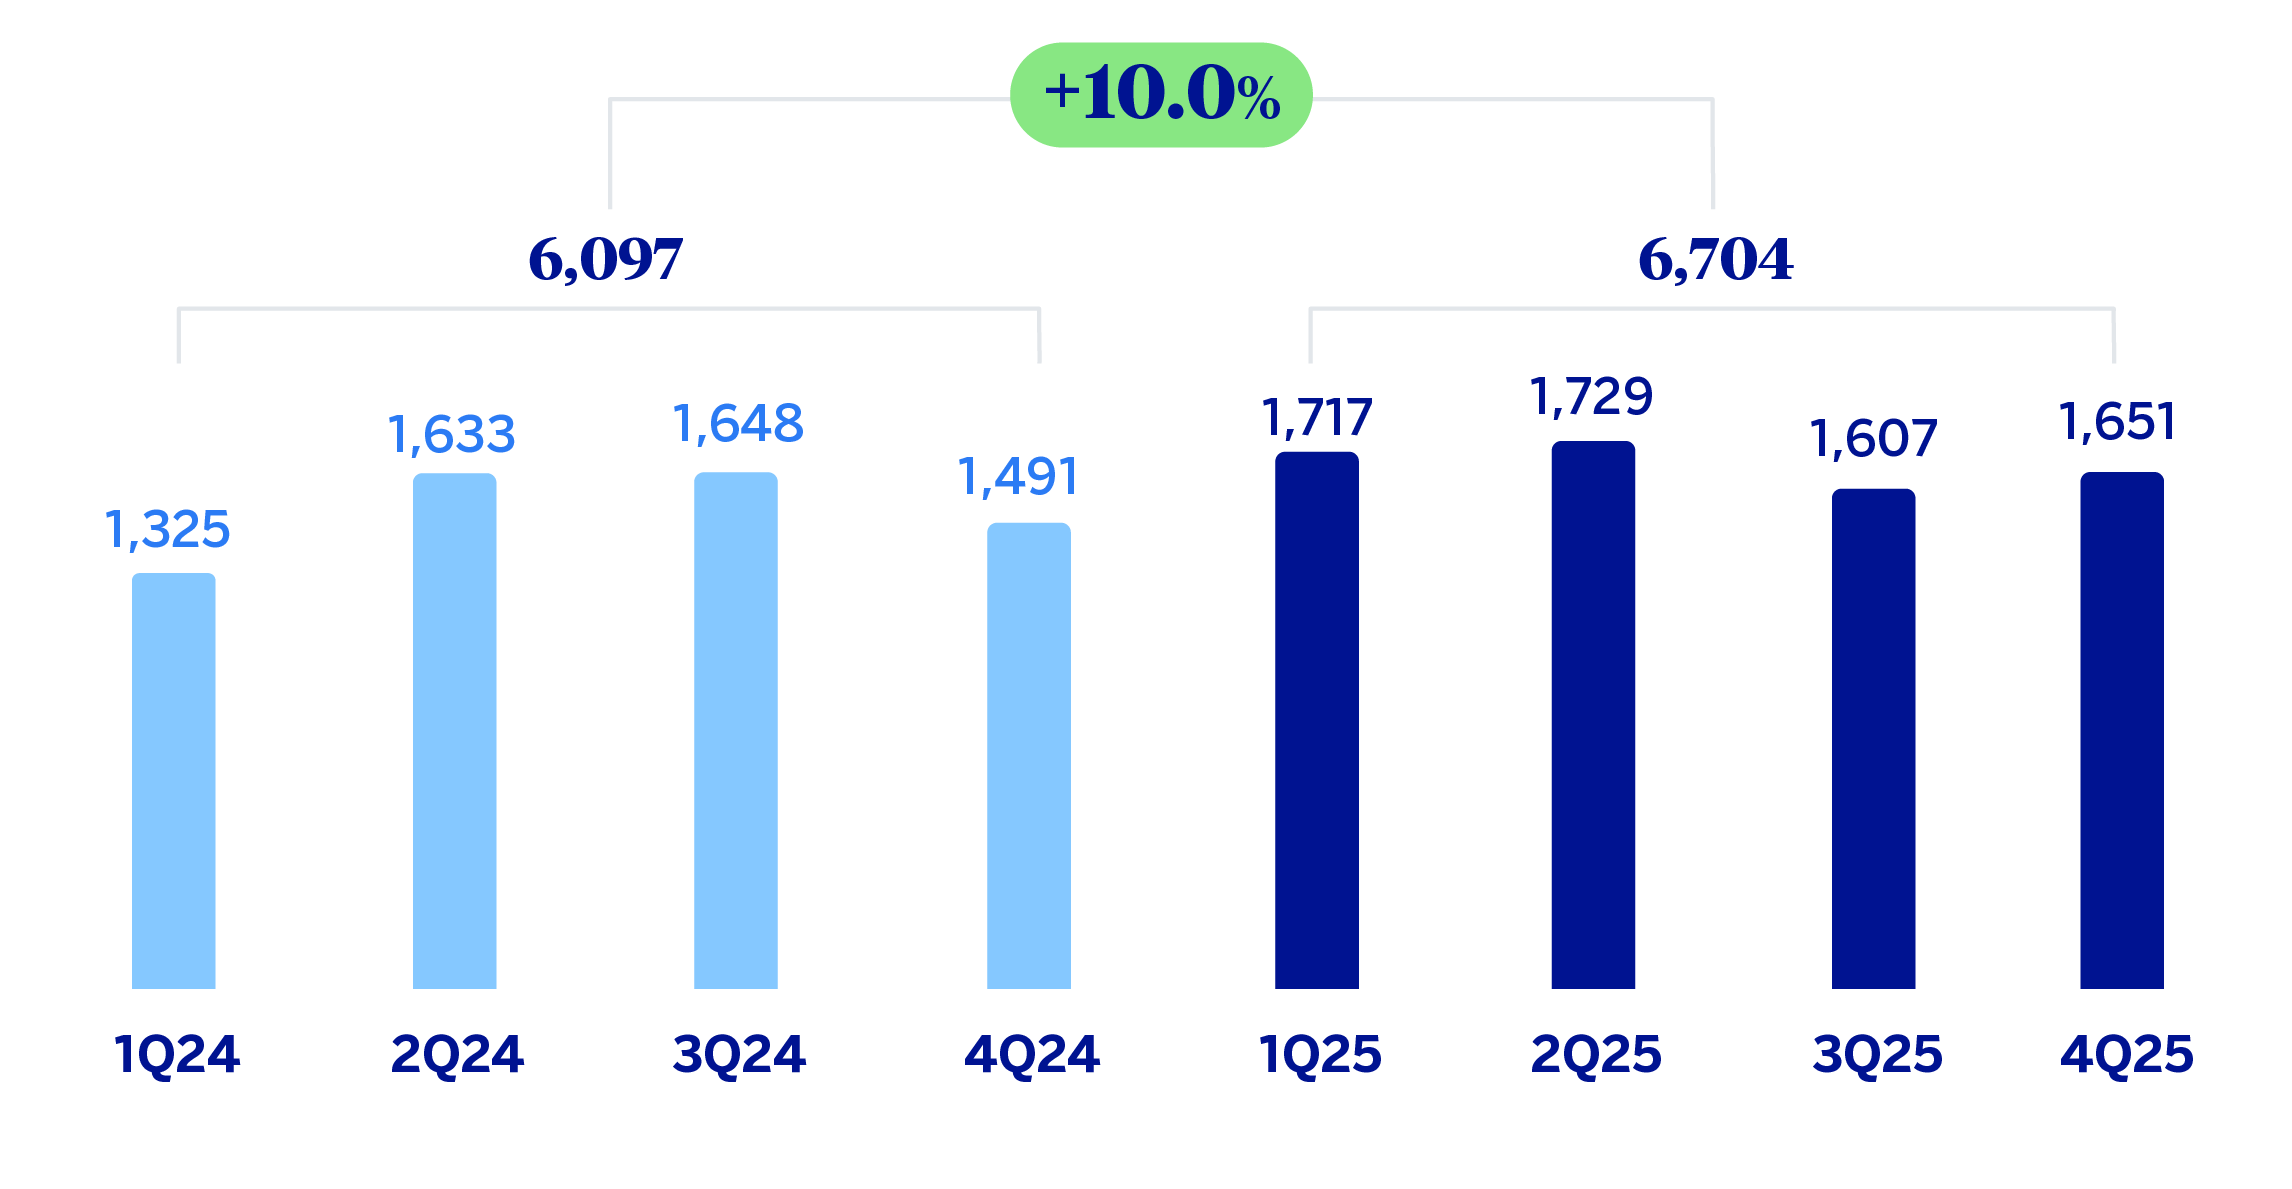
OPERATING INCOME (MILLIONS OF EUROS)
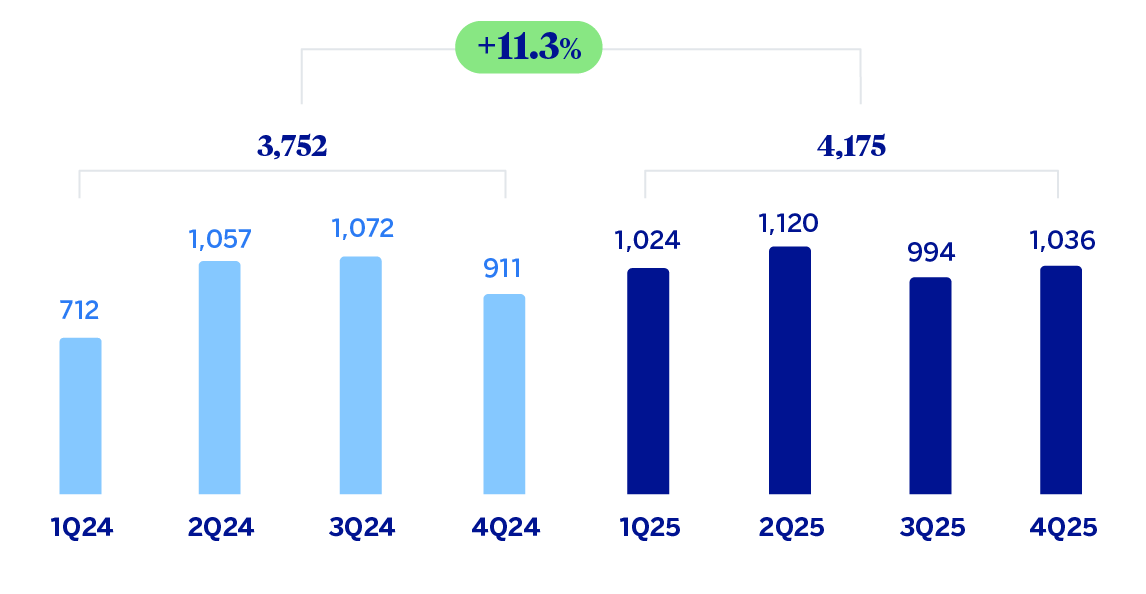
NET ATTRIBUTABLE PROFIT (LOSS) (MILLIONS OF EUROS)
| FINANCIAL STATEMENTS AND RELEVANT BUSINESS INDICATORS (MILLIONS OF EUROS AND PERCENTAGE) | |||
|---|---|---|---|
| Income statement | 2025 | 𝚫 % | 2024 (1) |
| Net interest income | 6,588 | 3.2 | 6,384 |
| Net fees and commissions | 2,364 | 3.7 | 2,281 |
| Net trading income | 723 | (0.7) | 728 |
| Other operating income and expenses | 351 | n.s. | 50 |
| Of which: Insurance activities | 387 | 2.1 | 379 |
| Gross income | 10,027 | 6.2 | 9,443 |
| Operating expenses | (3,323) | (0.7) | (3,346) |
| Personnel expenses | (1,856) | 3.2 | (1,798) |
| Other administrative expenses | (1,081) | (8.5) | (1,182) |
| Depreciation | (386) | 5.4 | (366) |
| Operating income | 6,704 | 10.0 | 6,097 |
| Impairment on financial assets not measured at fair value through profit or loss | (649) | (5.1) | (684) |
| Provisions or reversal of provisions and other results | (121) | (19.0) | (150) |
| Profit (loss) before tax | 5,933 | 12.7 | 5,263 |
| Income tax | (1,755) | 16.4 | (1,508) |
| Profit (loss) for the period | 4,178 | 11.3 | 3,755 |
| Non-controlling interests | (3) | 3.7 | (3) |
| Net attributable profit (loss) excluding non-recurring impacts | 4,175 | 11.3 | 3,752 |
| Balance sheets | 31-12-25 | 𝚫 % | 31-12-24 (1) |
| Cash, cash balances at central banks and other demand deposits | 19,928 | 56.5 | 12,734 |
| Financial assets designated at fair value | 119,919 | 9.4 | 109,569 |
| Of which: Loans and advances | 43,346 | 21.9 | 35,564 |
| Financial assets at amortized cost | 263,566 | 11.1 | 237,279 |
| Of which: Loans and advances to customers | 192,958 | 7.4 | 179,667 |
| Inter-area positions | 46,479 | 4.5 | 44,464 |
| Tangible assets | 2,718 | (2.3) | 2,781 |
| Other assets | 3,809 | (20.5) | 4,793 |
| Total assets/liabilities and equity | 456,419 | 10.9 | 411,620 |
| Financial liabilities held for trading and designated at fair value through profit or loss | 82,785 | 10.2 | 75,143 |
| Deposits from central banks and credit institutions | 34,582 | 23.2 | 28,067 |
| Deposits from customers | 251,430 | 11.1 | 226,391 |
| Debt certificates | 53,173 | 12.1 | 47,424 |
| Inter-area positions | — | — | — |
| Other liabilities | 19,275 | (0.9) | 19,448 |
| Allocated regulatory capital | 15,173 | 0.2 | 15,145 |
| Relevant business indicators | 31-12-25 | 𝚫 % | 31-12-24 |
| Performing loans and advances to customers under management (2) | 190,942 | 8.0 | 176,720 |
| Non-performing loans | 6,759 | (12.2) | 7,700 |
| Customer deposits under management (1)(2) | 238,447 | 8.4 | 219,923 |
| Off-balance sheet funds (1)(3) | 119,535 | 10.0 | 108,694 |
| Risk-weighted assets (1) | 119,608 | (0.9) | 120,661 |
| RORWA (4) | 3.45 | 3.13 | |
| Efficiency ratio (%) | 33.1 | 35.4 | |
| NPL ratio (%) | 3.0 | 3.7 | |
| NPL coverage ratio (%) | 67 | 59 | |
| Cost of risk (%) | 0.34 | 0.38 | |
| (1) Revised balances. For more information, please refer to the “Business Areas” section. (2) Excluding repos. (3) Includes mutual funds, customer portfolios and pension funds. (4) For more information on the calculation methodology, as well as the calculation of the metric at the consolidated Group level, see Alternative Performance Measures at this report. |
|||
Macro and industry trends
Economic growth remained solid during the third quarter of 2025 and the outlook going forward remains relatively positive. Activity is expected to continue to be supported by resilient services exports, a recovery in construction investment, and growth of private consumption, in the context of accommodative monetary conditions and rising wages. The acceleration of European Recovery Funds and the boost in defense spending could also help support demand and economic growth in the coming months. According to BBVA research, GDP growth is very likely to stand at 2.9% in 2025, one tenth lower than the previous forecast. By 2026, growth is expected to gradually moderate to rates of 2.4% due to factors such as global protectionism, reduced fiscal support, limited productivity gains and supply constraints in sectors such as housing. Meanwhile, headline inflation remained around 3% during the last quarter of 2025, closing the year at 2.9%. For 2026, a slight reduction in the overall rate is expected, reaching 2.6% by the end of the year.
As for the banking system, with data at the end of November 2025, the volume of credit to the private sector grew by 3.2% year-on-year, with higher growth in the portfolios of credit to households (+4.1%) than in credit to non-financial companies (+2.5%). System credit grew in 2024 for the first time since 2009 (with the exception of 2020 due to COVID support measures), a trend that is confirmed in 2025. Customer deposits grew by 4.9% year-on-year in November 2025, due to an 7.0% increase in demand deposits, which amply offset the reduction of 6.6% in time deposits. The NPL ratio stood at 2.84% in October 2025, 57 basis points lower than in October of last year. It should also be noted that the system maintains comfortable levels of solvency and liquidity.
Activity
The most relevant aspects related to the area's activity during 2025 were:
Lending balances were 8.0% higher than at the end of December 2024, mainly driven by the performance of the wholesale segments. Thus, lending to large-sized companies (which includes corporate banking and CIB portfolios) grew by 18.3%, lending to the public sector by 15.6%, and lending to medium-sized companies by 10.7%. Meanwhile, in the retail segment, mortgage and consumer loans (including credit cards) increased at rates of 2.5% and 9.0% respectively.
Total customer funds grew by 8.9%, with an increase in off-balance sheet funds (mutual and pension funds and customer portfolios) of 10.0%, driven by net contributions made throughout the year and a very positive market effect and an increase of 8.4% in customer deposits.
The most relevant aspects related to the area's activity during the fourth quarter of 2025 were:
Growth in lending activity compared to September (+2.5%), with corporate and CIB lending performing particularly well (+5.1%), followed by consumer loans (+3.4% including credit cards).
Regarding asset quality, the NPL ratio stood at 3.0%, with a decrease of 8 basis points compared to the end of September, driven by the evolution of activity and the stability of non-performing loans, contributing to an increase in the coverage ratio of 222 basis points in the quarter, to 67% at the end of December 2025.
Total customer funds grew in total by 3.5% in the fourth quarter of 2025, of which 3.8% refers to customer deposits and 3.0% to off-balance sheet funds, with positive net contributions and market effects in the last three months of 2025.
Results
Spain generated a net attributable profit of €4,175m in 2025, which is 11.3% above the result achieved in the same period of 2024, driven by the evolution of the recurring revenue from the banking business.
The most relevant aspects of the year-on-year evolution of the area's income statement at the end of December 2025 were:
Net interest income grew by 3.2%, supported by the higher contribution from the securities portfolio, increased lending activity and contained cost of liabilities, which offset the lower returns on loans associated with lower interest rates.
Net fees and commissions increased by 3.7% compared to the same period of the previous year, mainly boosted by the performance of asset management fees and, to a lesser extent, those associated with insurance products.
Net Trading Income (NTI) was in line with the previous year (-0.7%) influenced by the evolution of the Global Markets unit, which was partially offset in the last quarter of the year by the positive impact of capital gains of the insurance portfolio.
The year-on-year comparison of the aggregate other operating income and expenses is conditioned by the recording in 2024 of the annual amount of the temporary tax on credit institutions and financial credit institutions for a total of€285m.
Operating expenses remained stable (-0.7%) compared to the end of the previous year, mainly due to the reduction in general expenses, as they include a positive effect from the recognition of a lower Value Added Tax (VAT) expense following the upward re-estimation of its applied pro-rata, which was offset by the increase in personnel expenses. As a result of the evolution of the area's income and expenses, the gross income grew by 6.2% and, in addition, the efficiency ratio improved.
Impairment on financial assets decreased by 5.1%, mainly as a result of improved dynamics in the mortgage portfolio. On the other hand, the cumulative cost of risk at the end of December 2025 remained stable compared to September 2025, that is, 0.34%, with a reduction of 4 basis points in the year.
Finally, the income tax line includes the accrual, for 2025, of the tax on net interest income and net fees and commissions that have amounted to approximately €318m, of which €94m correspond to the fourth quarter of the year.
Spain generated a net attributable profit of €1,036m in the fourth quarter of 2025, representing an increase of 4.2% compared to the previous quarter. This evolution is largely explained by the performance of net fees and commissions, which include extraordinary income from asset management, and by NTI, which registered capital gains generated by the insurance portfolio. Lastly, operating expenses grew in the fourth quarter, including the update of variable employee compensation in line with the area's performance in 2025.
Read legal disclaimer of this report.