
Mexico
Highlights for the period January - December 2025
- Dynamism of retail lending
- Sustained growth in recurring revenues quarter after quarter
- Good performance of the insurance business
- Quarterly net attributable profit remains at high levels and above the previous quarter
BUSINESS ACTIVITY (1)
(VARIATION AT CONSTANT EXCHANGE RATE COMPARED TO 31-12-24)
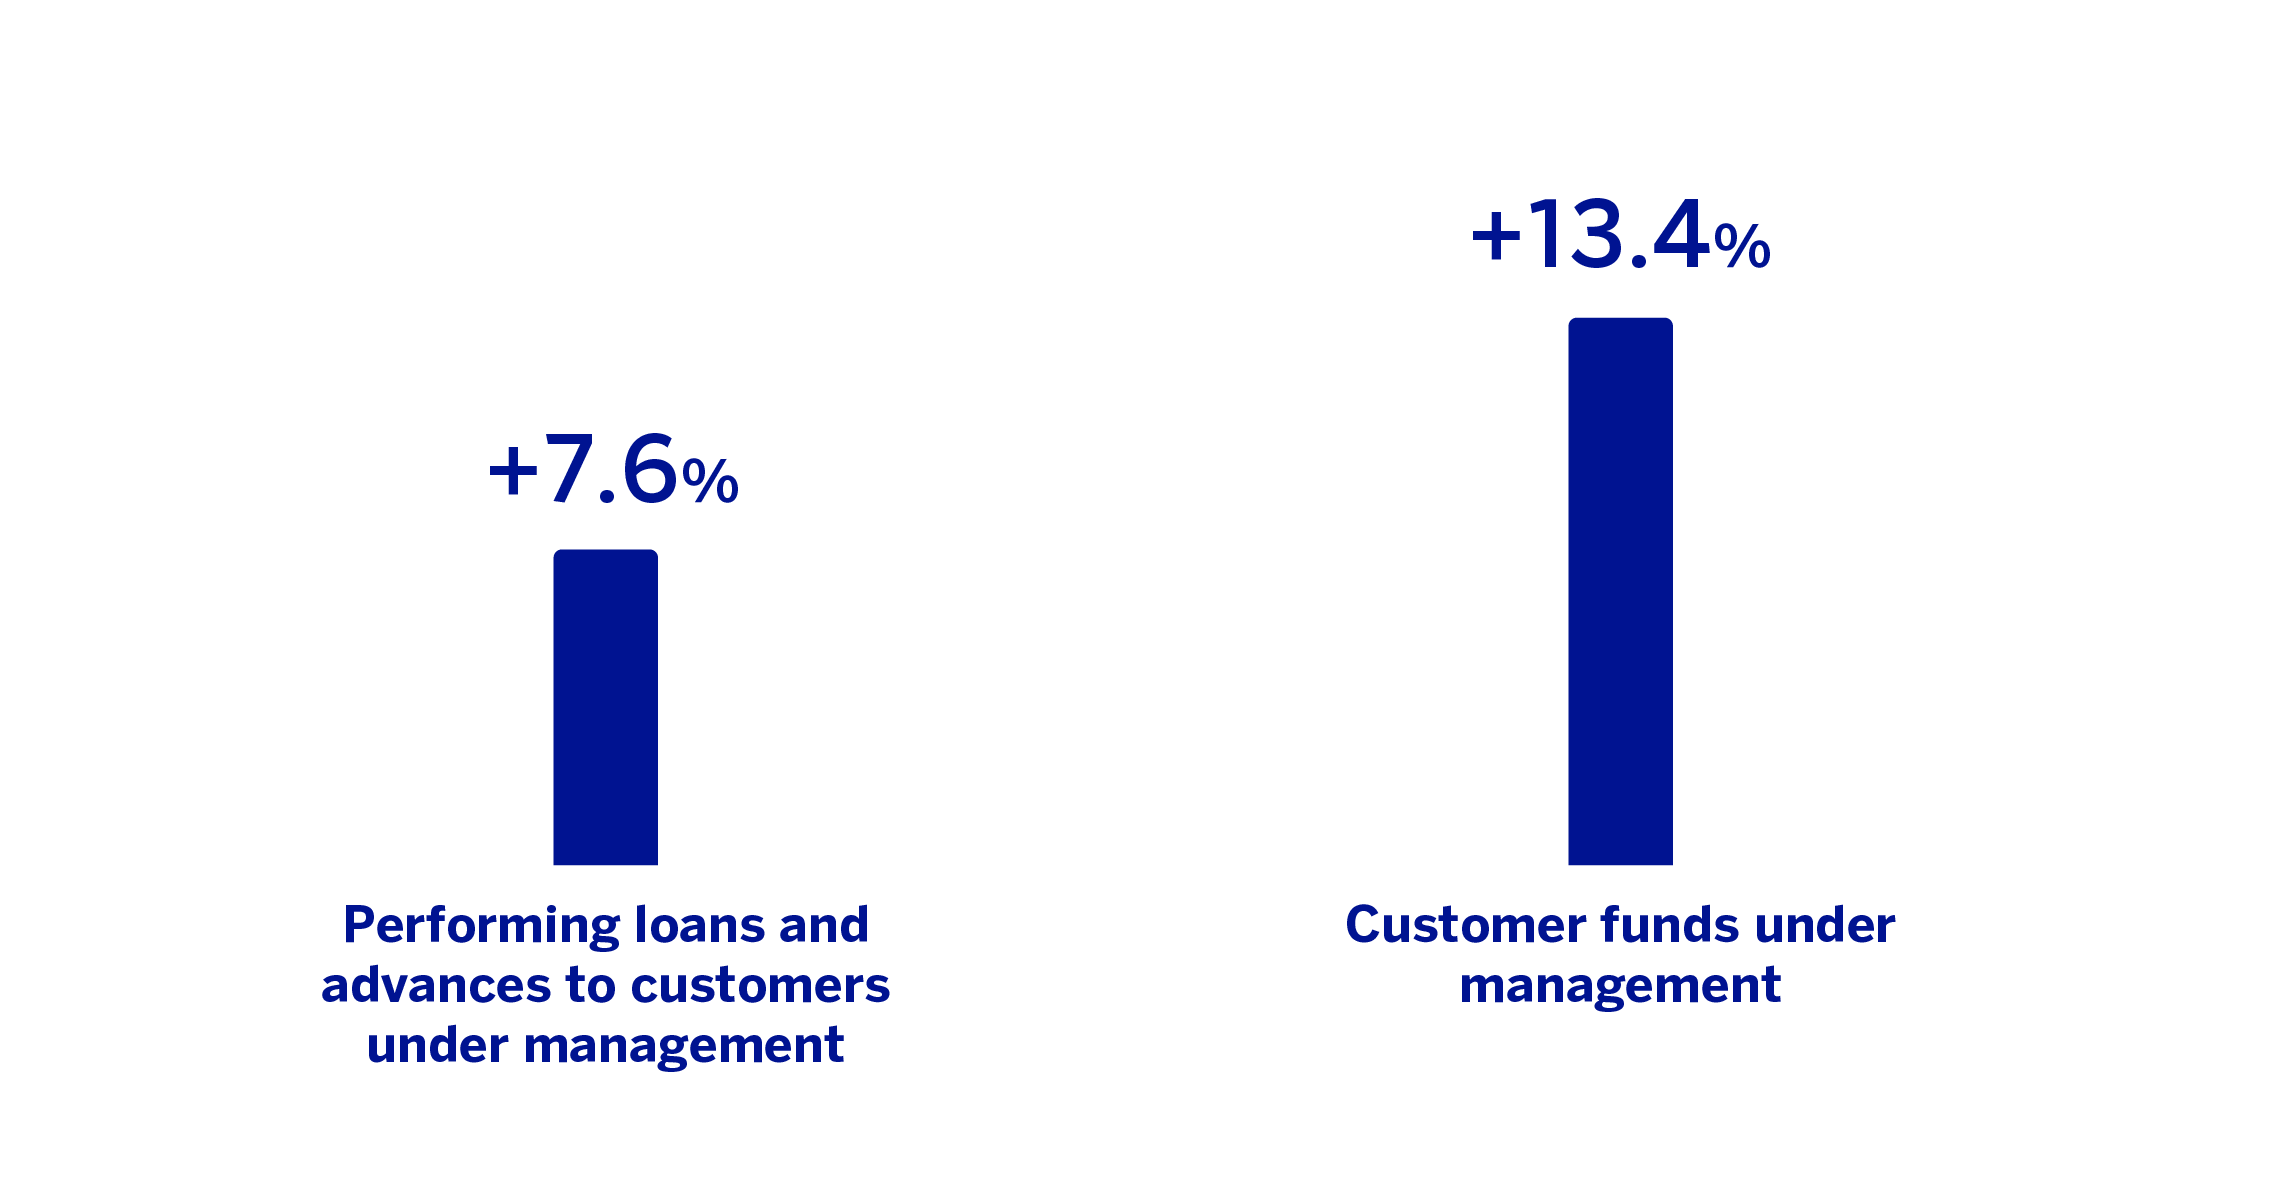
(1) Excluding repos.
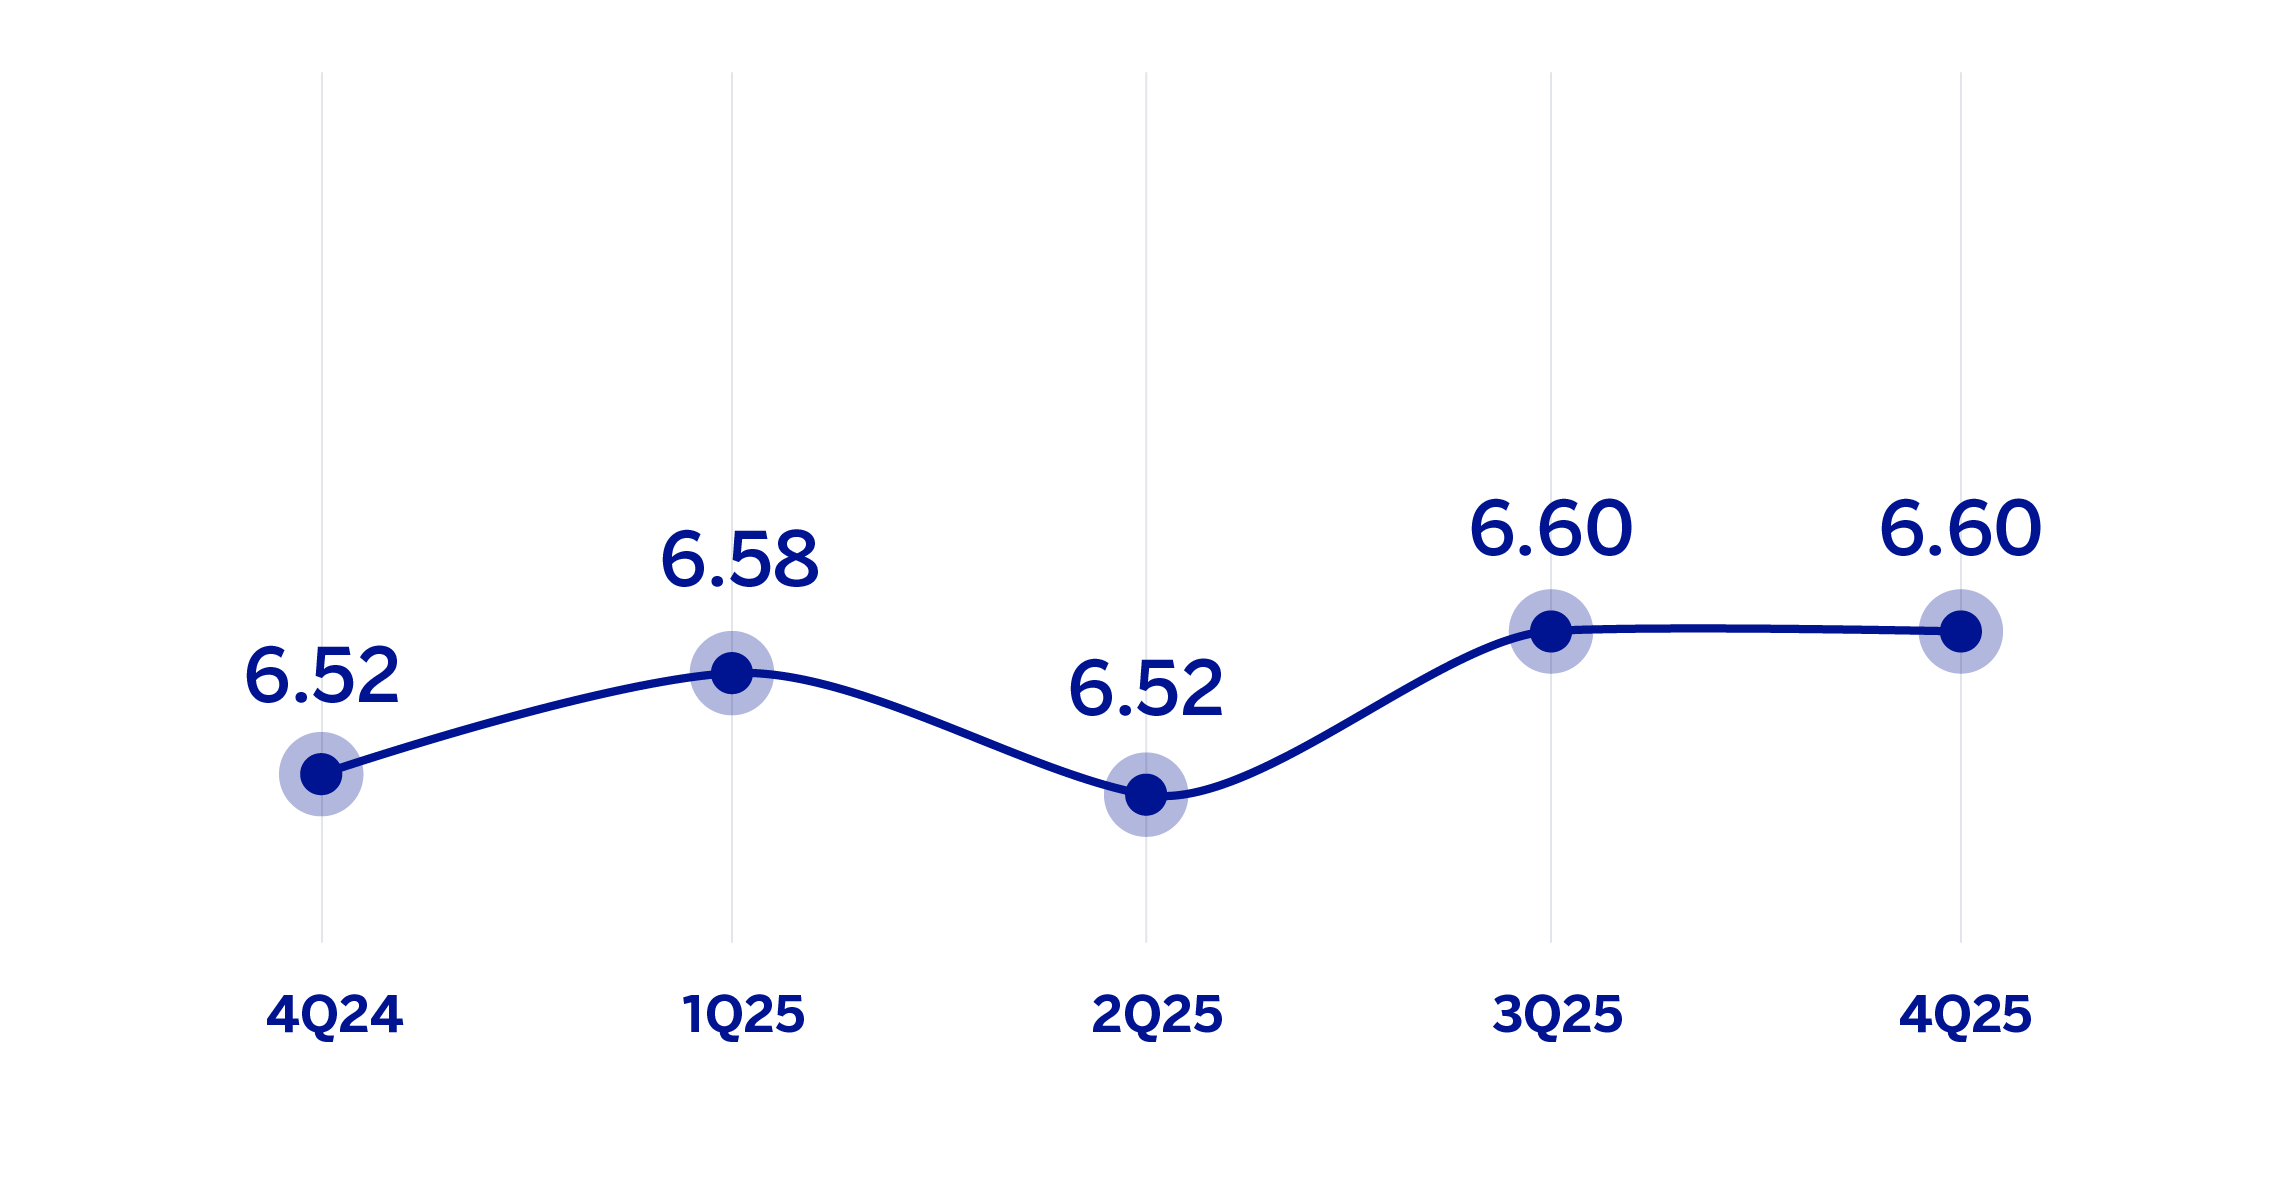
NET INTEREST INCOME / AVERAGE TOTAL ASSETS
(PERCENTAGE AT CONSTANT EXCHANGE RATE)
OPERATING INCOME
(MILLIONS OF EUROS AT CONSTANT EXCHANGE RATE)
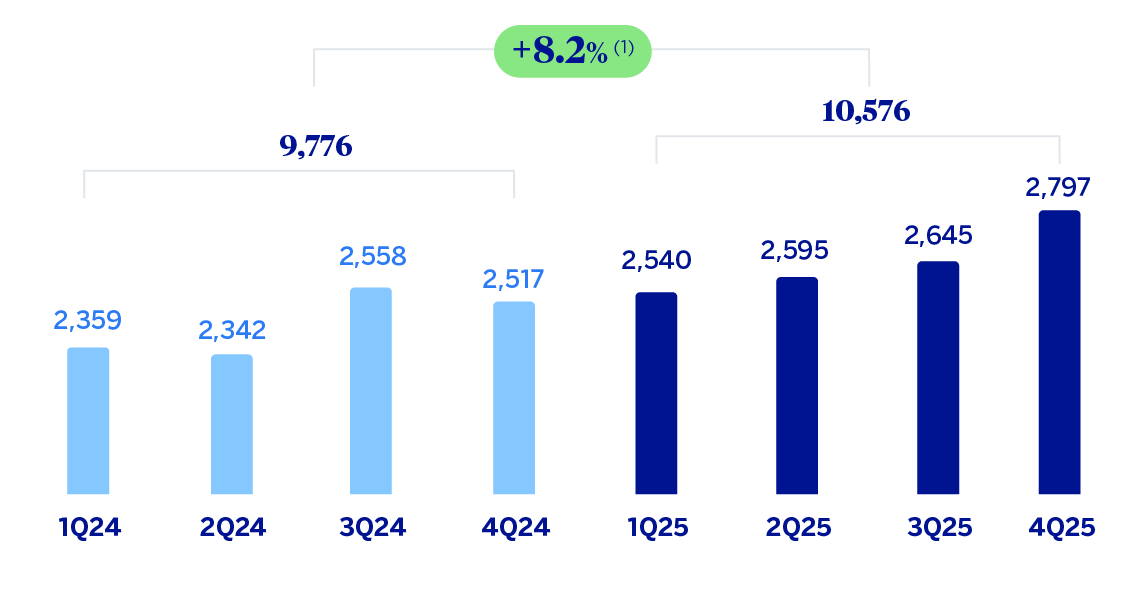
(1) At current exchange rate: -1.1%.
NET ATTRIBUTABLE PROFIT (LOSS)
(MILLIONS OF EUROS AT CONSTANT EXCHANGE RATE)
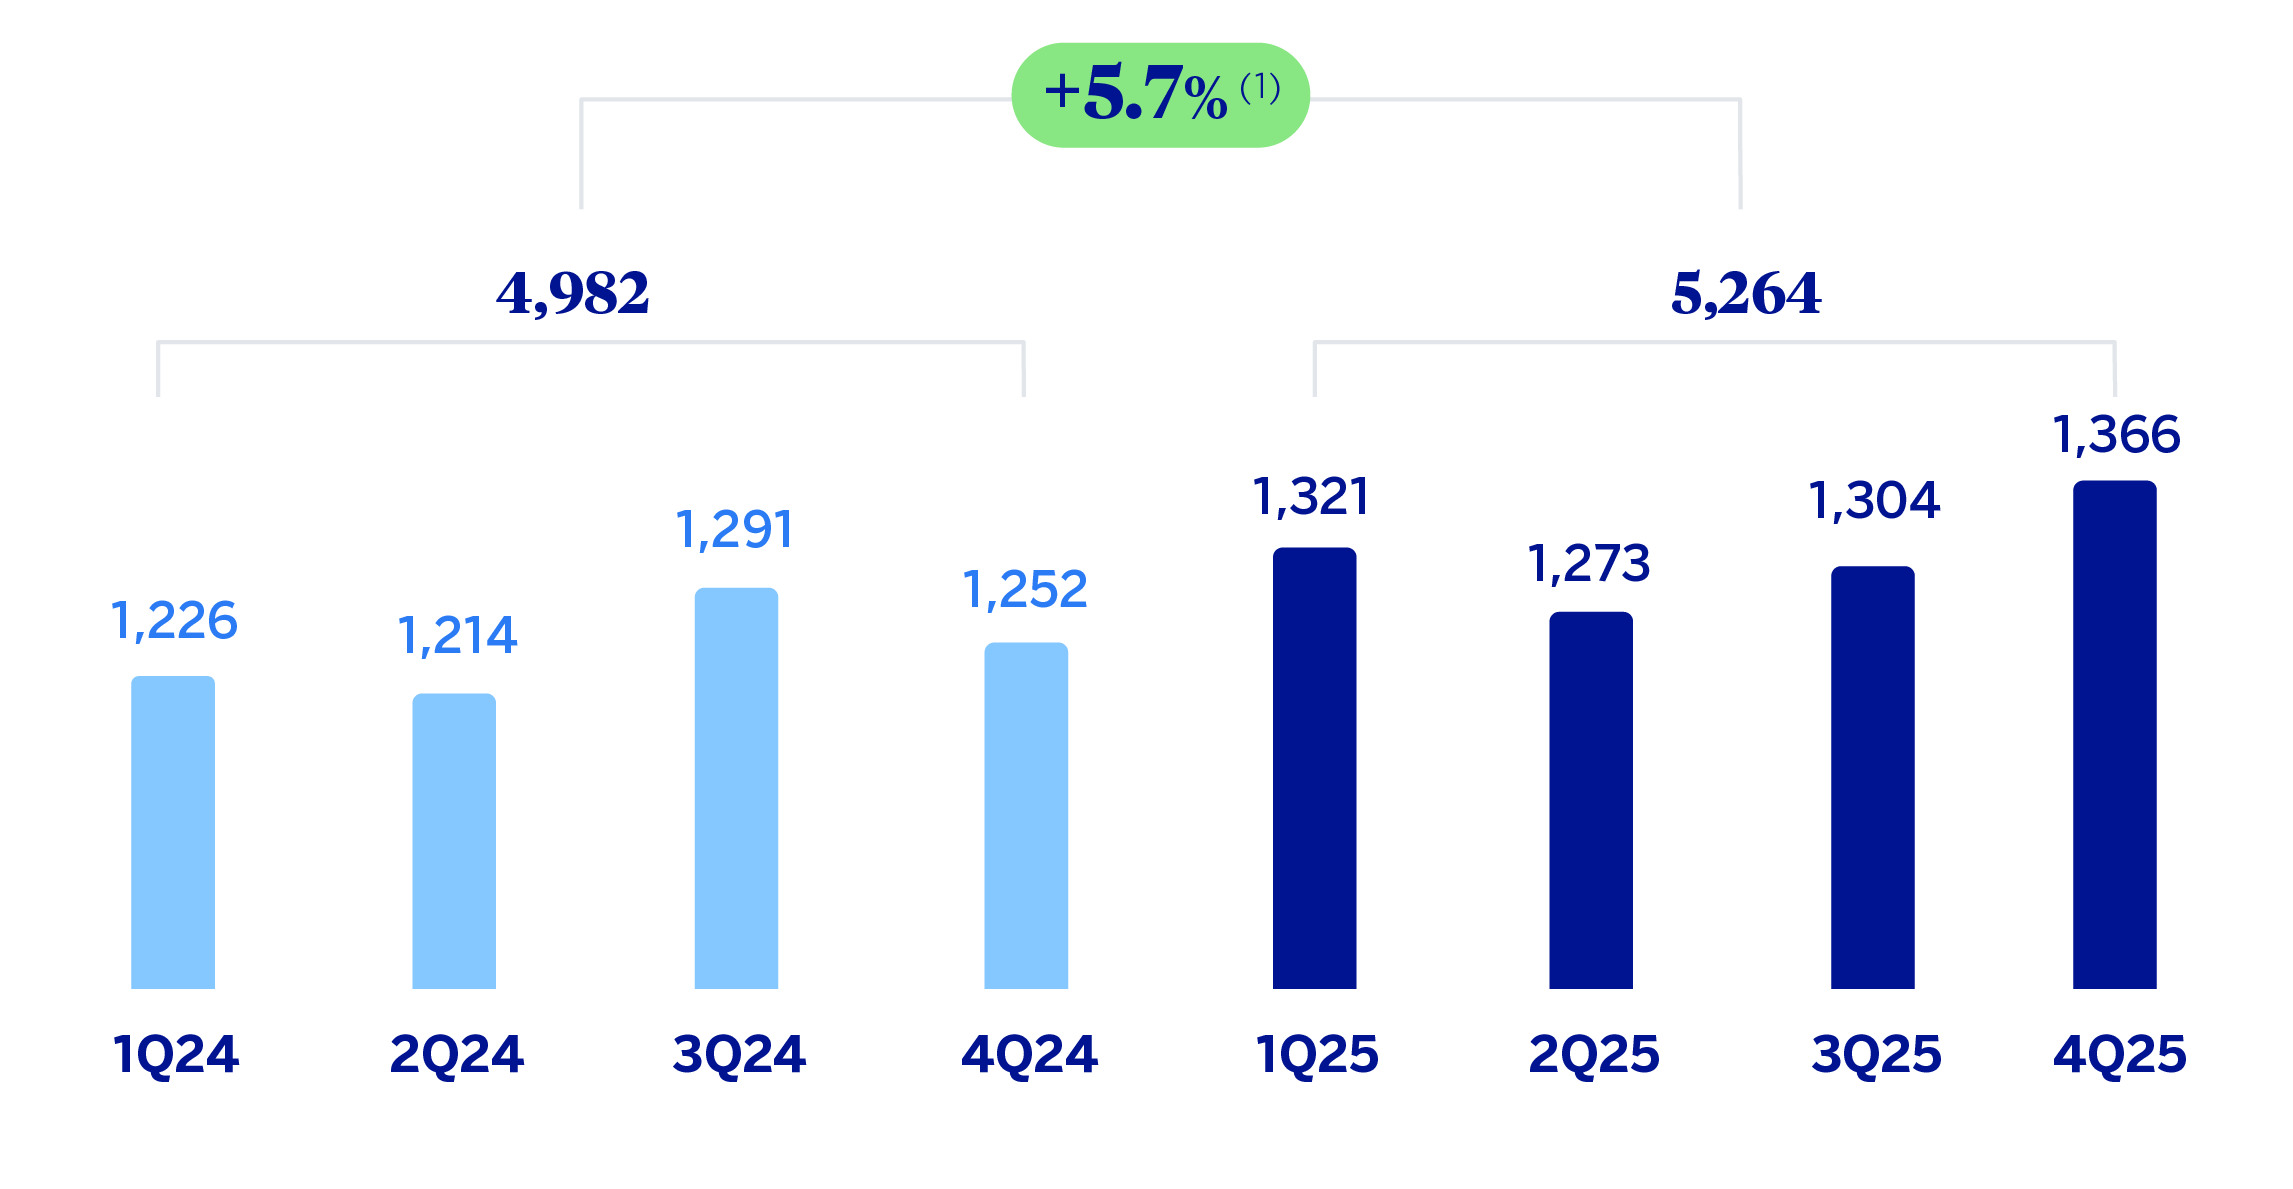
(1) At current exchange rate: -3.4%.
| FINANCIAL STATEMENTS AND RELEVANT BUSINESS INDICATORS (MILLIONS OF EUROS AND PERCENTAGE) | ||||
|---|---|---|---|---|
| Income statement | 2025 | 𝚫 % | 𝚫 % (1) | 2024 |
| Net interest income | 11,424 | (1.1) | 8.1 | 11,556 |
| Net fees and commissions | 2,367 | (3.1) | 6.0 | 2,443 |
| Net trading income | 788 | 2.7 | 12.3 | 767 |
| Other operating income and expenses | 619 | 8.5 | 18.7 | 571 |
| Gross income | 15,198 | (0.9) | 8.4 | 15,337 |
| Operating expenses | (4,622) | (0.5) | 8.7 | (4,648) |
| Personnel expenses | (2,176) | (3.9) | 5.1 | (2,264) |
| Other administrative expenses | (2,005) | 5.2 | 15.0 | (1,906) |
| Depreciation | (440) | (7.7) | 0.9 | (477) |
| Operating income | 10,576 | (1.1) | 8.2 | 10,689 |
| Impairment on financial assets not measured at fair value through profit or loss | (3,130) | 1.0 | 10.5 | (3,098) |
| Provisions or reversal of provisions and other results | (105) | 52.6 | 66.8 | (69) |
| Profit (loss) before tax | 7,341 | (2.4) | 6.7 | 7,522 |
| Income tax | (2,076) | 0.1 | 9.5 | (2,074) |
| Profit (loss) for the period | 5,265 | (3.4) | 5.7 | 5,448 |
| Non-controlling interests | (1) | (2.6) | 6.5 | (1) |
| Net attributable profit (loss) | 5,264 | (3.4) | 5.7 | 5,447 |
| Balance sheets | 31-12-25 | 𝚫 % | 𝚫 % (1) | 31-12-24 |
| Cash, cash balances at central banks and other demand deposits | 10,417 | (17.1) | (18.7) | 12,564 |
| Financial assets designated at fair value | 59,528 | 9.1 | 6.9 | 54,547 |
| Of which: Loans and advances | 5,915 | 183.3 | 177.6 | 2,088 |
| Financial assets at amortized cost | 105,972 | 12.0 | 9.8 | 94,595 |
| Of which: Loans and advances to customers | 97,259 | 9.6 | 7.4 | 88,725 |
| Tangible assets | 2,081 | 2.1 | 0.1 | 2,038 |
| Other assets | 4,525 | (4.2) | (6.2) | 4,726 |
| Total assets/liabilities and equity | 182,525 | 8.3 | 6.2 | 168,470 |
| Financial liabilities held for trading and designated at fair value through profit or loss | 32,406 | 4.9 | 2.8 | 30,885 |
| Deposits from central banks and credit institutions | 6,206 | (32.2) | (33.5) | 9,149 |
| Deposits from customers | 93,855 | 10.5 | 8.3 | 84,949 |
| Debt certificates | 11,257 | 5.0 | 2.9 | 10,717 |
| Other liabilities | 27,787 | 32.0 | 29.4 | 21,043 |
| Allocated regulatory capital | 11,014 | (6.1) | (8.0) | 11,727 |
| Relevant business indicators | 31-12-25 | 𝚫 % | 𝚫 % (1) | 31-12-24 |
| Performing loans and advances to customers under management (2) | 97,744 | 9.8 | 7.6 | 89,044 |
| Non-performing loans | 2,817 | 11.9 | 9.7 | 2,517 |
| Customer deposits under management (2) | 93,817 | 11.7 | 9.5 | 83,962 |
| Off-balance sheet funds (3) | 69,533 | 21.4 | 19.0 | 57,253 |
| Risk-weighted assets | 82,286 | (11.4) | (13.2) | 92,925 |
| RORWA (1)(4) | 5.84 | 5.70 | ||
| Efficiency ratio (%) | 30.4 | 30.3 | ||
| NPL ratio (%) | 2.7 | 2.7 | ||
| NPL coverage ratio (%) | 124 | 121 | ||
| Cost of risk (%) | 3.31 | 3.39 | ||
| (1) At constant exchange rate. (2) Excluding repos. (3) Includes mutual funds, customer portfolios and other off-balance sheet funds. (4) For more information on the calculation methodology, as well as the calculation of the metric at the consolidated Group level, see Alternative Performance Measures at this report. |
||||
Macro and industry trends
Weakness in investment and the industrial sector have limited economic growth during the second half of 2025, with machinery exports and services being the main drivers of activity. BBVA Research maintains its growth forecast at 0.7% for 2025 and estimates the increase for 2026 at 1.2% (two tenths above the previous scenario), in the context of lower fiscal consolidation, looser monetary conditions, and some uncertainty associated with the revision of the United States, Mexico and Canada (USMCA) free trade agreement. Inflation stabilized at around 3.7% during the last quarter of 2025, closing the year at this rate, and is expected to remain at similar levels throughout 2026 (3.8% is the expected figure for the year-end). Following the December cut, interest rates ended 2025 at 7%, and the expected price and activity environment anticipates gradual cuts, with 6.5% set as the target level for 2026.
Regarding the banking system, with data at the end of November 2025, the volume of credit to the non-financial private sector increased by 7.2% year-on-year, with growth in all the main portfolios: consumer loans (+12.2%), mortgage loans (+5.3%) and corporate loans (+5.6%). The growth of total deposits (demand and time deposits) remained slightly below than the credit growth (+5.2% year-on-year in November 2025), with demand deposits (+6.5%) growing more strongly than time deposits (+2.9%). Meanwhile, the system's NPL ratio worsened slightly to 2.46% in November 2025 and the capital indicators remained comfortable.
Unless expressly stated otherwise, all the comments below on rates of variation, for both activity and results, will be given at constant exchange rate. These rates, together with variations at current exchange rates, can be found in the attached tables of financial statements and relevant business indicators.
Activity
The most relevant aspects related to the area's activity during 2025 were:
Lending activity (performing loans under management) grew by 7.6% during 2025, supported by the evolution of the retail portfolio, which grew by 11.9%, with a favorable performance of all the portfolios, where the dynamism of consumer loans stands out, registering an increase of 13.8%. In the wholesale portfolio, growth stood at 2.9%, boosted by the performance of corporate banking. As a result of this evolution, the loan portfolio continued showing a high degree of diversification, with 46% of the total portfolio corresponding to wholesale credit and the remaining 54% to retail credit.
Customer deposits under management increased by 13.4% in 2025, with a notable growth in off-balance sheet funds of 19.0% and 9.5% in customer deposits.
The most relevant aspects related to the area's activity in the fourth quarter of 2025 were:
During the quarter, lending activity grew by 3.7%, with more notable growth in the wholesale portfolio (+4.9%), driven by the dynamism of corporate banking. Meanwhile, the retail portfolio increased by 2.8%, with favorable performance across all products, particularly credit cards (+6.7%), driven by year-end campaigns ("Buen Fin").
With regard to the asset quality indicators, the NPL ratio stood at 2.7% at the end of December 2025, which represents a decrease of 5 basis points compared to the end of September, mainly explained by the boost in activity in the last quarter and a moderate growth in non-performing loans. On the other hand, the NPL coverage ratio was 124% at the end of December 2025, which represents an increase compared to the end of September.
Customer deposits under management were 3.3% above the September balances, originated from the evolution of customer deposits (+5.1%), with a stronger growth in demand deposits than in time deposits.
Results
BBVA Mexico achieved a cumulative net attributable profit of €5,264m at the end of December 2025, which represents a year-on-year growth of 5.7%, explained mainly by the favorable evolution of the net interest income.
The most relevant aspects of the year-on-year evolution in the income statement as of the end of December 2025 are summarized below:
Net interest income increased by 8.1%, driven by higher retail lending volumes and lower cost of funds, in an environment of falling reference rates, further boosted by wholesale issuances carried out by BBVA Mexico.
Net fees and commissions grew by 6.0%, mainly as a result of the higher revenues from asset management, mostly investment and pension funds, related to growth in activity and to a lesser extent, one-off fees associated with investment banking transactions.
The contribution from NTI increased by 12.3% mainly due to the good performance of the ALCO portfolio.
The other operating income and expenses line item recorded an increase of 18.7%, supported by the strong performance of the insurance business, which more than offset the increase in contributions to the deposit guarantee fund.
Operating expenses grew by 8.7%, mainly due to the increase in overhead costs (technology expenses) and, to a lesser extent, higher personnel expenses.
Loan-loss provisions increased by 10.5%, with higher requirements for the retail portfolio as a result of growth in activity. Thus, the cumulative cost of risk at the end of December 2025 increased to 3.31%, which is an increase of 4 basis points compared to that recorded at the end of September, although it remains 8 basis points below the end of 2024.
In the quarter, and excluding the effect of exchange rate fluctuation, BBVA Mexico generated net attributable profit of €1,366m, which represents an increase of 4.8% variation with respect to the previous quarter supported by the favorable performance of all components of the gross income. Noteworthy was the dynamism of NTI (+25.4%) and the other operating income and expenses heading (+35.4%), the latter favored by insurance business activity. These effects offset the growth in operating expenses, which reflect in the quarter the increase in variable compensation to staff, in line with areas improved annual performance, as well as a higher loan-loss provisions.
Read legal disclaimer of this report.