
Group
Quarterly evolution of results
BBVA Group's net attributable profit for the third quarter of 2025 was €2,531m, 8.0% below the previous quarter. The third quarter saw a favorable performance in recurring revenues from the banking business and NTI. This was offset by higher operating expenses during the quarter due to the recognition in the second quarter of a lower cost corresponding to the Value Added Tax (VAT) in BBVA S.A., a more negative impact in the line of other operating income and expenses, and higher provisions for impairment on financial assets.
| CONSOLIDATED INCOME STATEMENT: QUARTERLY EVOLUTION (MILLIONS OF EUROS) | ||||||||
|---|---|---|---|---|---|---|---|---|
| 2025 | 2024 | |||||||
| 3Q | 2Q | 1Q | 4Q | 3Q | 2Q | 1Q | ||
| Net interest income | 6,640 | 6,208 | 6,398 | 6,406 | 5,868 | 6,481 | 6,512 | |
| Net fees and commissions | 2,060 | 1,951 | 2,060 | 2,234 | 1,912 | 1,955 | 1,887 | |
| Net trading income | 531 | 484 | 948 | 983 | 1,044 | 1,114 | 772 | |
| Other operating income and expenses | (128) | 67 | (82) | (303) | (107) | (324) | (952) | |
| Gross income | 9,102 | 8,710 | 9,324 | 9,320 | 8,716 | 9,227 | 8,218 | |
| Operating expenses | (3,574) | (3,224) | (3,562) | (4,004) | (3,330) | (3,477) | (3,383) | |
| Personnel expenses | (1,899) | (1,792) | (1,901) | (2,216) | (1,810) | (1,855) | (1,778) | |
| Other administrative expenses | (1,296) | (1,062) | (1,283) | (1,380) | (1,154) | (1,238) | (1,229) | |
| Depreciation | (379) | (370) | (378) | (408) | (366) | (384) | (375) | |
| Operating income | 5,528 | 5,485 | 5,762 | 5,316 | 5,386 | 5,751 | 4,835 | |
| Impairment on financial assets not measured at fair value through profit or loss | (1,567) | (1,377) | (1,385) | (1,466) | (1,440) | (1,479) | (1,361) | |
| Provisions or reversal of provisions | (99) | (82) | (51) | (99) | (61) | 19 | (57) | |
| Other gains (losses) | 6 | 50 | 22 | 8 | (19) | 31 | 40 | |
| Profit (loss) before tax | 3,868 | 4,076 | 4,348 | 3,759 | 3,867 | 4,322 | 3,458 | |
| Income tax | (1,206) | (1,160) | (1,466) | (1,171) | (1,135) | (1,374) | (1,151) | |
| Profit (loss) for the period | 2,662 | 2,916 | 2,882 | 2,588 | 2,732 | 2,949 | 2,307 | |
| Non-controlling interests | (132) | (167) | (184) | (155) | (105) | (154) | (107) | |
| Net attributable profit (loss) | 2,531 | 2,749 | 2,698 | 2,433 | 2,627 | 2,794 | 2,200 | |
| Adjusted earning (loss) per share (euros) (1) | 0.42 | 0.46 | 0.45 | 0.41 | 0.44 | 0.47 | 0.37 | |
| Earning (loss) per share (euros) (1) | 0.42 | 0.46 | 0.45 | 0.40 | 0.44 | 0.47 | 0.36 | |
| (1) For more information, see Alternative Performance Measures at this report. | ||||||||
Year-on-year evolution of results
The BBVA Group achieved a cumulative result of €7,978m, by the end of September 2025, representing a year-on-year increase of 4.7%, supported by the strong performance of recurring revenues from the banking business. If the exchange rates variation is excluded, this growth increases to 19.8%, as the main currencies of the countries in which the Group operates depreciated in the comparison period, that is, between September 2024 and September 2025.
| CONSOLIDATED INCOME STATEMENT (MILLIONS OF EUROS) | ||||
|---|---|---|---|---|
| Jan.-Sep.25 | 𝚫 % | 𝚫 % at constant exchange rates | Jan.-Sep.24 | |
| Net interest income | 19,246 | 2.0 | 12.6 | 18,861 |
| Net fees and commissions | 6,071 | 5.5 | 16.6 | 5,754 |
| Net trading income | 1,962 | (33.0) | (25.6) | 2,930 |
| Other operating income and expenses | (143) | (89.7) | (91.0) | (1,383) |
| Gross income | 27,136 | 3.7 | 16.2 | 26,161 |
| Operating expenses | (10,360) | 1.7 | 11.0 | (10,189) |
| Personnel expenses | (5,592) | 2.7 | 12.1 | (5,443) |
| Other administrative expenses | (3,640) | 0.5 | 10.8 | (3,621) |
| Depreciation | (1,128) | 0.2 | 6.4 | (1,125) |
| Operating income | 16,776 | 5.0 | 19.7 | 15,972 |
| Impairment on financial assets not measured at fair value through profit or loss | (4,328) | 1.1 | 12.0 | (4,279) |
| Provisions or reversal of provisions | (233) | 135.2 | 140.9 | (99) |
| Other gains (losses) | 77 | 46.7 | 49.5 | 53 |
| Profit (loss) before tax | 12,292 | 5.5 | 21.6 | 11,647 |
| Income tax | (3,832) | 4.7 | 19.2 | (3,659) |
| Profit (loss) for the period | 8,461 | 5.9 | 22.7 | 7,987 |
| Non-controlling interests | (483) | 32.1 | 102.2 | (366) |
| Net attributable profit (loss) | 7,978 | 4.7 | 19.8 | 7,622 |
| Adjusted earning (loss) per share (euros) (1) | 1.33 | 1.28 | ||
| Earning (loss) per share (euros) (1) | 1.33 | 1.27 | ||
| (1) For more information, see Alternative Performance Measures at this report. | ||||
Unless expressly indicated otherwise, for a better understanding of the changes under the main headings of the Group's income statement, the rates of change provided below refer to constant exchange rates. When comparing two dates or periods presented in this report, the impact of changes in the exchange rates against the euro of the currencies of the countries in which BBVA operates is sometimes excluded, assuming that exchange rates remain constant. For this purpose, the average exchange rate of the currency of each geographical area of the most recent period is used for both periods, except for those countries whose economies have been considered hyperinflationary, for which the closing exchange rate of the most recent period is used.
The accumulated net interest income as of September 30, 2025 was 12.6% higher than in the same period of the previous year, mainly driven by the evolution in Turkey and, to a lesser extent, by Mexico, followed by the contribution of Spain and Rest of Business. Moreover, net interest income over average total assets has shown a favorable evolution over the last few quarters, reflecting greater efficiency in the management of the traditional banking business. The growing trend of the indicator is evidence of the bank's capacity to generate solid interest income.
Likewise, net fees and commissions experienced a year-on-year growth of 16.6%, once again supported by the performance of fees from payment methods and, to a lesser extent, asset management net fees and commissions. Among the business areas, Turkey´s performance continues to stand out above the others.
Thus, overall recurring banking business revenues grew by 13.5% compared to the first nine months of 2024.
NET INTEREST INCOME / AVERAGE TOTAL ASSETS
(PERCENTAGE AT CONSTANT EXCHANGE RATES)
NET INTEREST INCOME PLUS NET FEES AND COMMISSIONS
(MILLIONS OF EUROS AT CONSTANT EXCHANGE RATES)
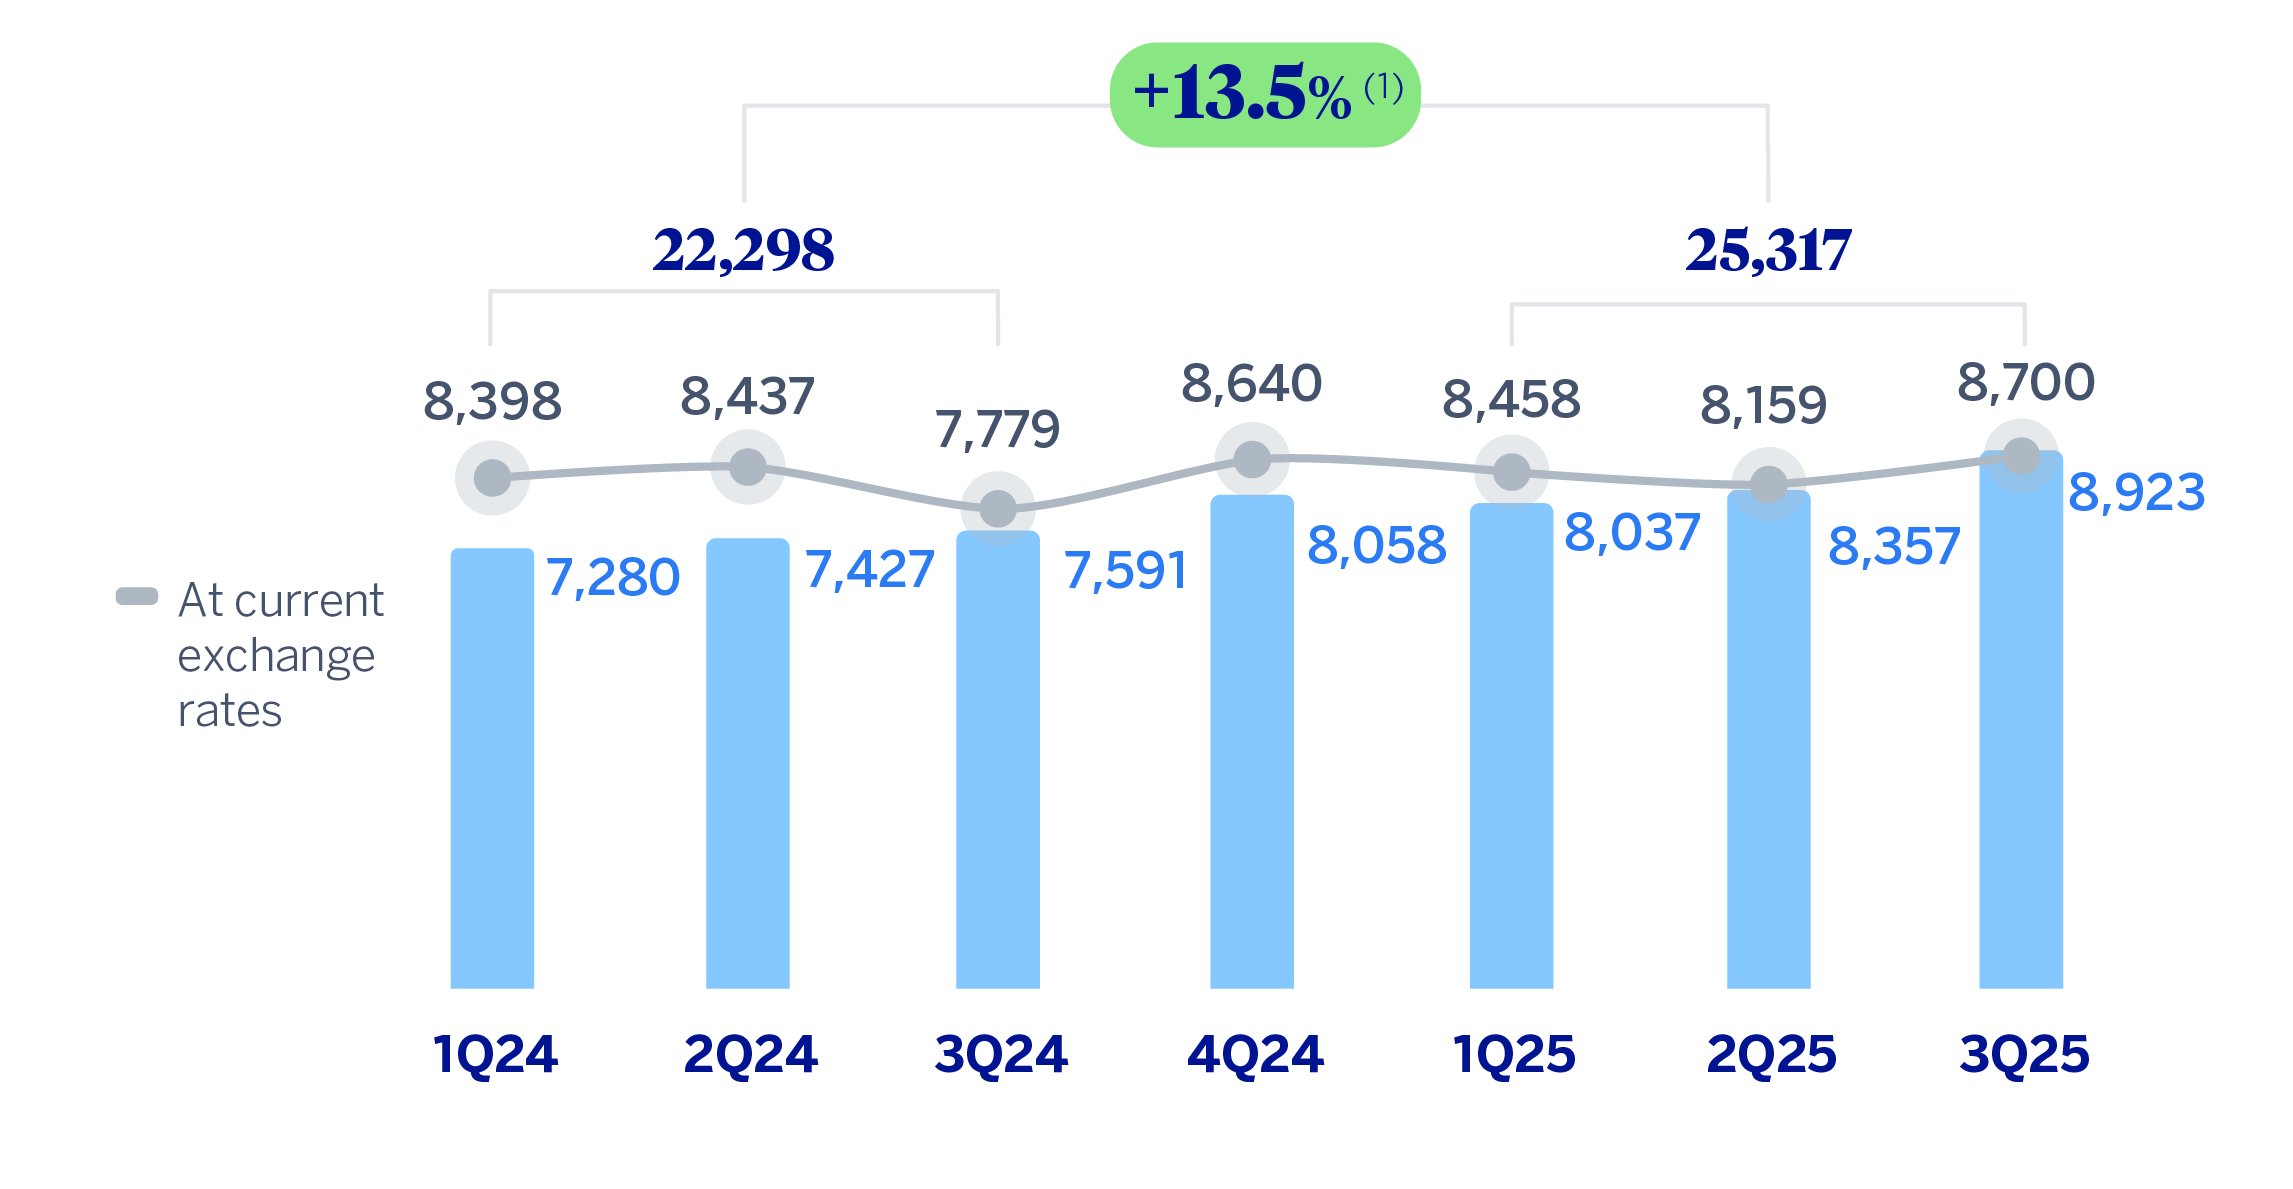
(1) At current exchange rates: +2.9%.
The NTI reported a 25.6% year-on-year decrease at the end of September 2025, mainly due to the lower results of Turkey and the Corporate Center.
The other operating income and expenses line accumulated, as of September 30, 2025, a significantly improved result compared to the same period of the previous year. This is due to a lower negative impact in the period January-September 2025 derived from the hyperinflation in Argentina and Turkey compared with the same period of 2024, as well as to the recording in Spain in the first quarter of 2024 of the total annual amount of the temporary tax on credit institutions and financial credit establishments for €285m. On the other hand, the results of the insurance business, also included in this line, had a positive evolution.
GROSS INCOME
(MILLIONS OF EUROS AT CONSTANT EXCHANGE RATES)
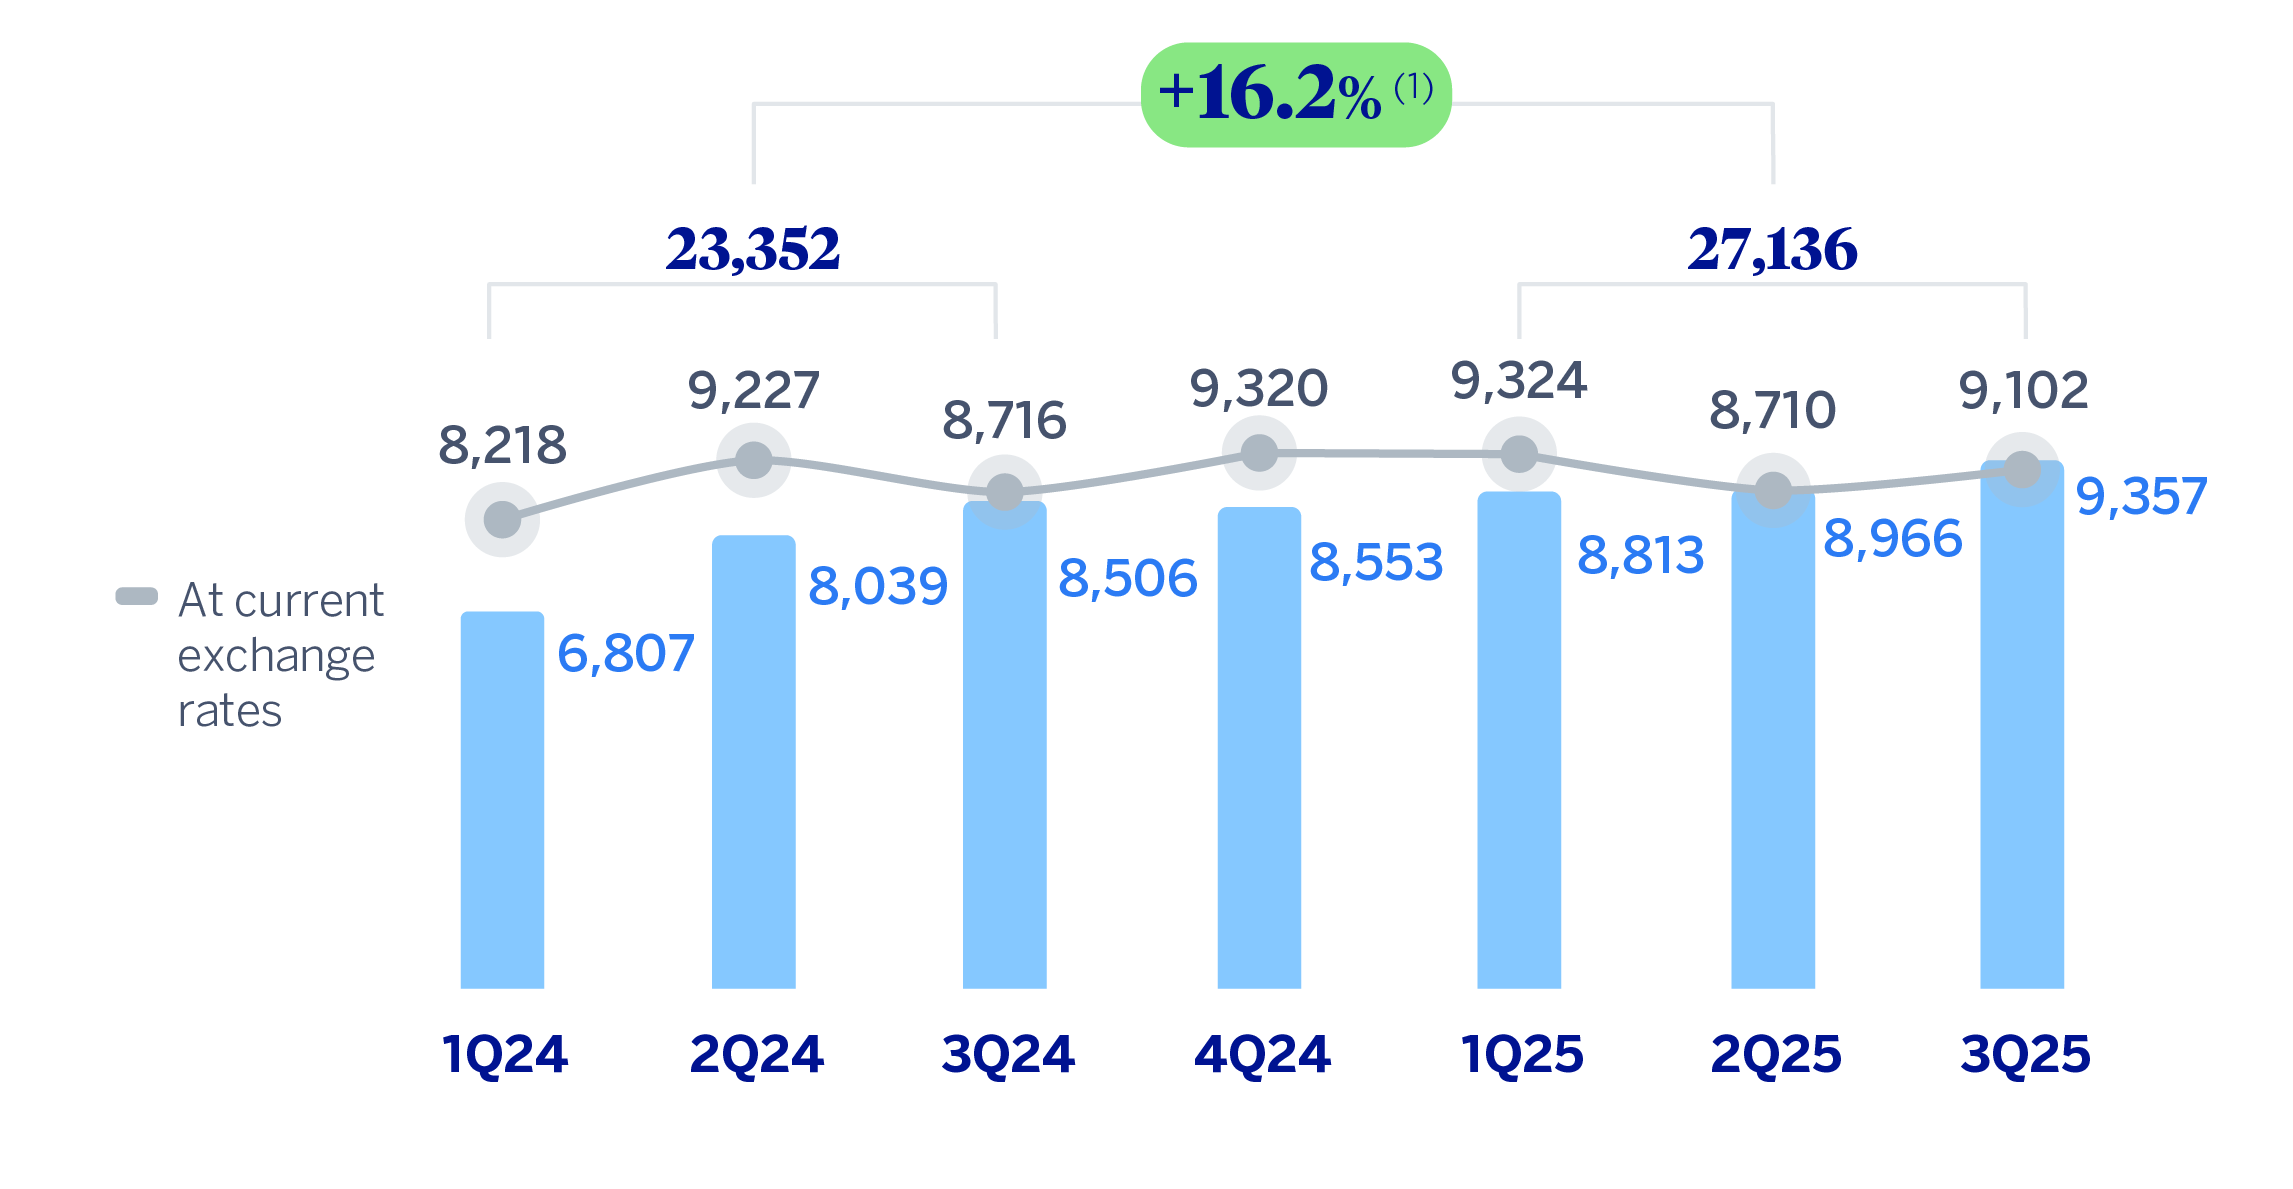
(1) At current exchange rates: +3.7%.
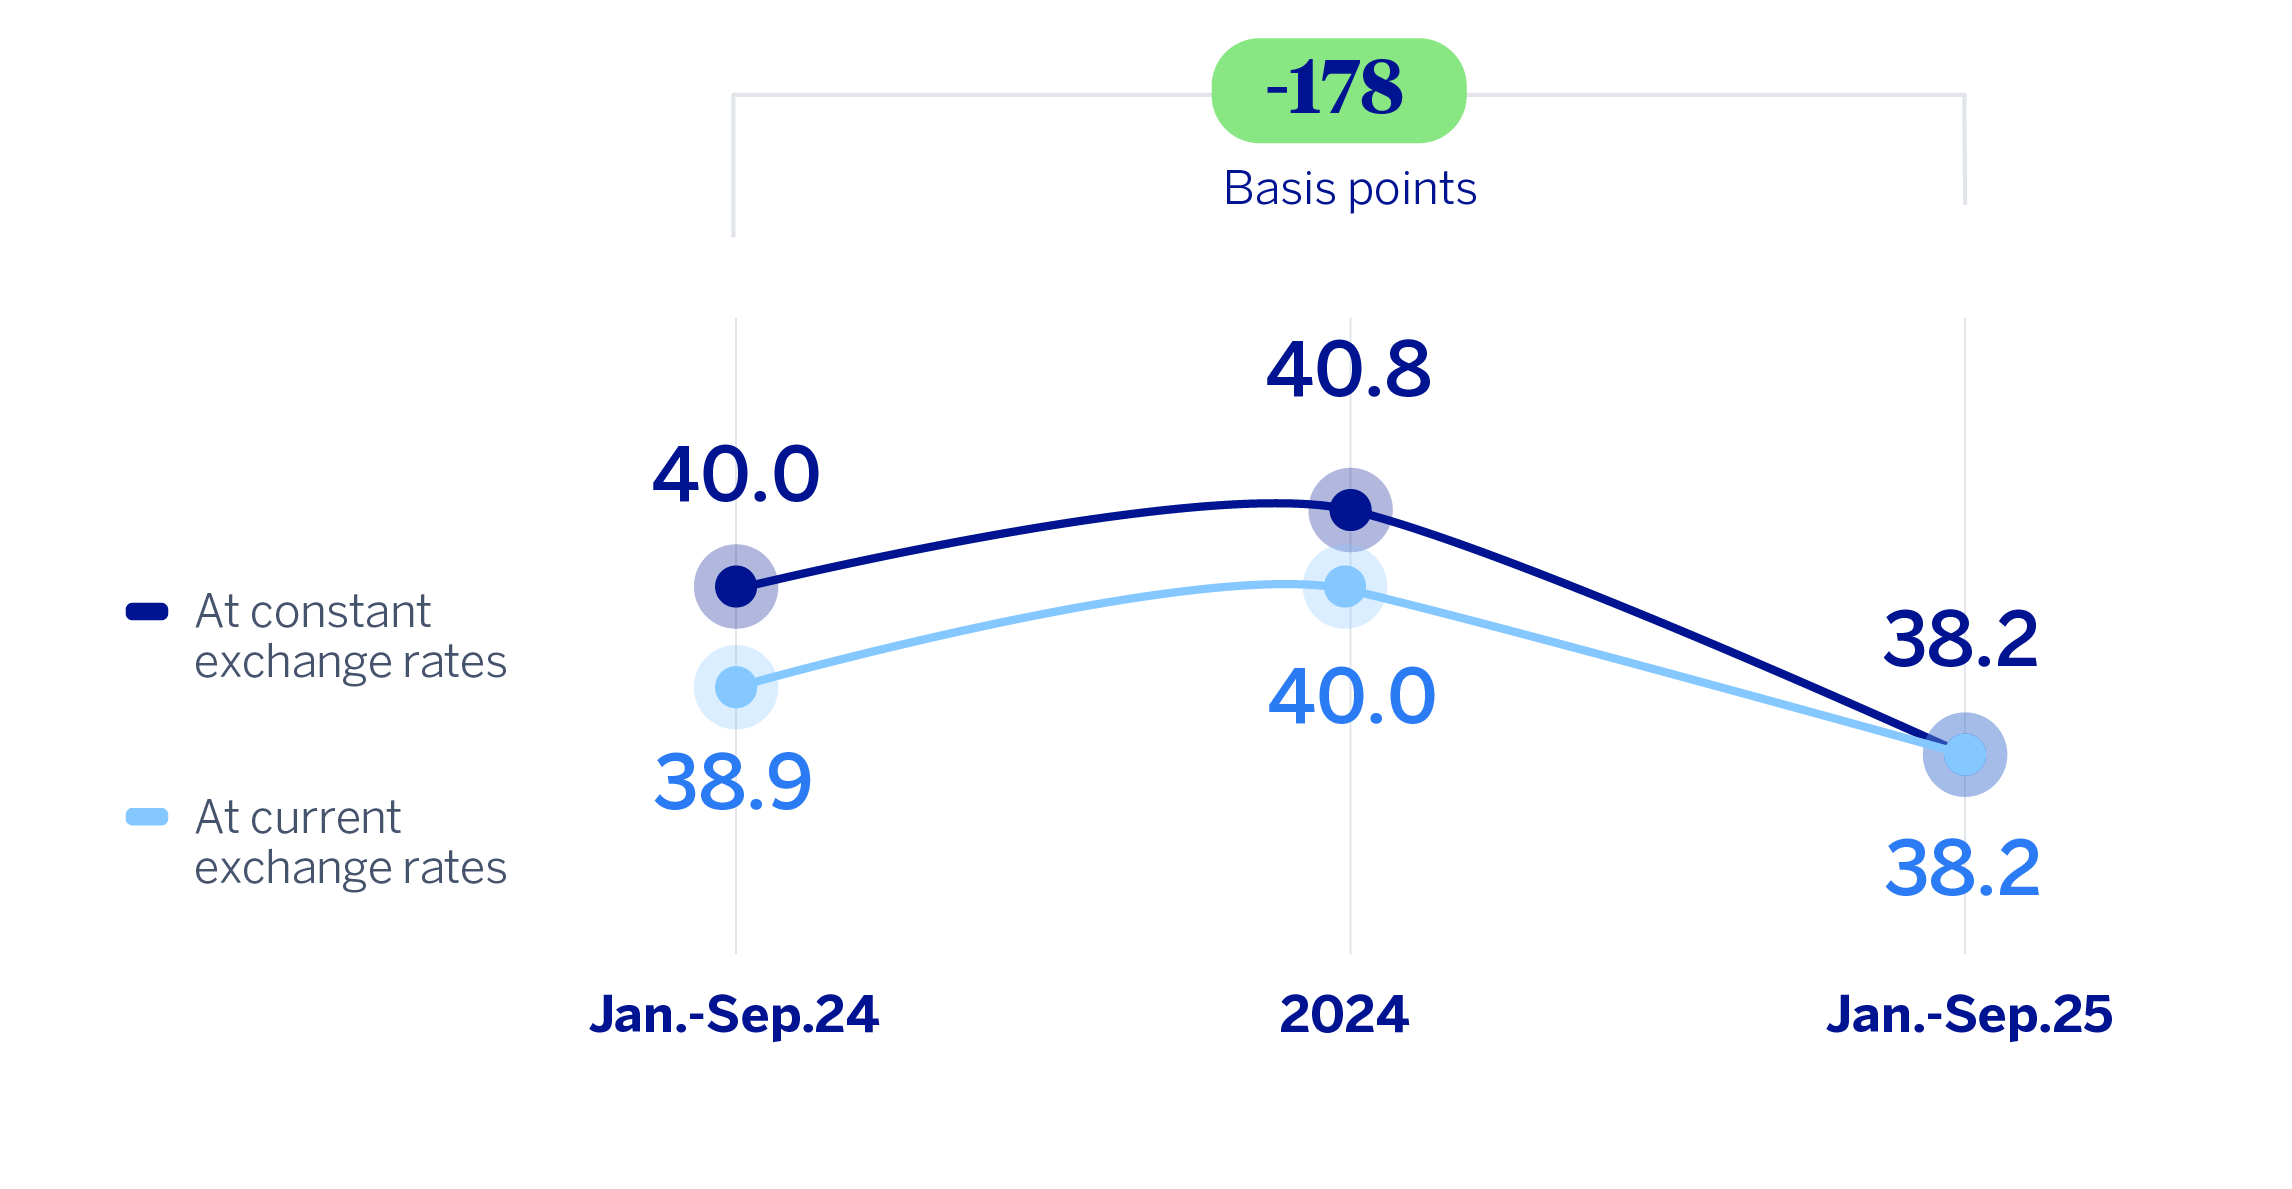
Thanks to the solid evolution in gross income, which increased by 16.2%, well above the rate of growth in operating expenses, (+11.0%), the efficiency ratio fell to 38.2% as of September 30, 2025, which represents an improvement of 178 basis points compared to the ratio as of September 30, 2024, at constant exchange rates.
OPERATING EXPENSES
(MILLIONS OF EUROS AT CONSTANT EXCHANGE RATES)
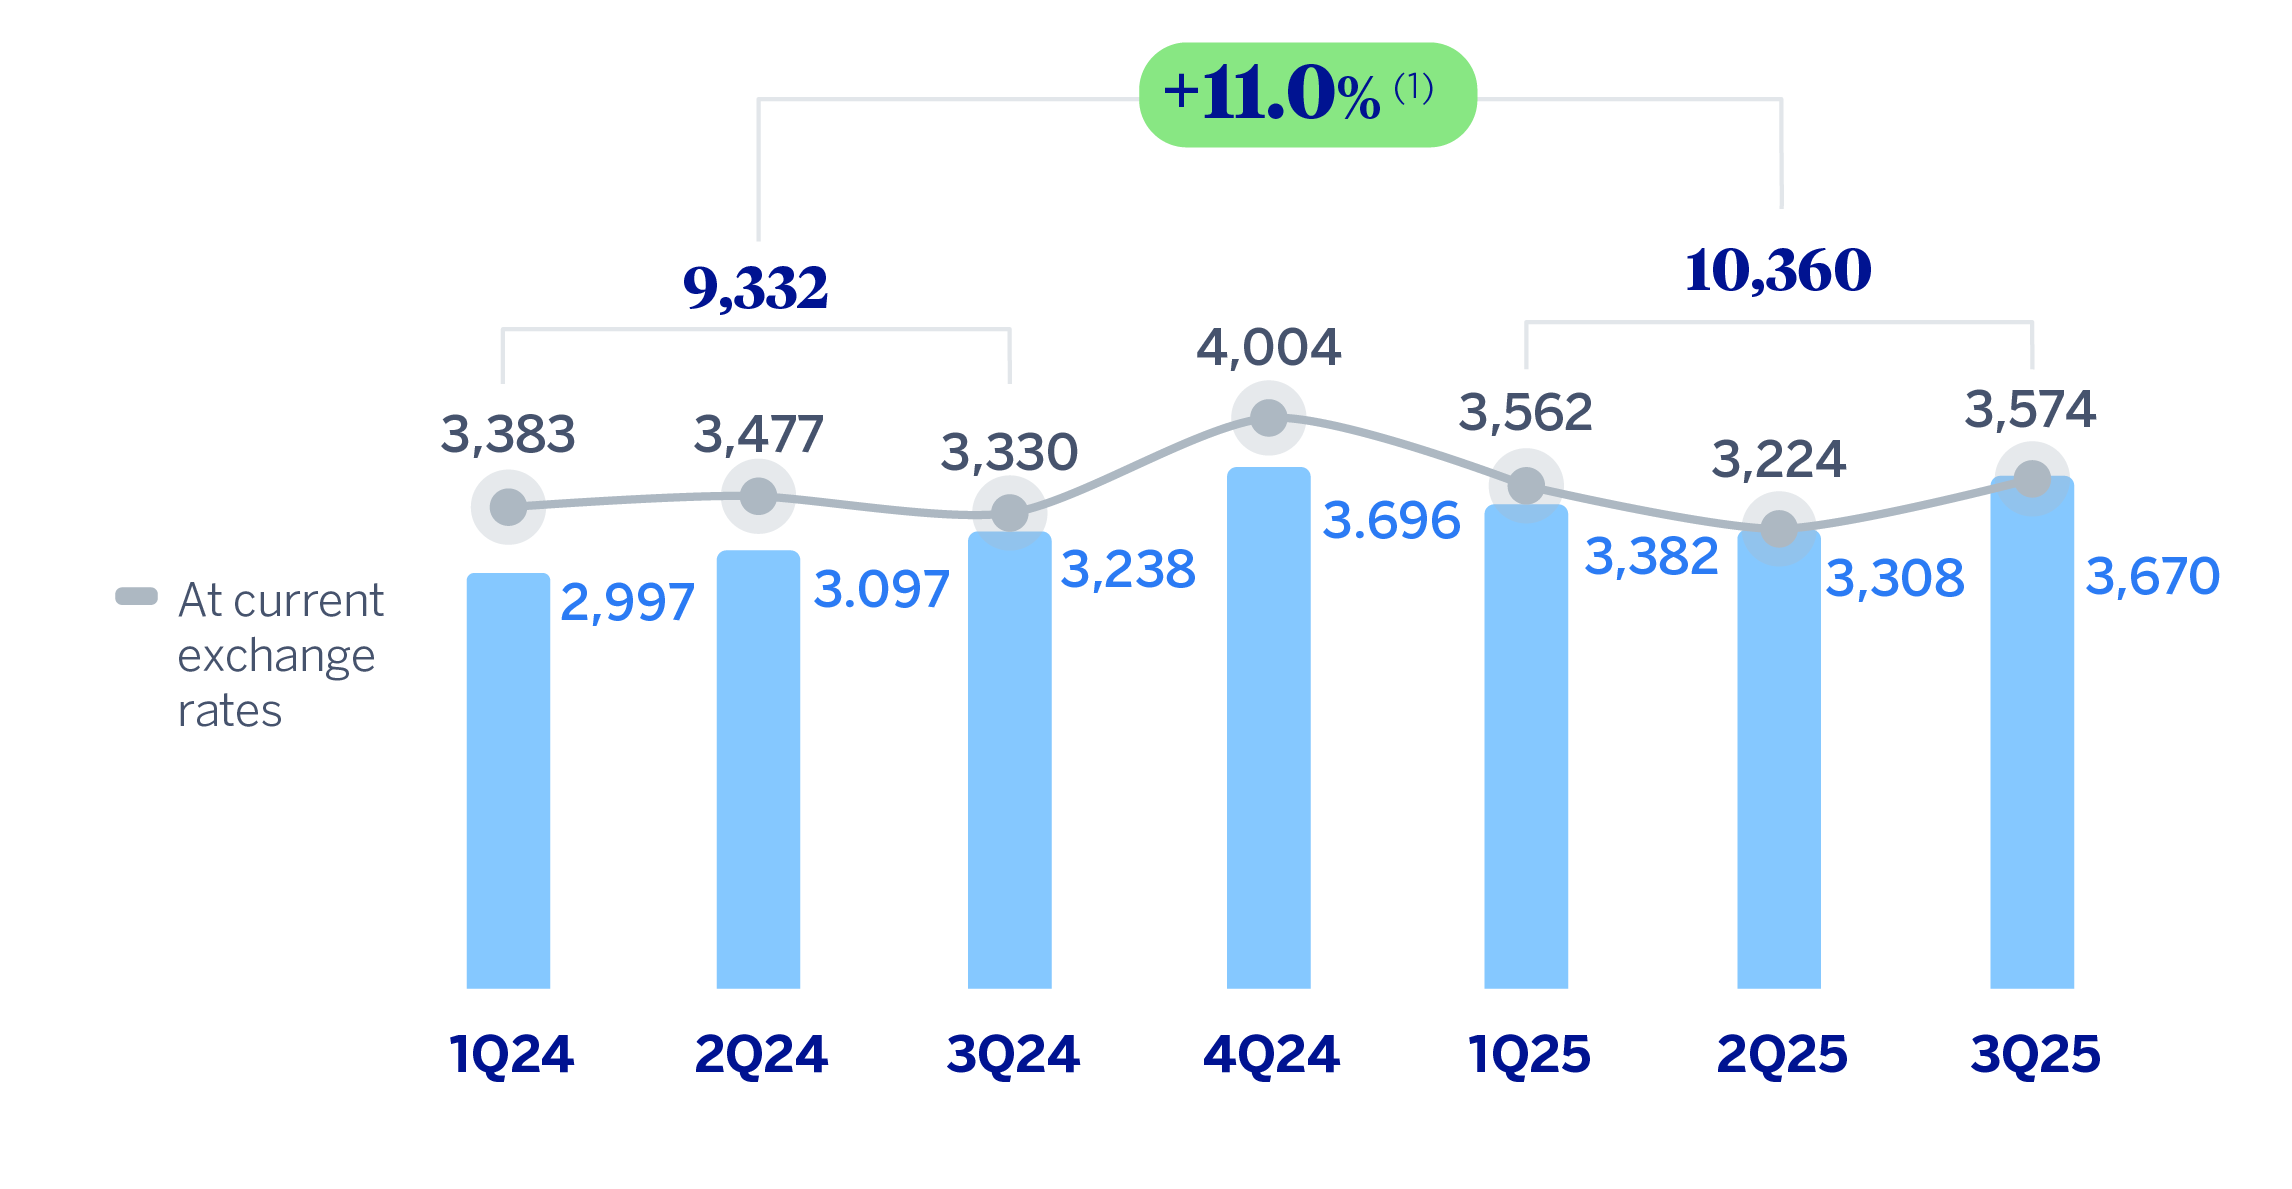
(1) At current exchange rates: +1.7%.
EFFICIENCY RATIO
(PERCENTAGE)
The impairment on financial assets not measured at fair value through profit or loss (impairment on financial assets) stood at 12.0% at the end of September 2025 higher than in the same period of the previous year. Turkey and Mexico were the main business areas that required an increase in the level of provisions, which was partially offset by lower needs in South America and, to a lesser extent, in Spain.
OPERATING INCOME
(MILLIONS OF EUROS AT CONSTANT EXCHANGE RATES)
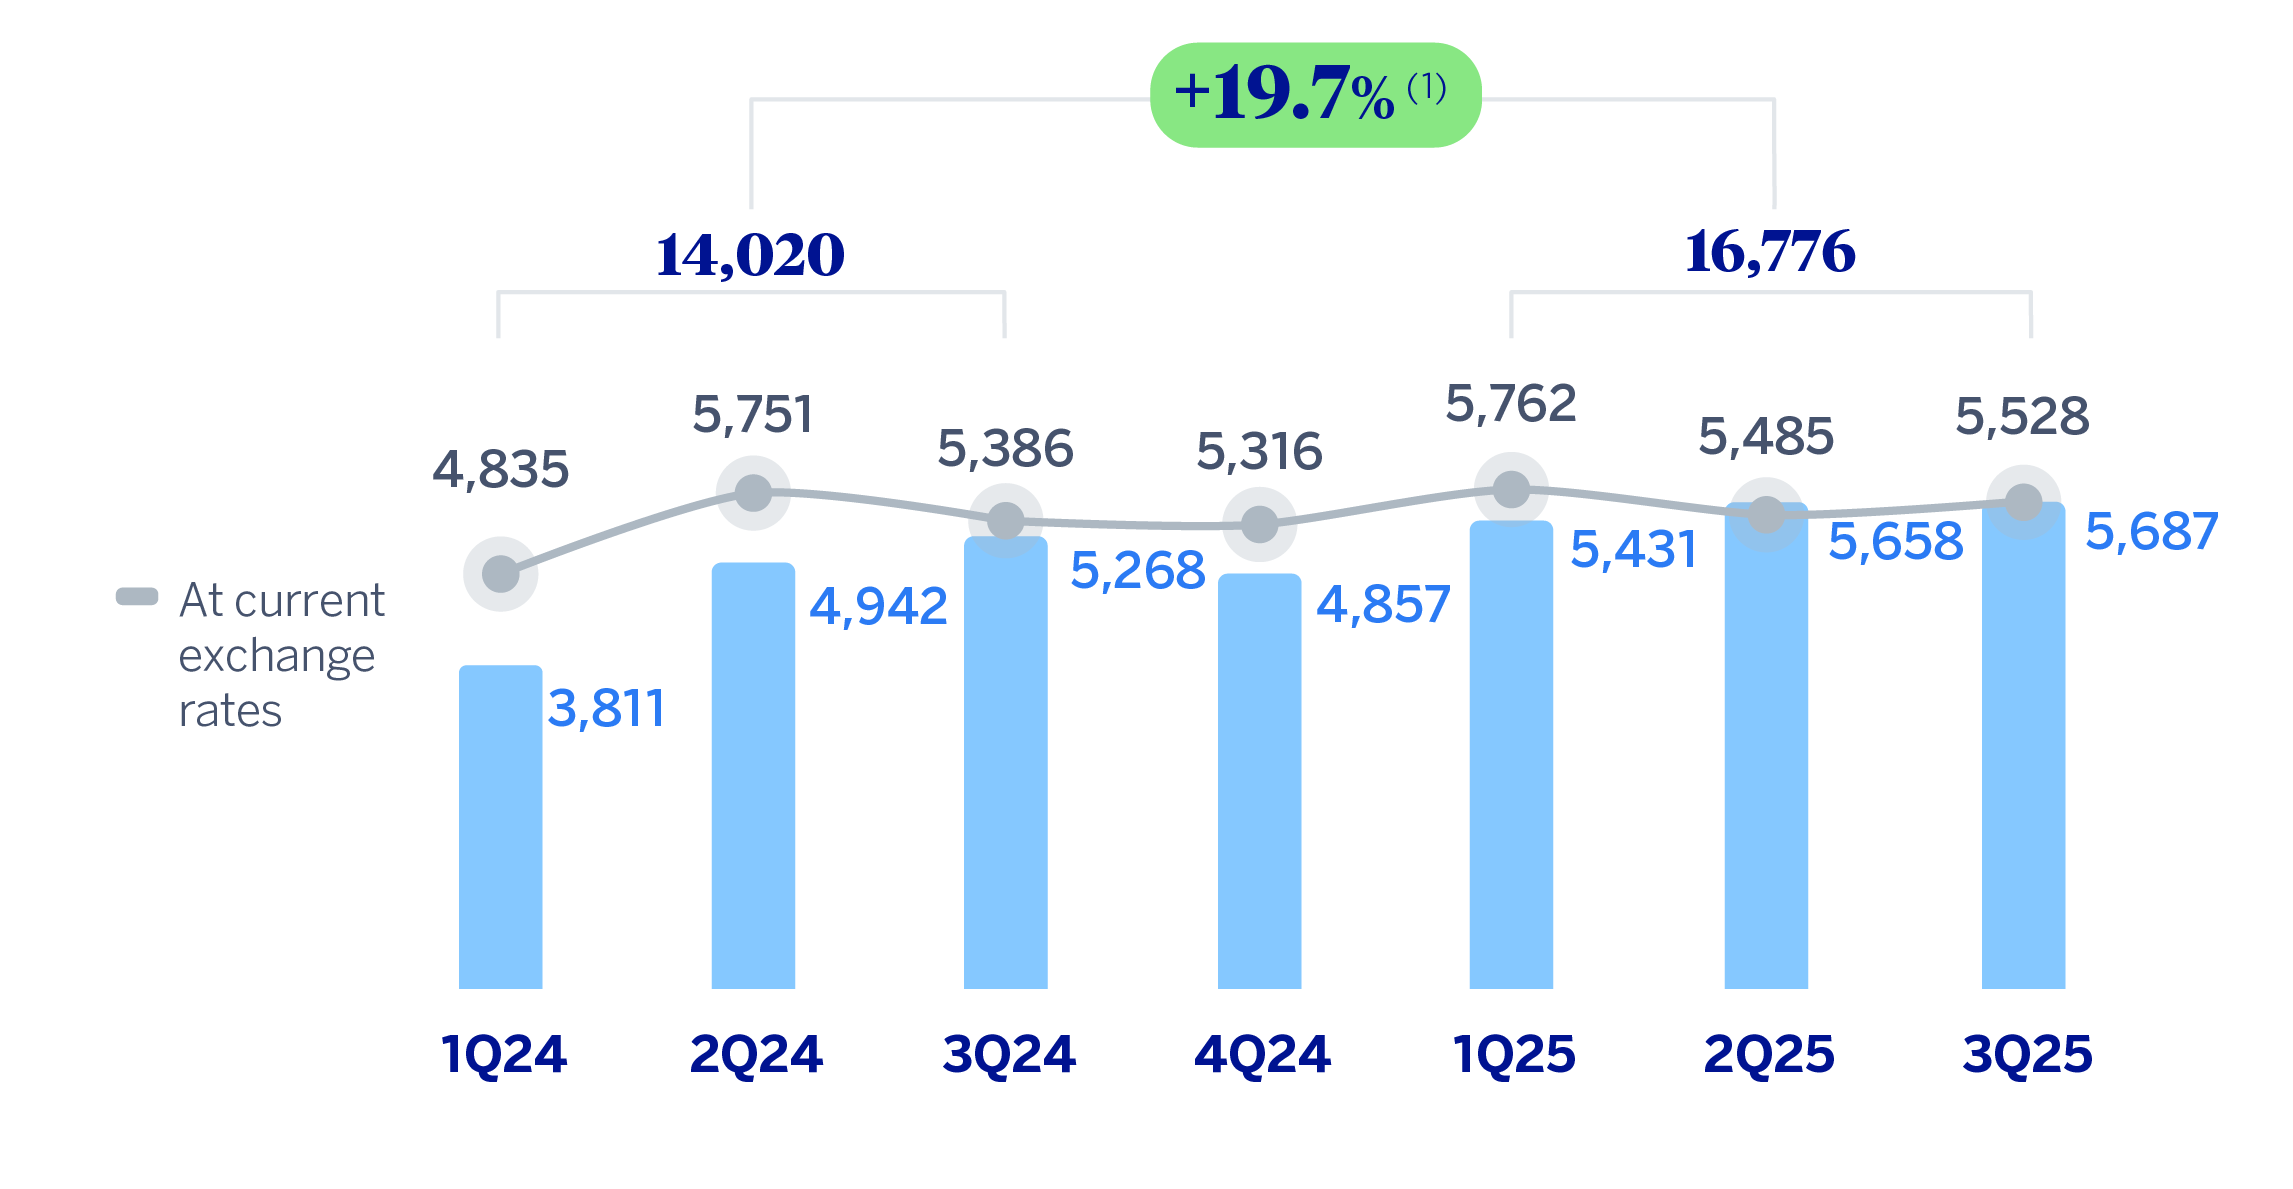
(1) At current exchange rates: +5.0%.
IMPAIRMENT ON FINANCIAL ASSETS
(MILLIONS OF EUROS AT CONSTANT EXCHANGE RATES)
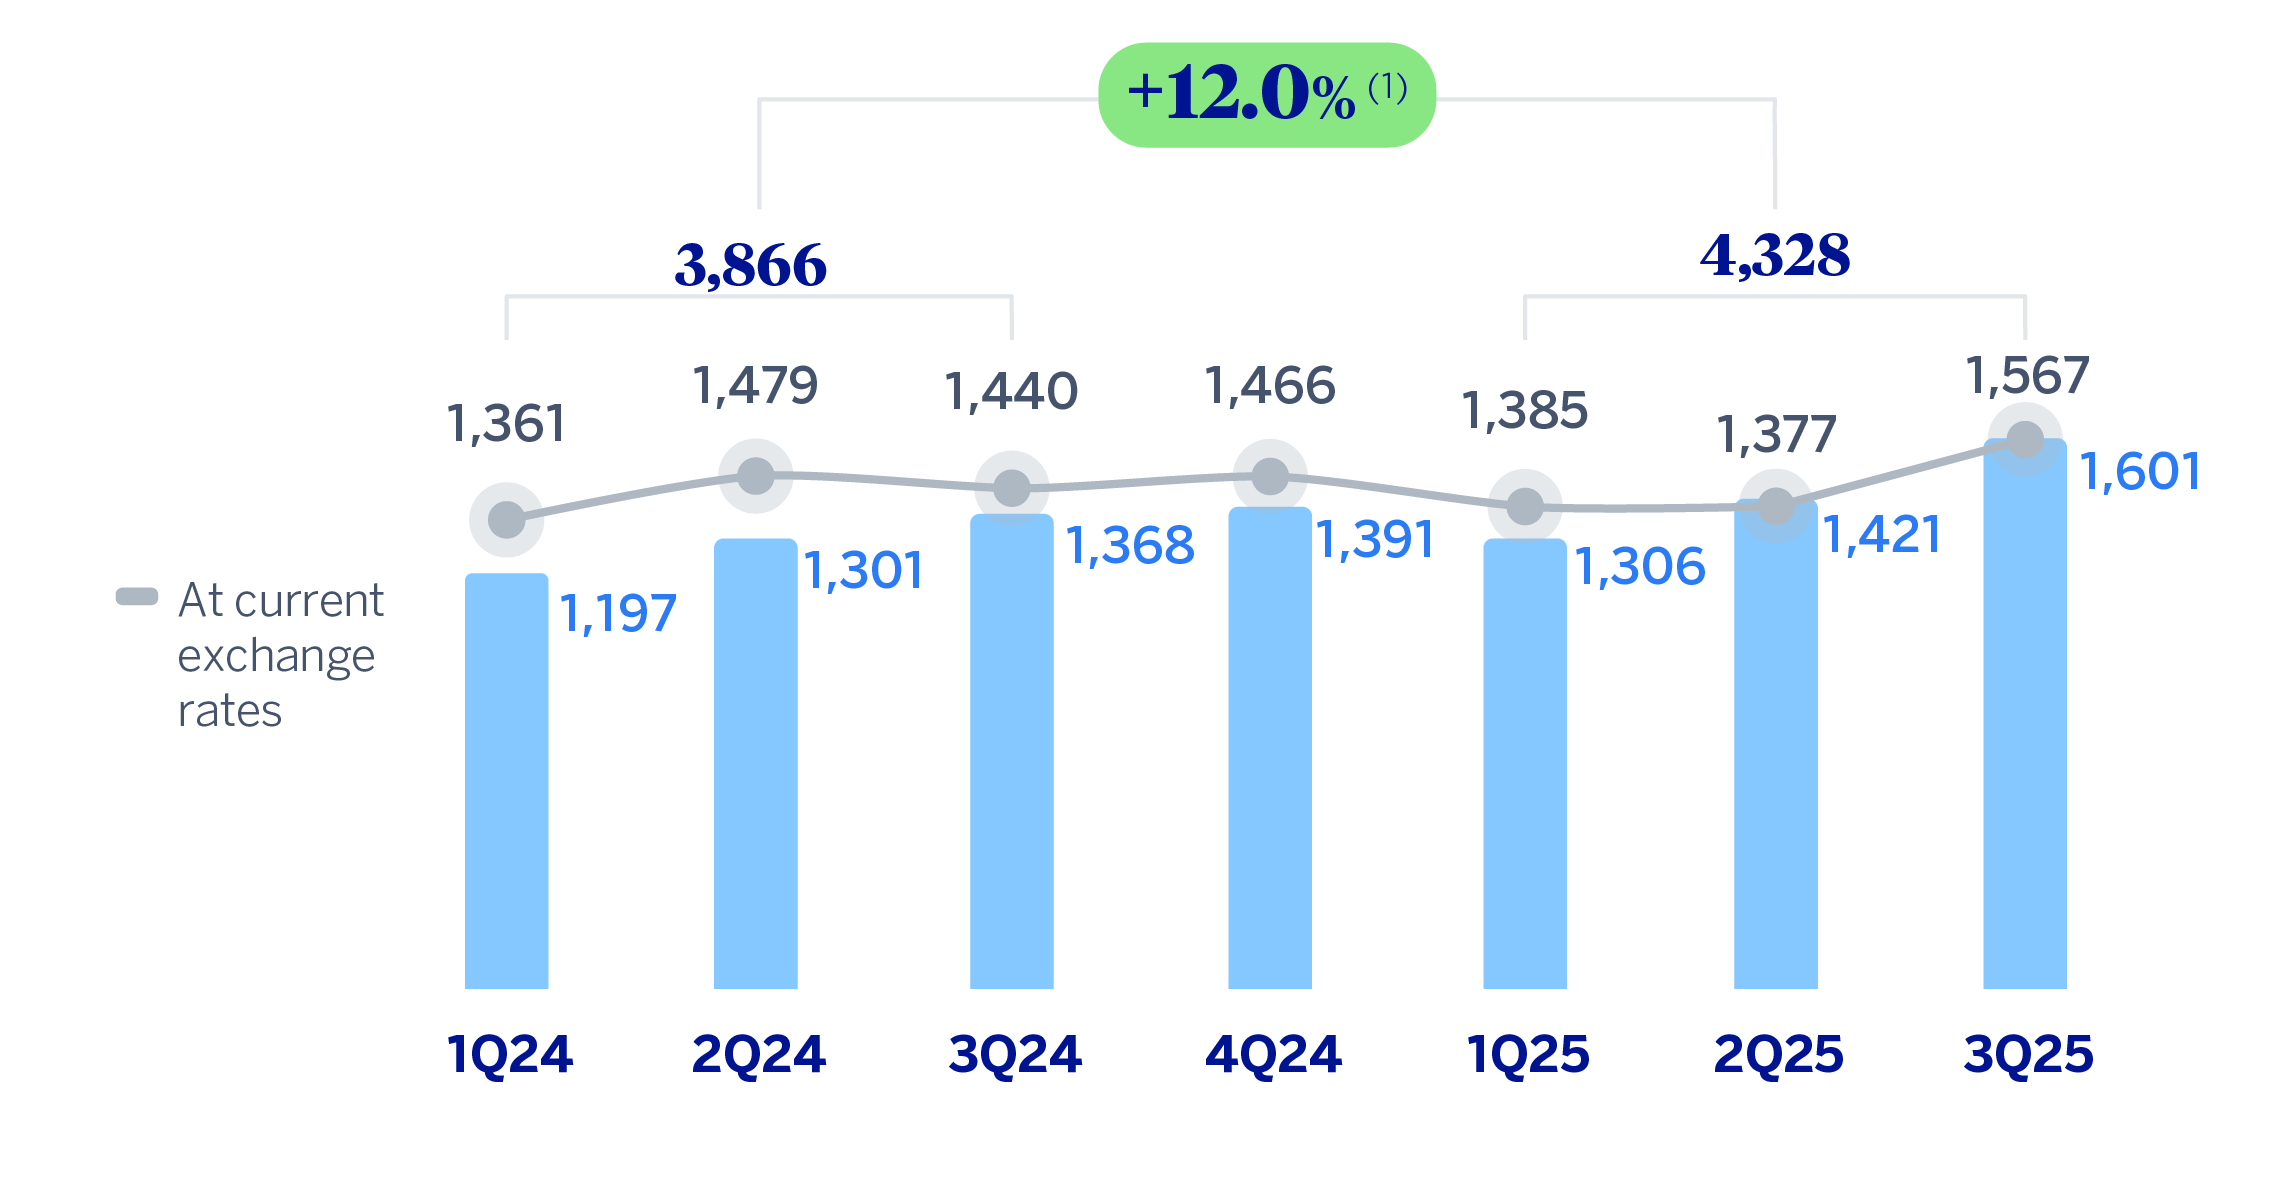
(1) At current exchange rates: +1.1%.
The provisions or reversal of provisions line (hereinafter provisions) registered at the end of September 30, 2025 higher provisions (+140.9% year-on-year), with growth in all business areas, except South America.
On the other hand, the other gains (losses) line ended September 2025 49.5% higher than September 2024 thanks mainly to the evolution in Spain.
Income tax includes the accrual corresponding to the new tax on net interest income and net fees and commissions in Spain for the period January-September 2025, which amounts to approximately €224m.
As a result of the above, the BBVA Group reached a net attributable profit of €7,978m accumulated during the first nine months of 2025, showing a significant growth of 19.8% compared to the same period of the previous year. This solid result is supported by the positive evolution of the recurring banking business revenues, which have been able to offset the increase in operating expenses and in the provisions for impairment losses on financial assets. In addition, there was a less negative hyperinflation impact compared to one registered for the period January-September 2024.
The net attributable profits, in millions of euros and accumulated at the end of September 2025 for the business areas that compose the Group were as follows: 3,139 in Spain, 3,875 in Mexico, 648 in Turkey, 585 in South America and 481 in Rest of Business.
NET ATTRIBUTABLE PROFIT (LOSS)
(MILLIONS OF EUROS AT CONSTANT EXCHANGE RATES)
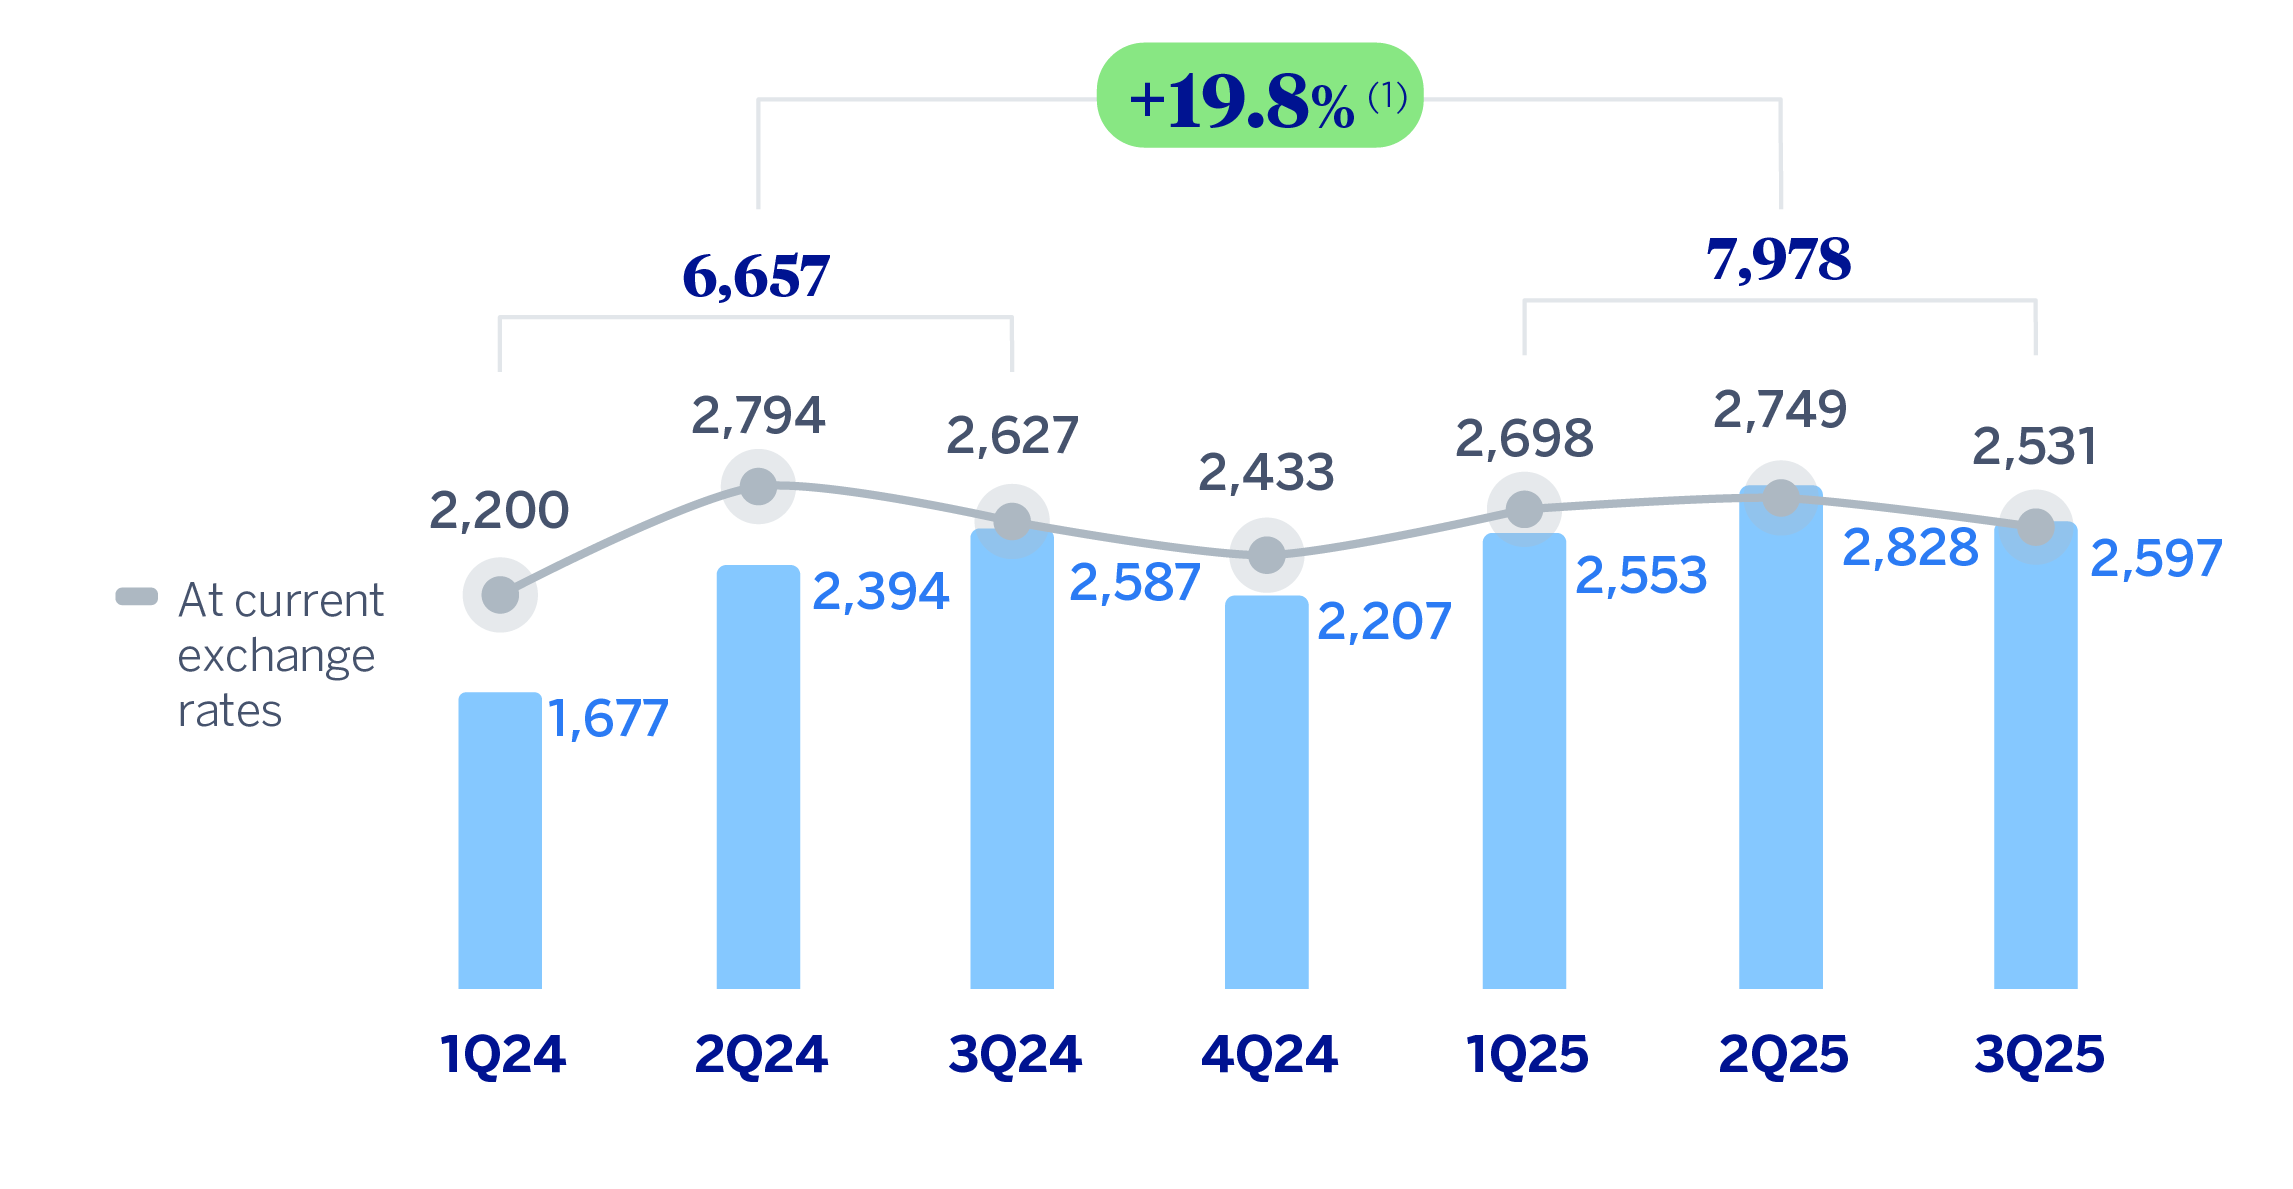
(1) At current exchange rates: +4.7%.
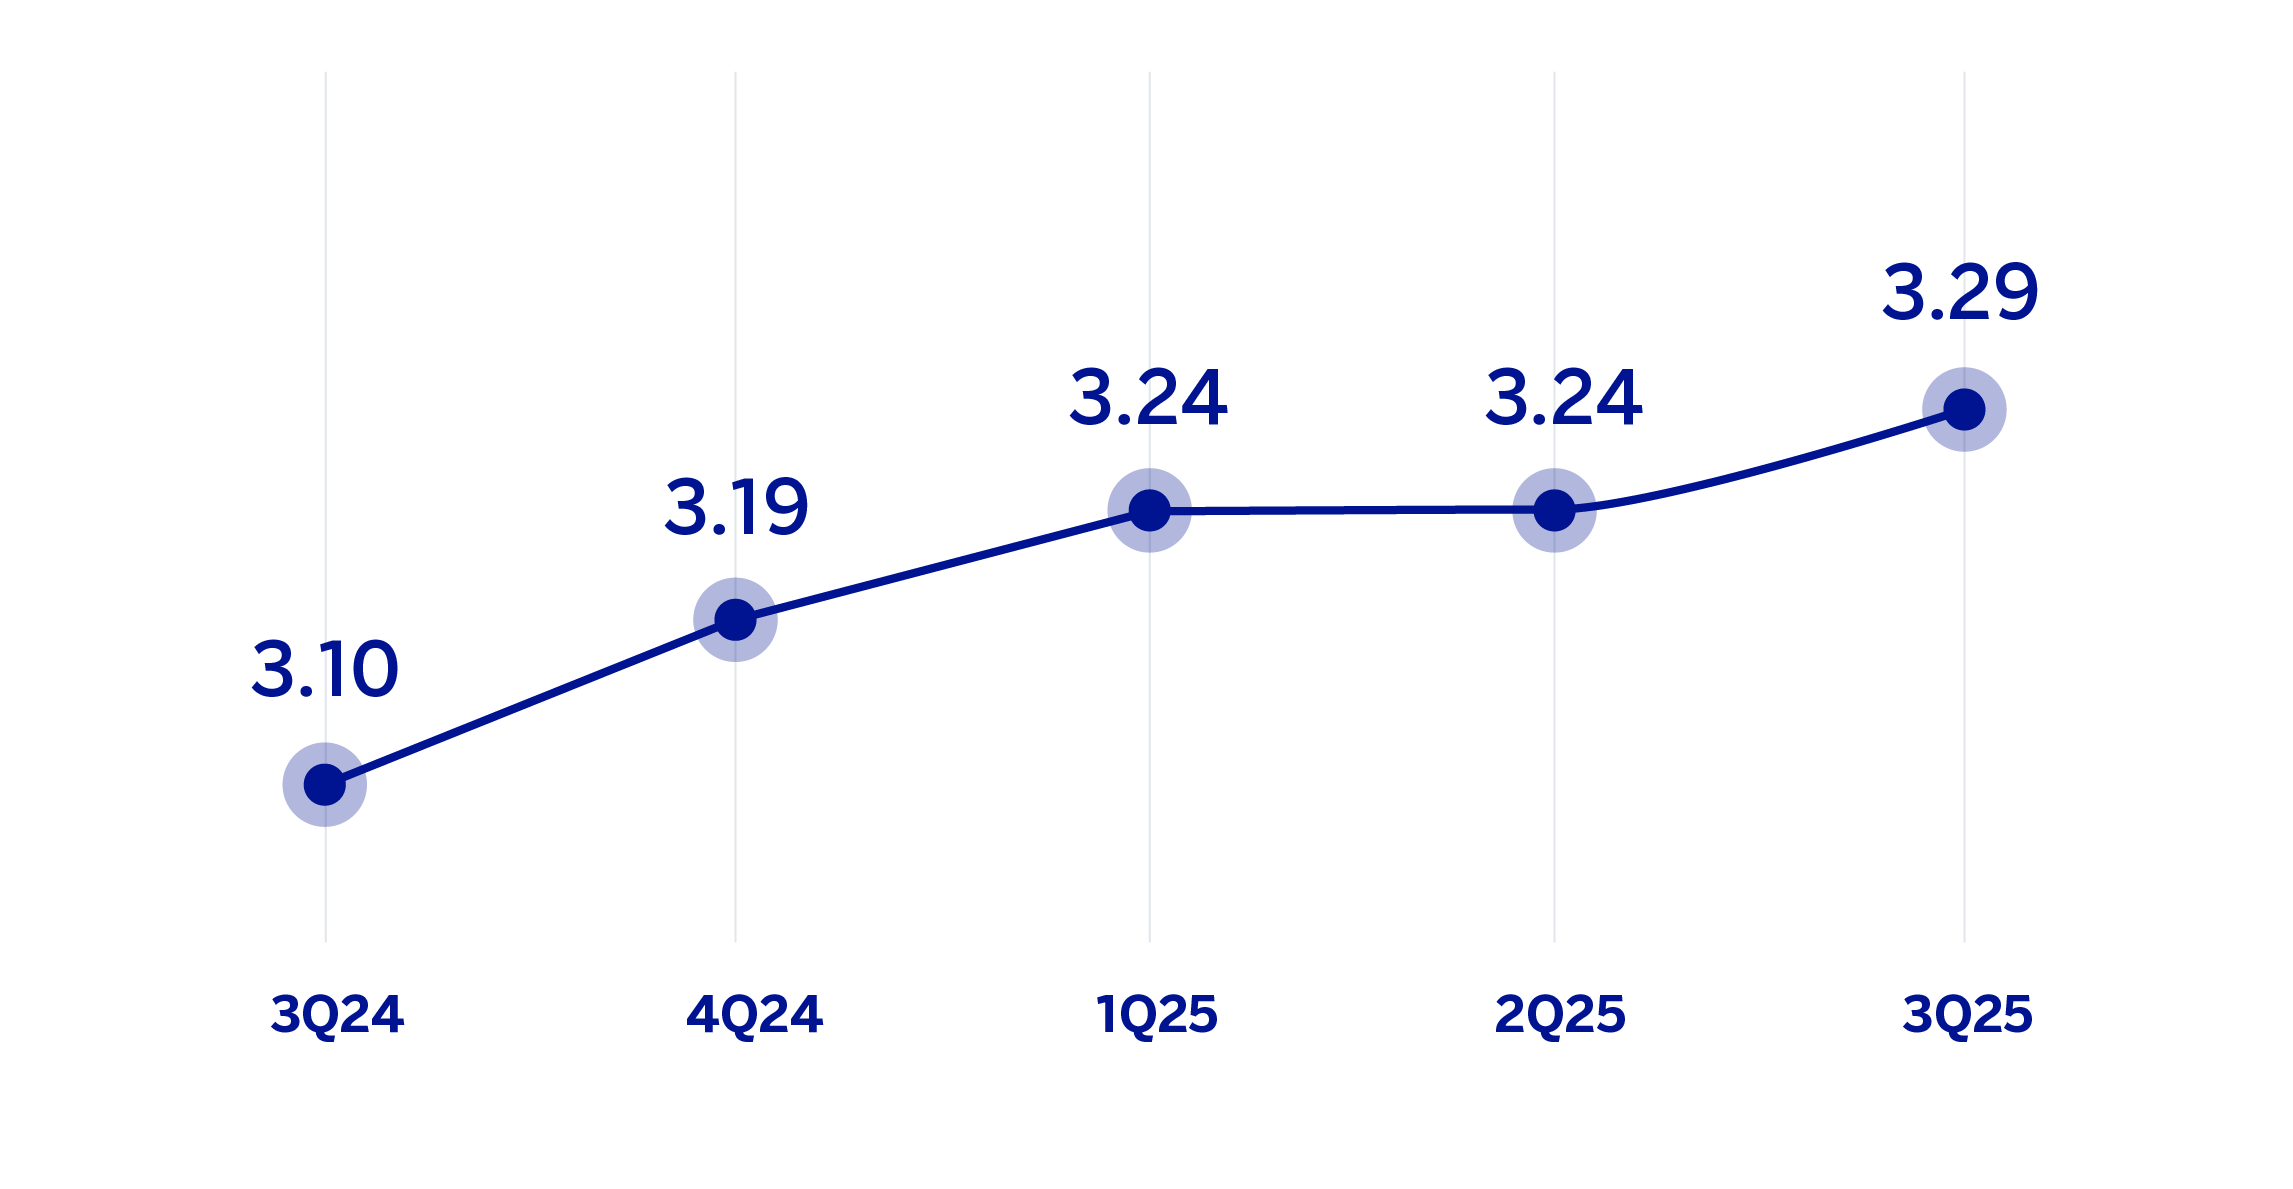
The Group's excellent performance has also allowed it to continue generating value, as is reflected in the growth of the tangible book value per share and dividends, which at the end of September 2025 was 17.0% higher than at the same period of the previous year.
TANGIBLE BOOK VALUE PER SHARE AND DIVIDENDS
(EUROS)
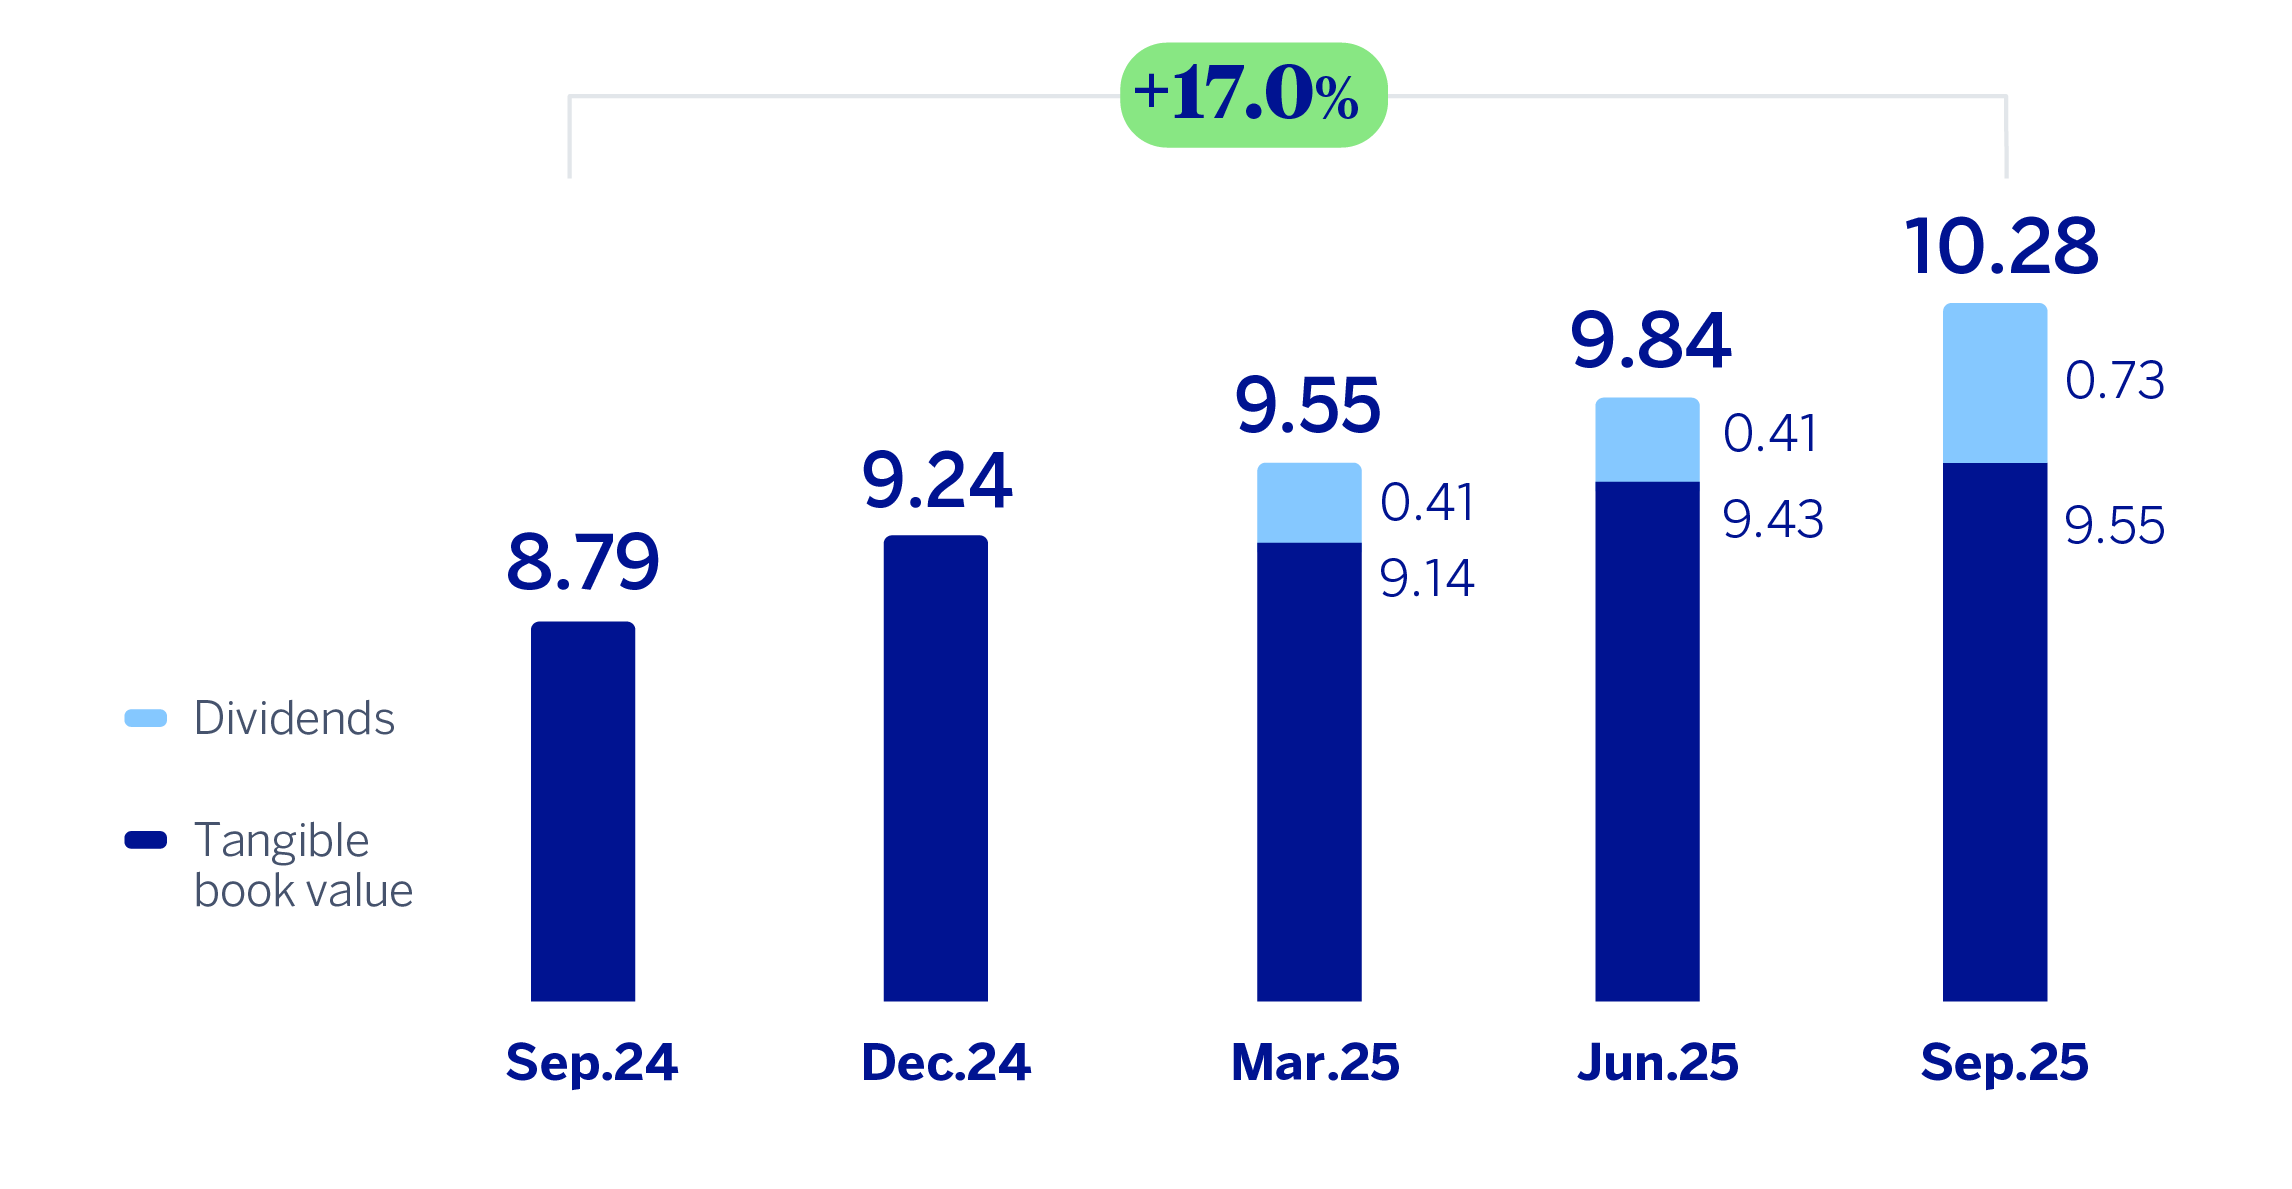
General note: Replenishing dividends paid in the period. For more information, see Alternative Performance Measures at this report.
EARNING (LOSS) PER SHARE
(EUROS)
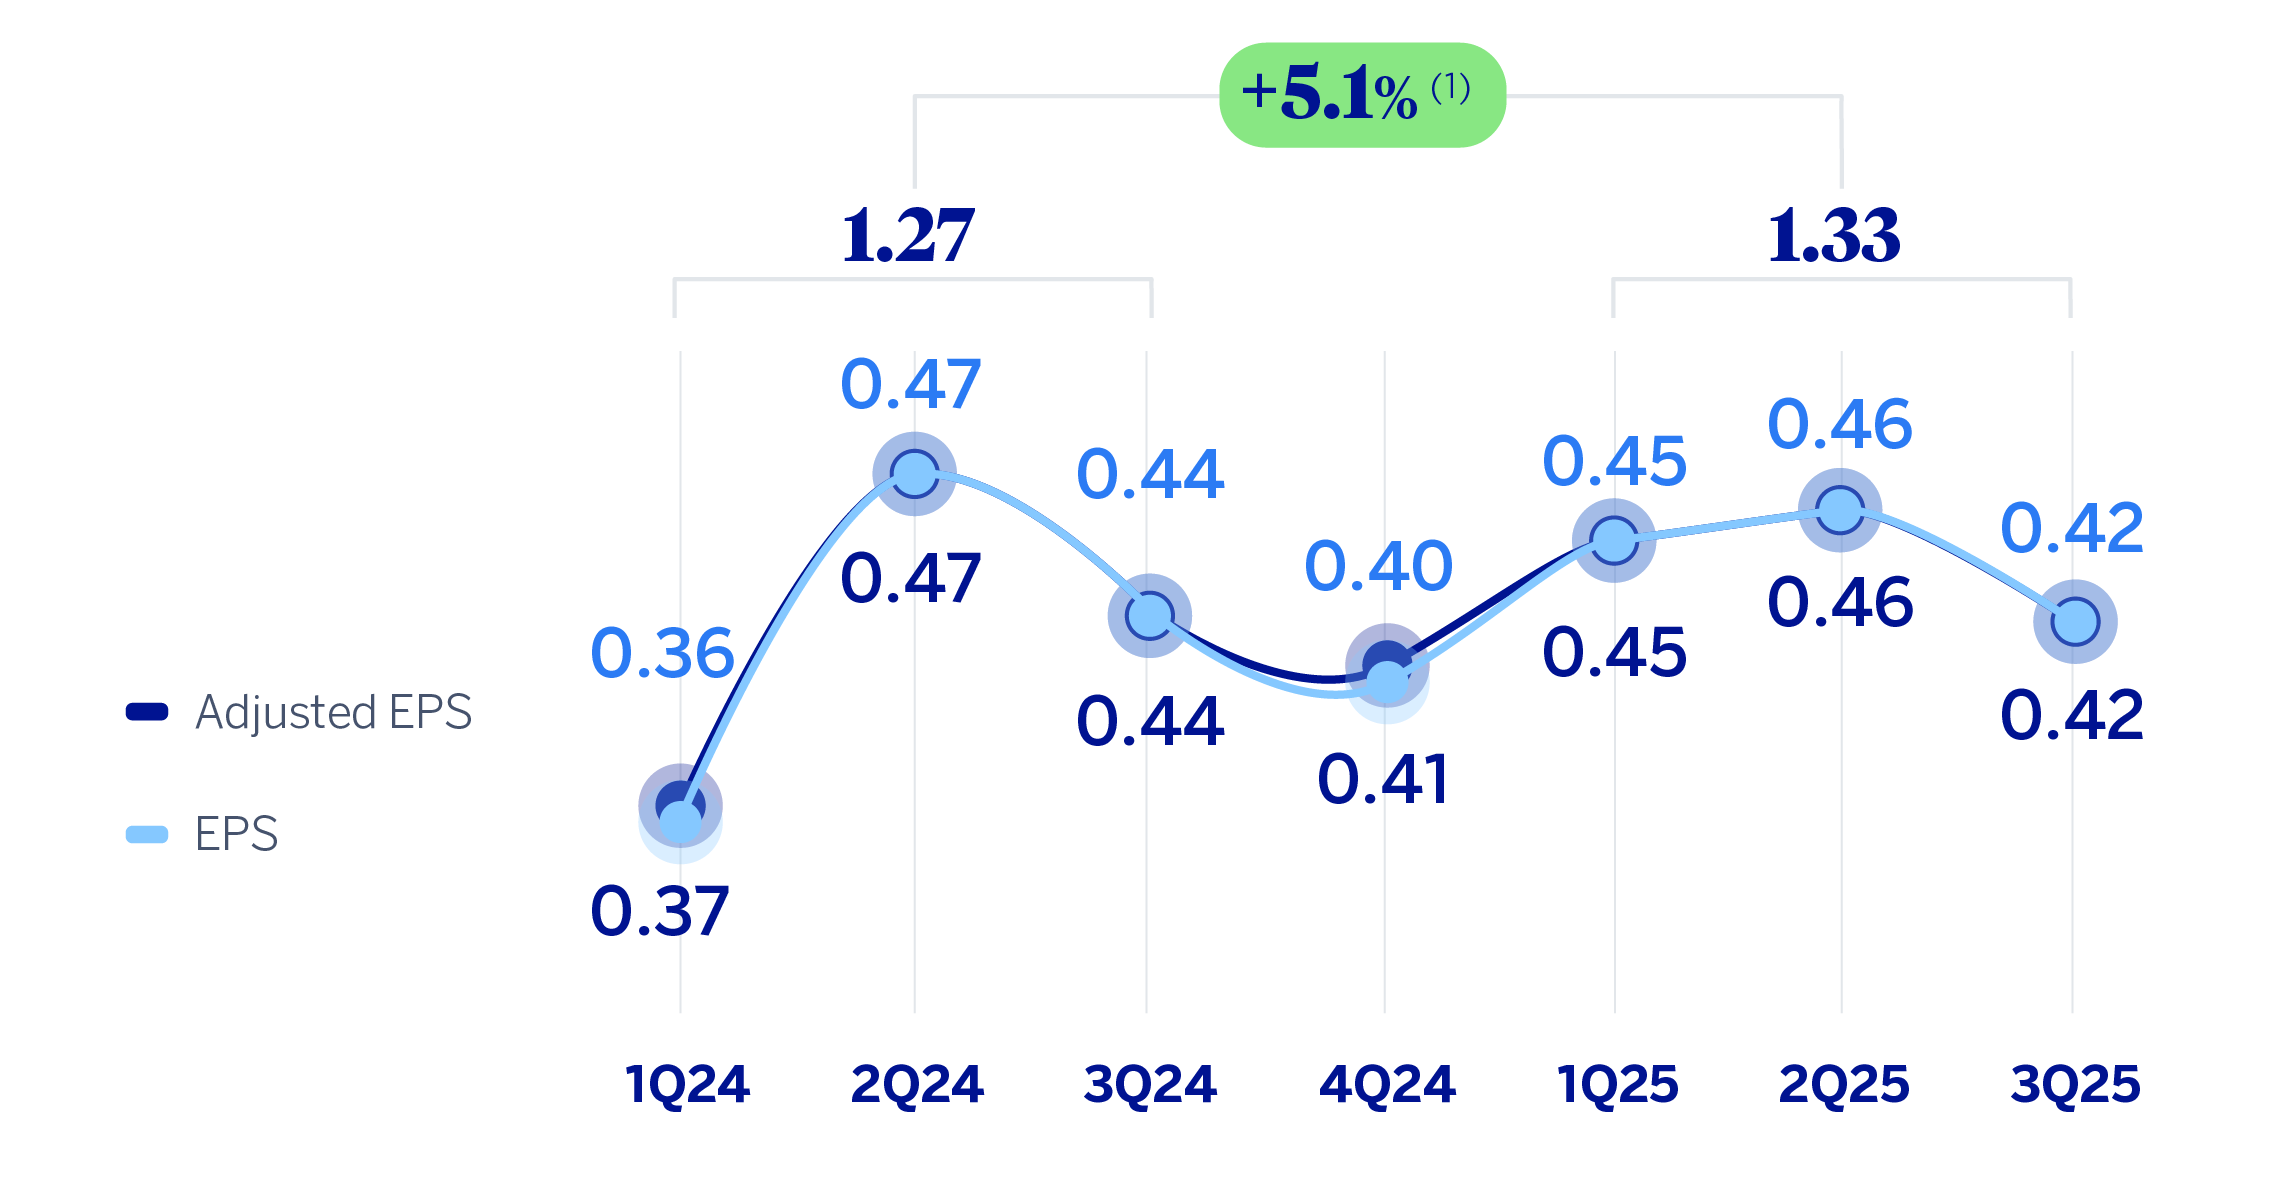
General note: Adjusted by additional Tier 1 instrument remuneration. For more information, see Alternative Performance Measures at this report.
(1) The year-on-year variation of adjusted EPS stands at 4.7%.
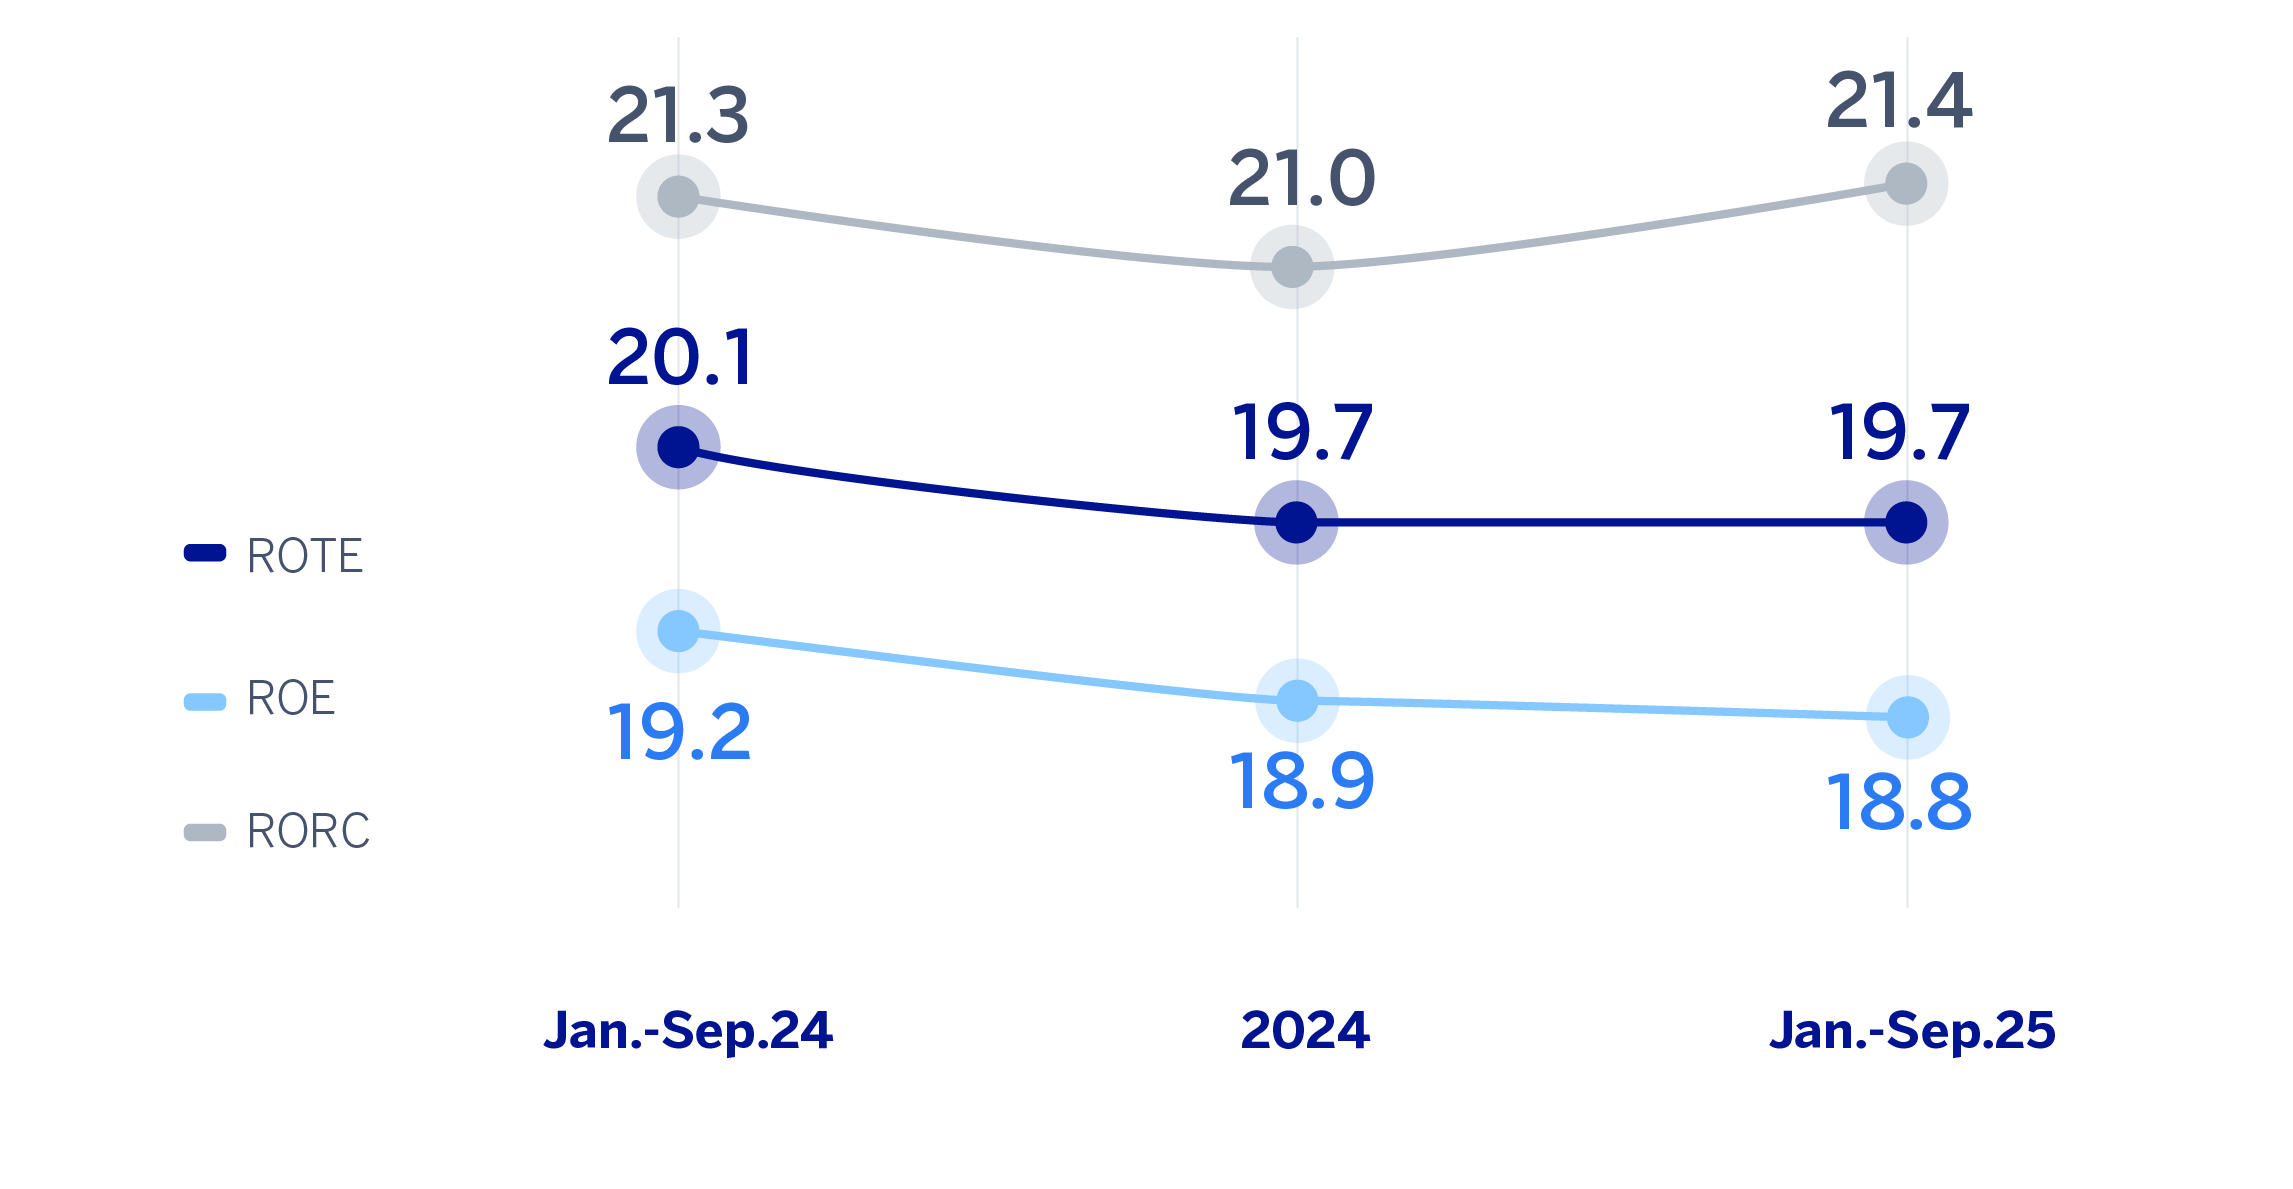
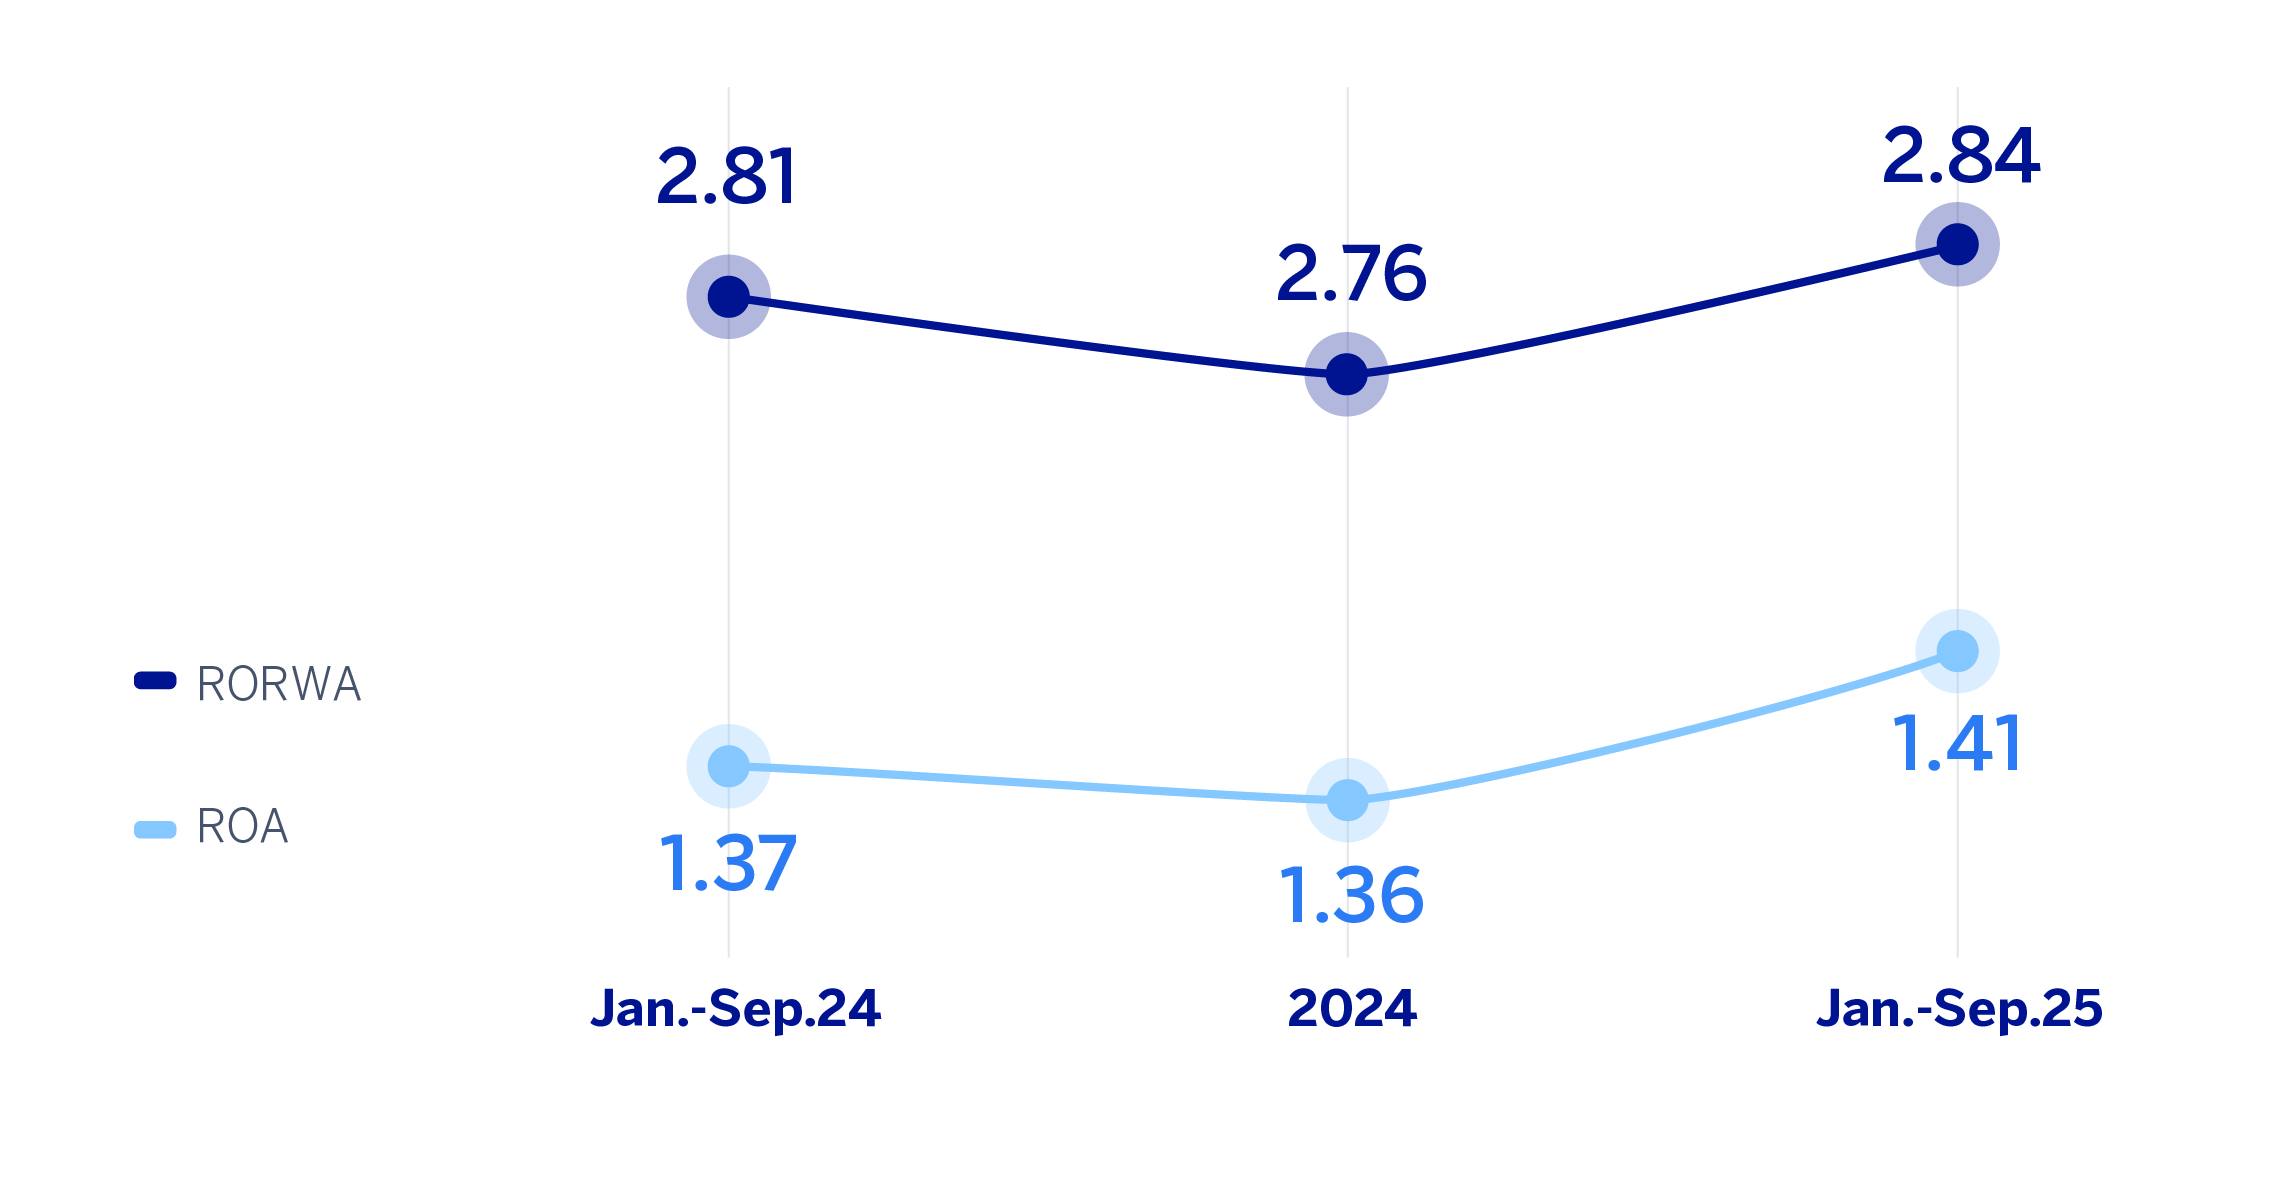
Lastly, the Group’s profitability indicators show BBVA's ability to combine higher growth rates and better profitability ratios in a way that differentiates it from the market.
ROE, ROTE AND RORC (PERCENTAGE)
ROA AND RORWA (PERCENTAGE)
Read legal disclaimer of this report.