
Mexico
Highlights for the period January - September 2025
- Retail lending continues its strong performance
- Favorable evolution of the recurring revenues
- Good performance of the insurance business
- Quarterly net attributable profit remains at high levels and above the previous quarter
BUSINESS ACTIVITY (1)
(VARIATION AT CONSTANT EXCHANGE RATE COMPARED TO 31-12-24)
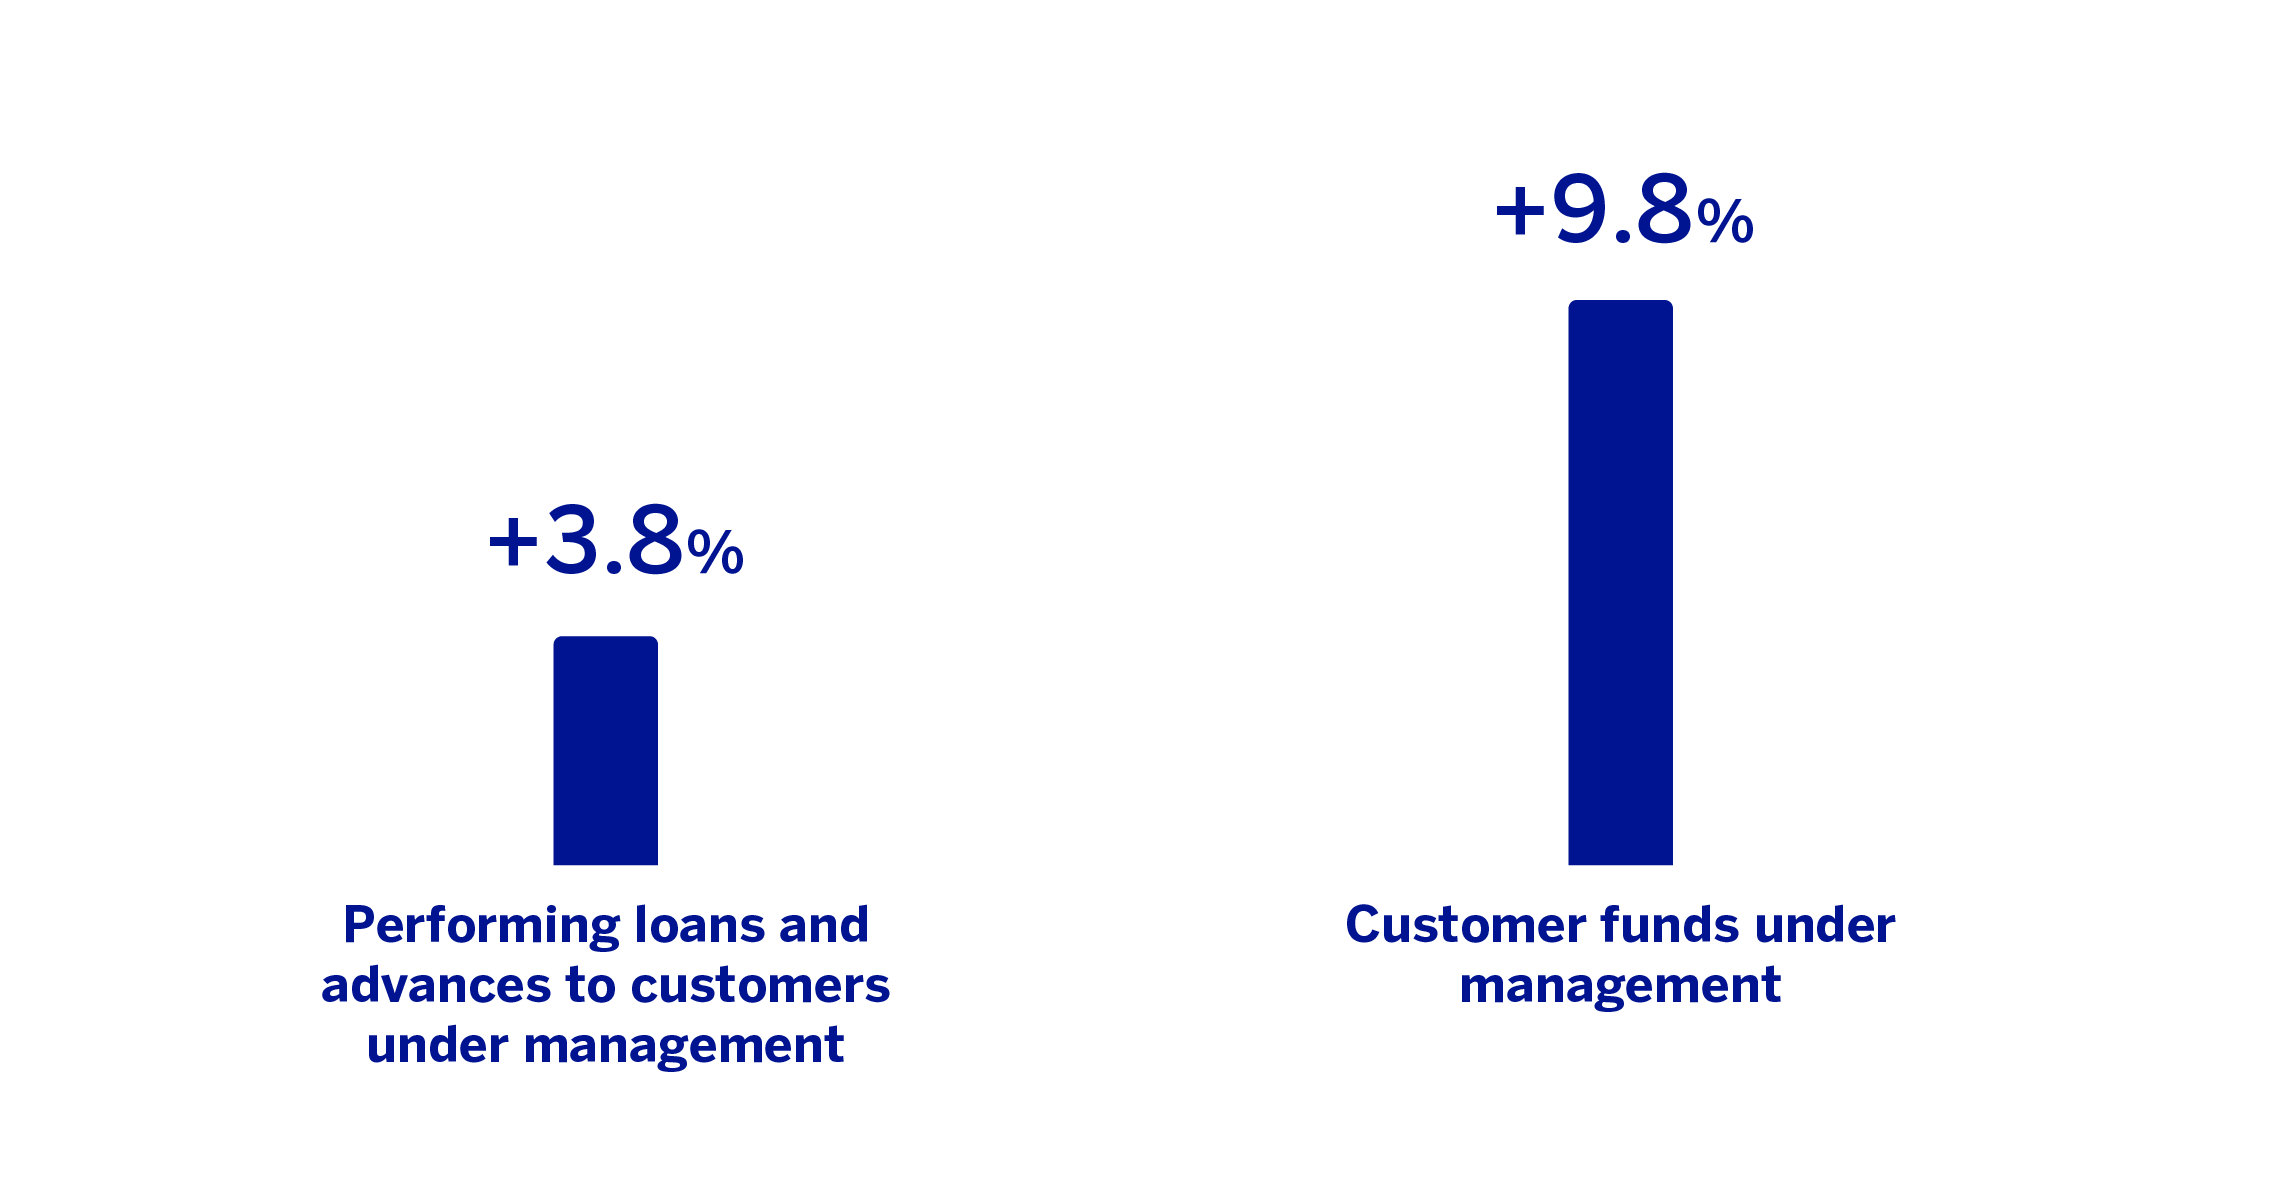
(1) Excluding repos.
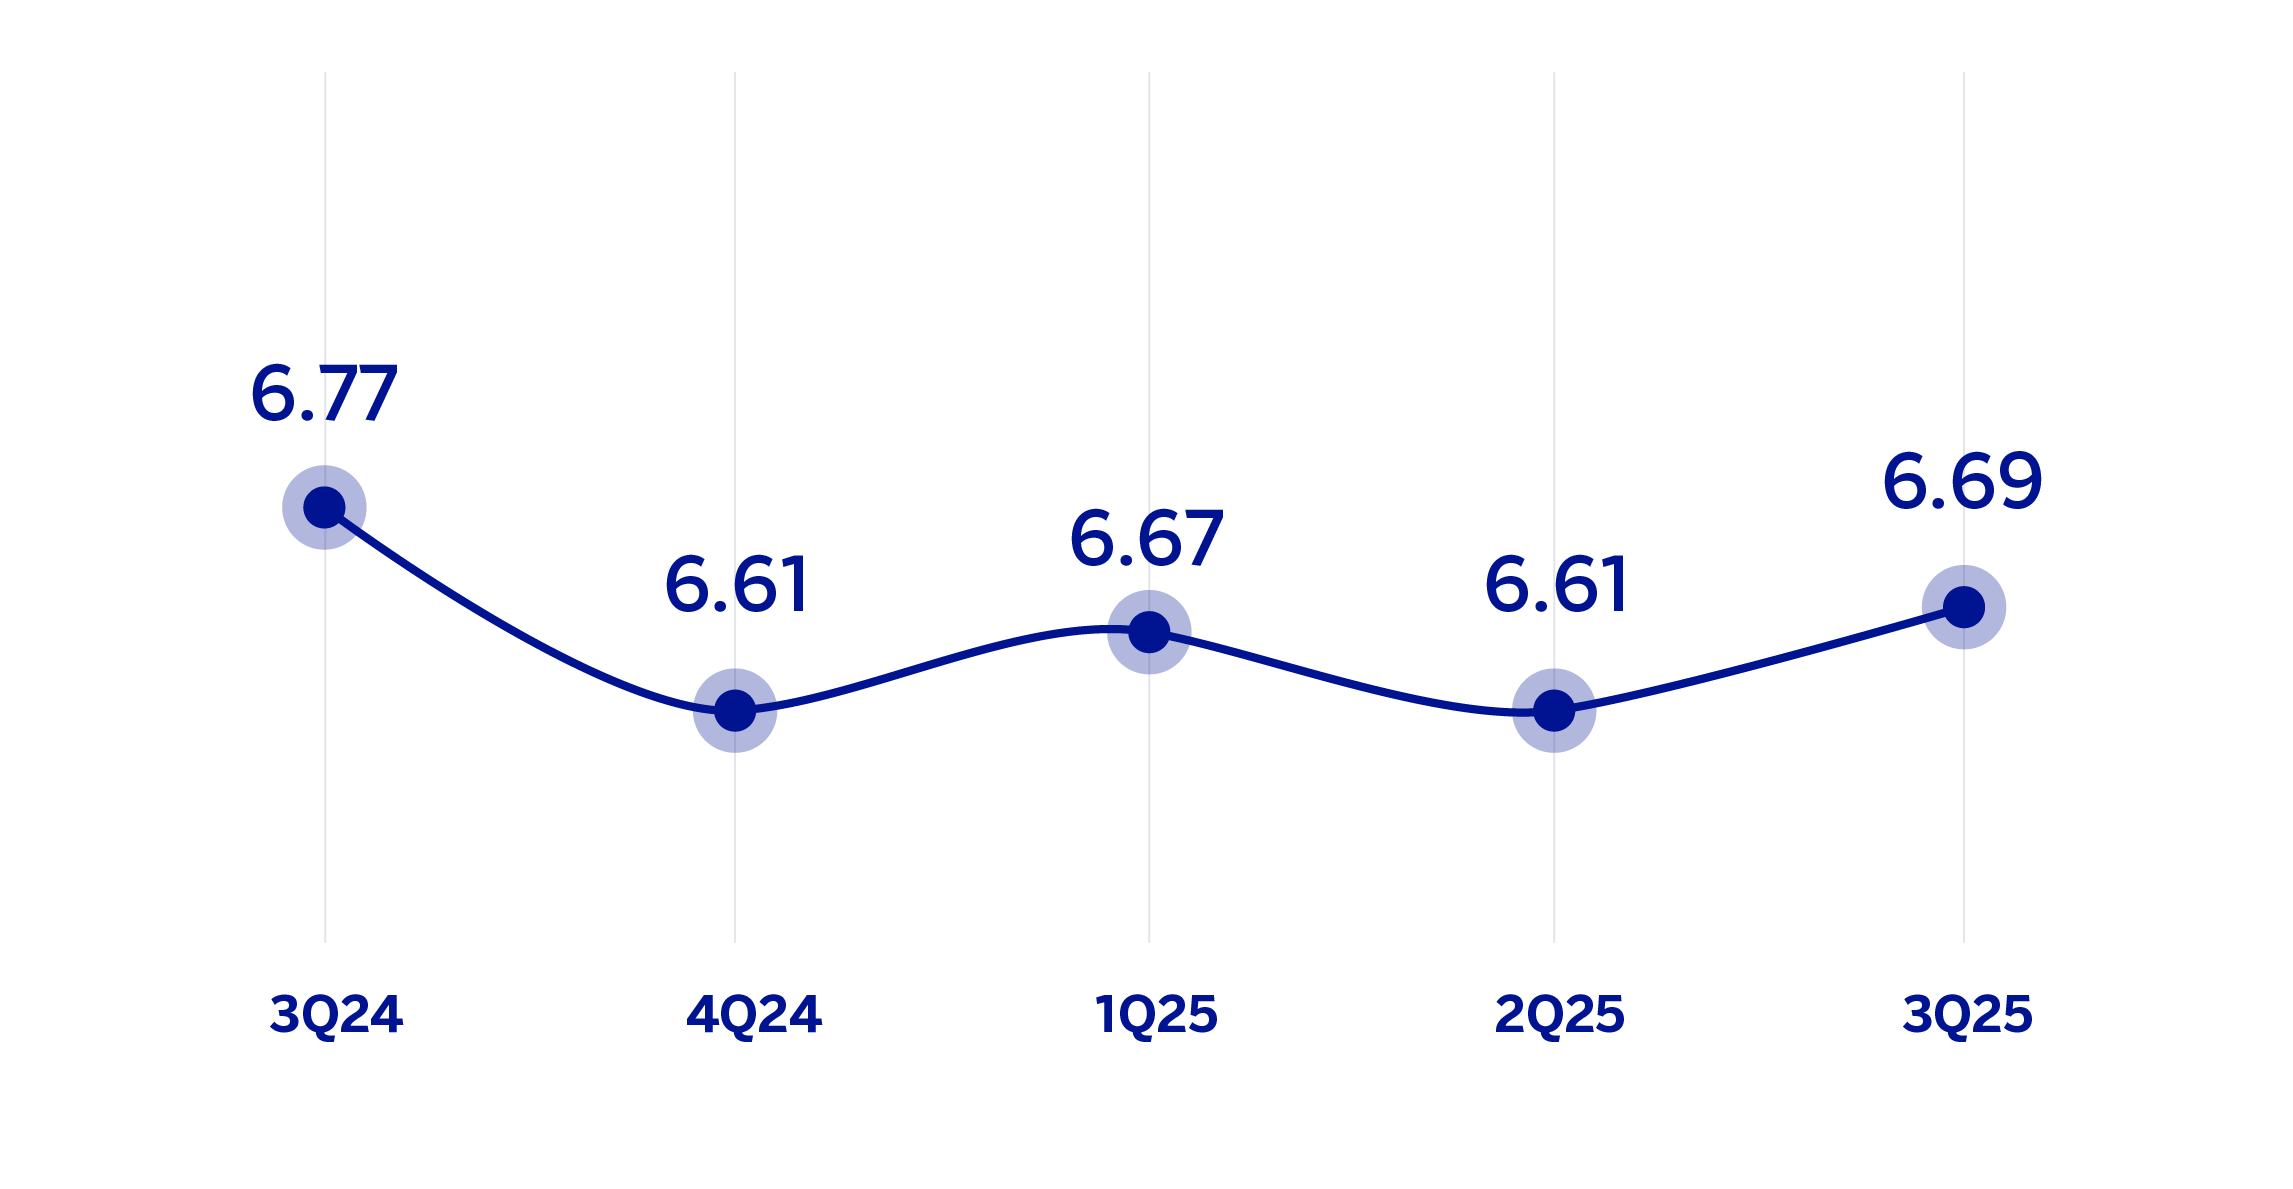
NET INTEREST INCOME / AVERAGE TOTAL ASSETS
(PERCENTAGE AT CONSTANT EXCHANGE RATE)
OPERATING INCOME
(MILLIONS OF EUROS AT CONSTANT EXCHANGE RATE)
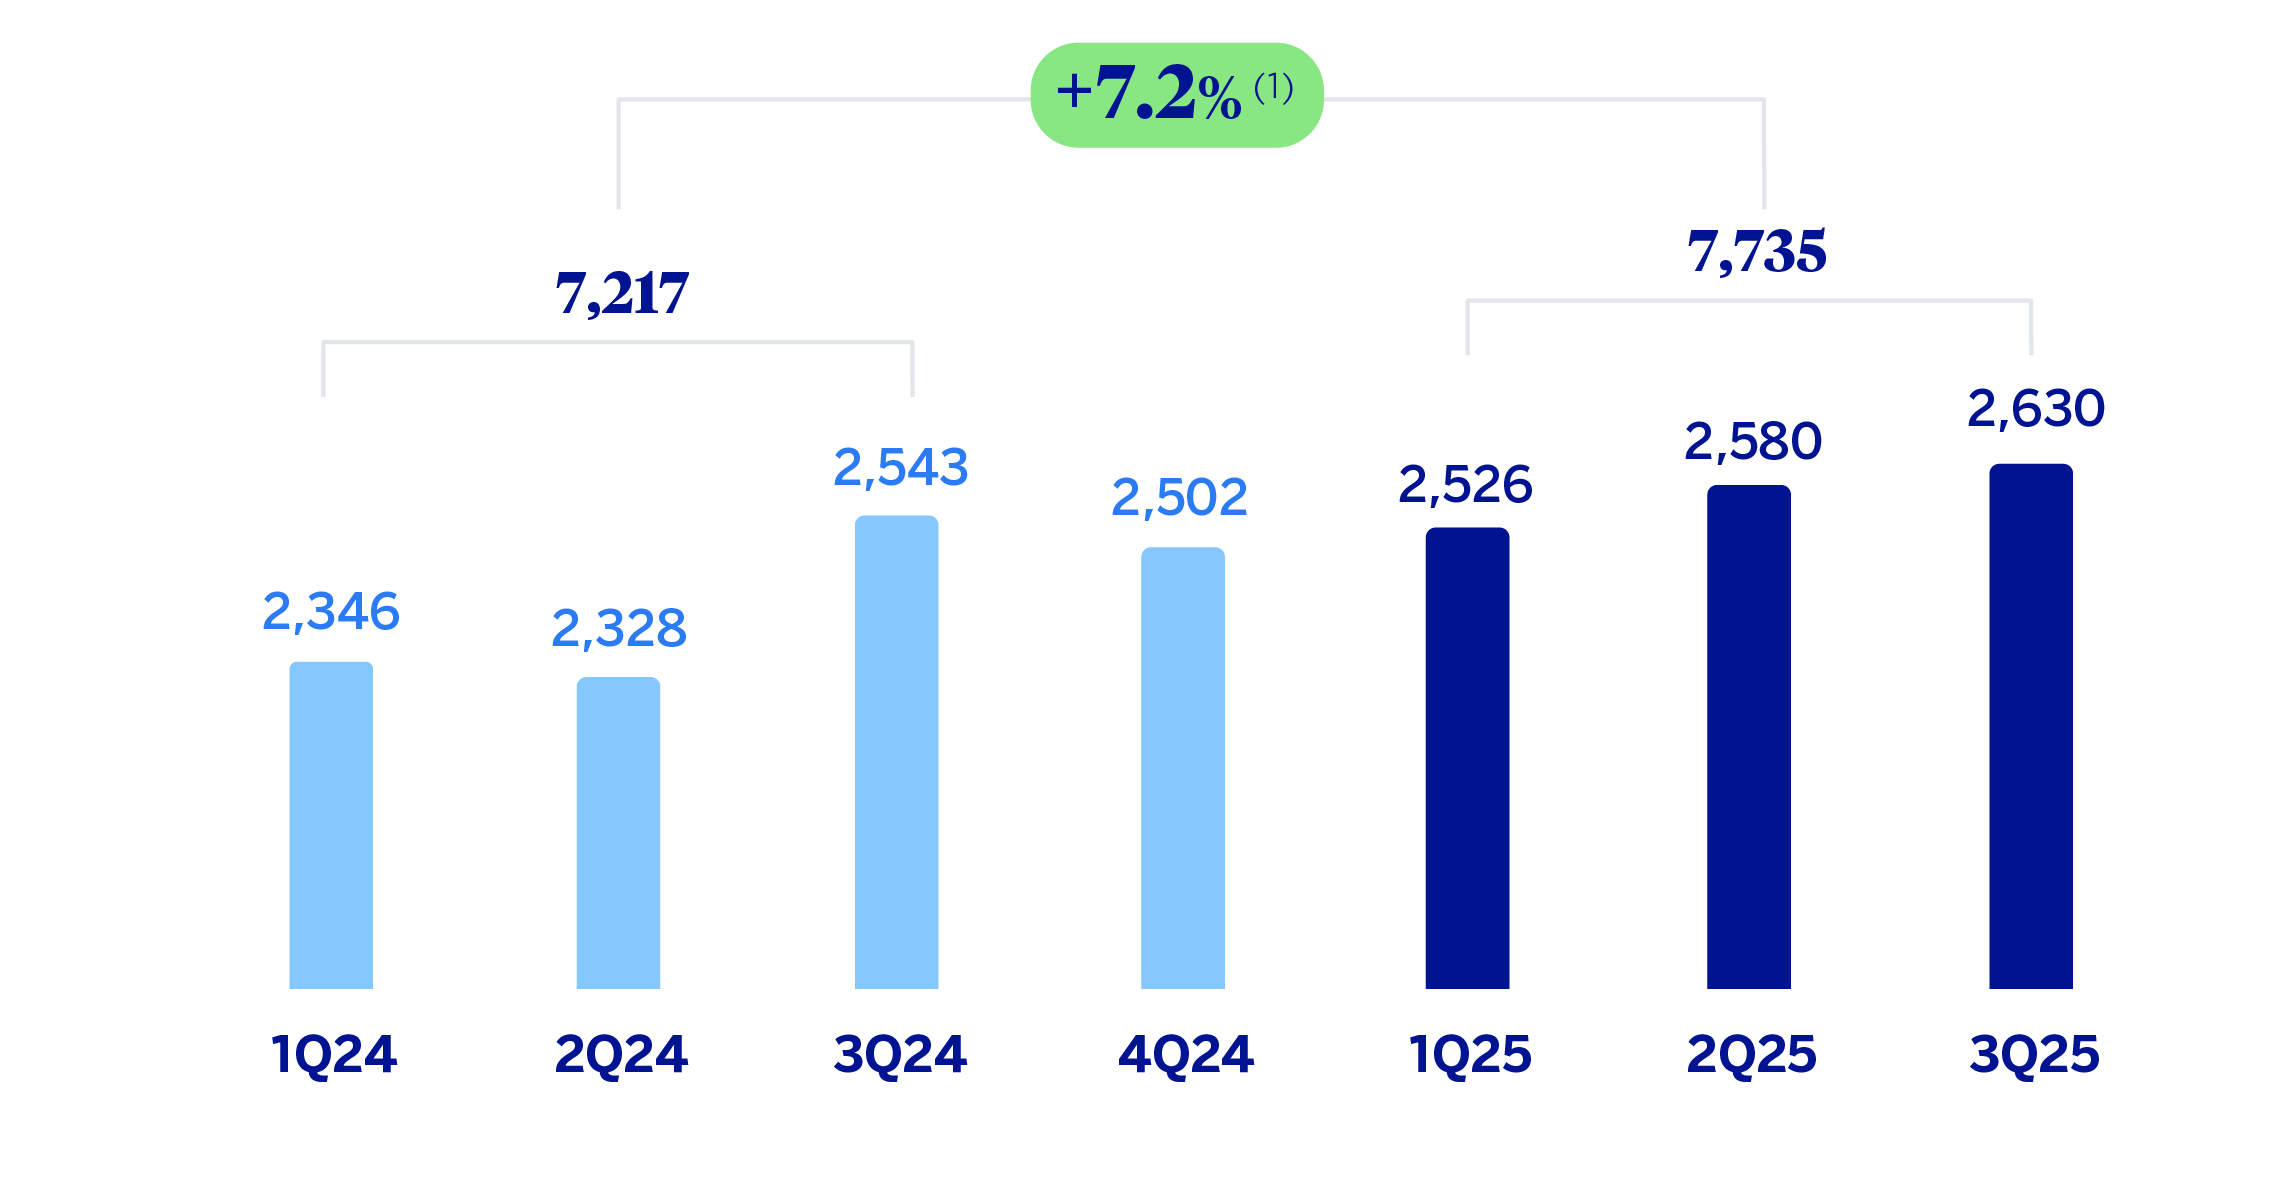
(1) At current exchange rate: -5.2%.
NET ATTRIBUTABLE PROFIT (LOSS)
(MILLIONS OF EUROS AT CONSTANT EXCHANGE RATE)
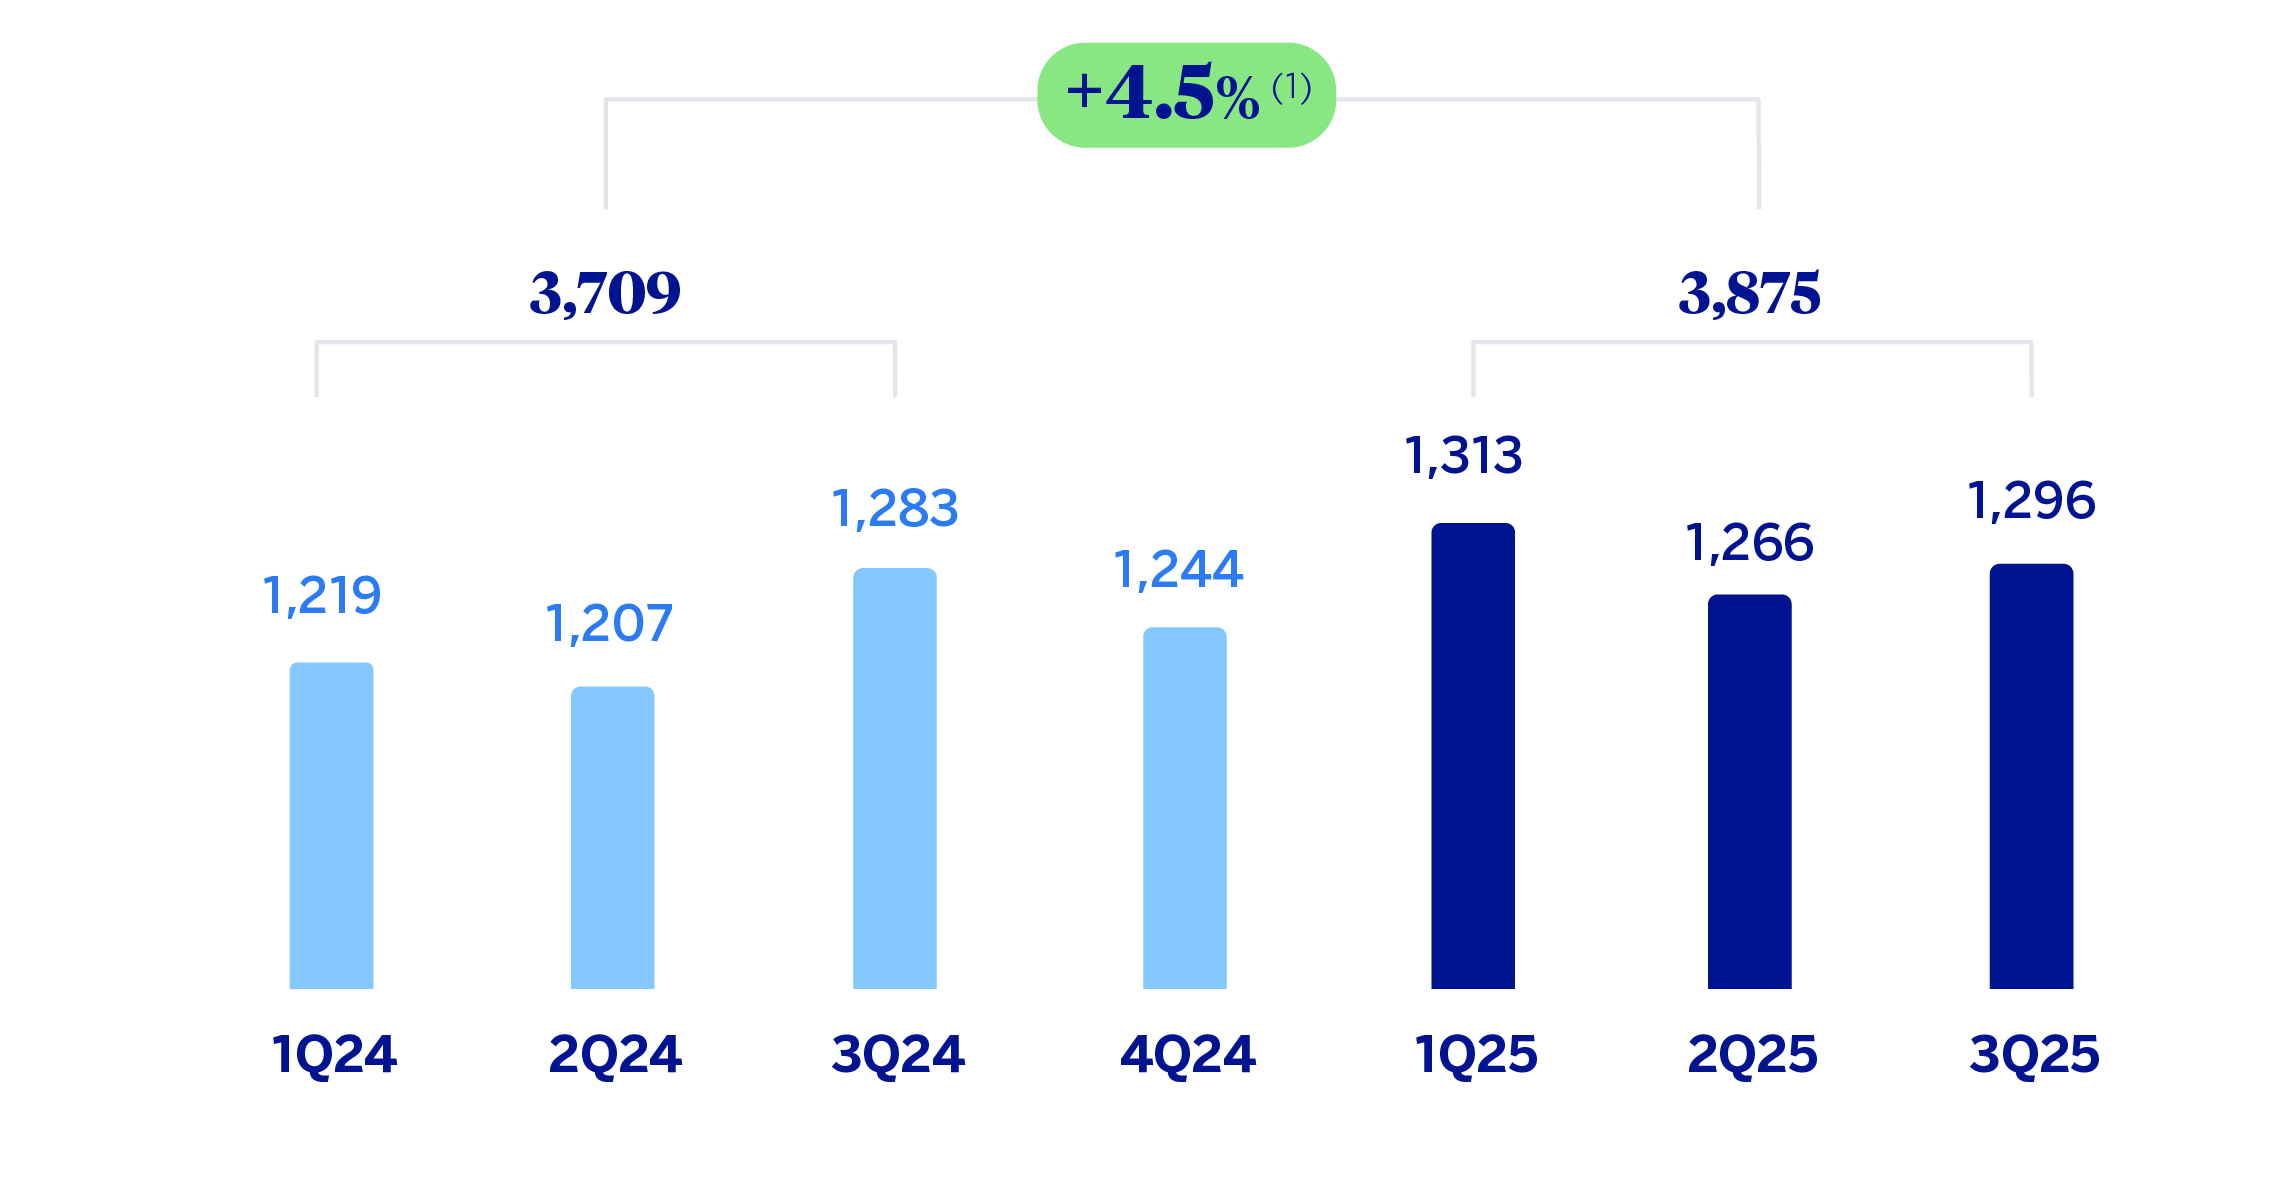
(1) At current exchange rate: -7.6%.
| FINANCIAL STATEMENTS AND RELEVANT BUSINESS INDICATORS (MILLIONS OF EUROS AND PERCENTAGE) | ||||
|---|---|---|---|---|
| Income statement | Jan.-Sep.25 | 𝚫 % | 𝚫 % (1) | Jan.-Sep.24 |
| Net interest income | 8,393 | (4.2) | 8.3 | 8,762 |
| Net fees and commissions | 1,730 | (6.3) | 6.0 | 1,846 |
| Net trading income | 570 | (5.9) | 6.3 | 606 |
| Other operating income and expenses | 430 | 0.9 | 14.0 | 427 |
| Gross income | 11,124 | (4.4) | 8.0 | 11,641 |
| Operating expenses | (3,389) | (2.7) | 10.0 | (3,482) |
| Personnel expenses | (1,592) | (4.5) | 8.0 | (1,666) |
| Other administrative expenses | (1,471) | 1.4 | 14.7 | (1,450) |
| Depreciation | (326) | (10.7) | 0.9 | (365) |
| Operating income | 7,735 | (5.2) | 7.2 | 8,160 |
| Impairment on financial assets not measured at fair value through profit or loss | (2,279) | (3.3) | 9.4 | (2,356) |
| Provisions or reversal of provisions and other results | (69) | 78.9 | 102.2 | (39) |
| Profit (loss) before tax | 5,387 | (6.6) | 5.6 | 5,765 |
| Income tax | (1,511) | (3.8) | 8.7 | (1,571) |
| Profit (loss) for the period | 3,876 | (7.6) | 4.5 | 4,194 |
| Non-controlling interests | (1) | (7.5) | 4.5 | (1) |
| Net attributable profit (loss) | 3,875 | (7.6) | 4.5 | 4,193 |
| Balance sheets | 30-09-25 | 𝚫 % | 𝚫 % (1) | 31-12-24 |
| Cash, cash balances at central banks and other demand deposits | 12,326 | (1.9) | (2.0) | 12,564 |
| Financial assets designated at fair value | 54,644 | 0.2 | 0.1 | 54,547 |
| Of which: Loans and advances | 3,575 | 71.2 | 71.1 | 2,088 |
| Financial assets at amortized cost | 98,847 | 4.5 | 4.4 | 94,595 |
| Of which: Loans and advances to customers | 92,147 | 3.9 | 3.8 | 88,725 |
| Tangible assets | 2,006 | (1.6) | (1.7) | 2,038 |
| Other assets | 4,721 | (0.1) | (0.2) | 4,726 |
| Total assets/liabilities and equity | 172,544 | 2.4 | 2.3 | 168,470 |
| Financial liabilities held for trading and designated at fair value through profit or loss | 30,432 | (1.5) | (1.6) | 30,885 |
| Deposits from central banks and credit institutions | 6,928 | (24.3) | (24.3) | 9,149 |
| Deposits from customers | 87,554 | 3.1 | 3.0 | 84,949 |
| Debt certificates | 11,542 | 7.7 | 7.6 | 10,717 |
| Other liabilities | 23,945 | 13.8 | 13.7 | 21,043 |
| Regulatory capital allocated | 12,144 | 3.5 | 3.5 | 11,727 |
| Relevant business indicators | 30-09-25 | 𝚫 % | 𝚫 % (1) | 31-12-24 |
| Performing loans and advances to customers under management (2) | 92,474 | 3.9 | 3.8 | 89,044 |
| Non-performing loans | 2,722 | 8.1 | 8.1 | 2,517 |
| Customer deposits under management (1) | 87,552 | 4.3 | 4.2 | 83,962 |
| Off-balance sheet funds (3) | 67,593 | 18.1 | 18.0 | 57,253 |
| Risk-weighted assets | 91,560 | (1.5) | (1.6) | 92,925 |
| RORWA (1)(4) | 5.73 | 5.77 | ||
| Efficiency ratio (%) | 30.5 | 30.3 | ||
| NPL ratio (%) | 2.8 | 2.7 | ||
| NPL coverage ratio (%) | 123 | 121 | ||
| Cost of risk (%) | 3.27 | 3.39 | ||
| (1) At constant exchange rate. (2) Excluding repos. (3) Includes mutual funds, customer portfolios and other off-balance sheet funds. (4) For more information on the calculation methodology, as well as the calculation of the metric at the consolidated Group level, see Alternative Performance Measures at this report. |
||||
Macro and industry trends
Economic activity accelerated during the first half of 2025 supported by foreign demand. The resilience of the exports and the sharp decline of the imports, in an environment of weak domestic demand, explain the higher-than-expected GDP growth until June. Going forward, uncertainty over domestic reforms, the impact of the American trade policy and low real wage growth will continue to limit the increase of private expenditure and aggregated activity. All in all, BBVA Research has revised its growth forecast for 2025 upward from -0.4% to 0.7% and expects it to remain around 1.0% in 2026. This growth environment, along with the moderation of inflation, which reached 3.8% in September and could close 2025 at that level, which provides continuity to the path of interest rate cuts. After the rate cut to 7.5% in September, the official rate could end the year at 7% and reach 6.5% in the first months of 2026.
Regarding the banking system, with data at the end of August 2025, the volume of credit to the non-financial private sector increased by 8.8% year-on-year, with growth in all the main portfolios: consumer loans (+13.2%), mortgage loans (+5.6%) and corporate loans (+8.1%). The growth of total deposits (demand and time deposits) remained slightly below than the credit growth (+7.6% year-on-year in August 2025), with similar evolution in time deposits (+8.8%) and in demand deposits (+6.9%). The system's NPL ratio worsened slightly to 2.36% in August 2025 and the capital indicators remained comfortable.
Unless expressly stated otherwise, all the comments below on rates of variation, for both activity and results, will be given at constant exchange rate. These rates, together with variations at current exchange rates, can be found in the attached tables of financial statements and relevant business indicators.
Activity
The most relevant aspects related to the area's activity during the first nine months of 2025 were:
Lending activity (performing loans under management) grew by 3.8% during the first nine months of 2025, supported by the evolution of the retail portfolio, which grew by 8.9%, with a favorable performance of all the portfolios, where the dynamism of consumer loans stands out, registering an increase of 12.1%, and also SMEs with an increase of 13.5% since December 2024. As a result of this evolution, the loan portfolio continued showing a high degree of diversification, with 46% of the total portfolio corresponding to wholesale credit and the remaining 54% to retail credit.
Customer deposits under management grew by 9.8% in the first nine months of 2025, with a notable growth in off-balance sheet funds of 18.0% and 4.2% in customer deposits.
The most relevant aspects related to the area's activity in the third quarter of 2025 were:
During the quarter, lending activity grew by 1.1%, driven by the dynamism of all products in the retail portfolio, which increased by 3.1%, especially consumer loans (+4.5%).
With regard to the asset quality indicators, the NPL ratio stood at 2.8% at the end of September 2025, which represents an increase of 11 basis points compared to the end of June, mainly explained by the growth of non-performing loans in the retail portfolio. On the other hand, the NPL coverage ratio was 123% at the end of September 2025, which represents a decrease compared to the end of June, mainly explained by the aforementioned higher volume of non-performing loans.
Customer deposits under management were 2.7% above the June balances, originated in the evolution of off-balance sheet funds (+6.7%). Deposits from customers remained stable during the quarter (-0.2%), where strategies to attract time deposits partially offset the reduction in demand deposits.
Results
BBVA Mexico achieved a cumulative net attributable profit of €3,875m at the end of September 2025, which represents a year-on-year growth of 4.5%, explained mainly by the favorable evolution of the net interest income.
The most relevant aspects of the year-on-year changes in the income statement as of the end of September 2025 are summarized below:
Net interest income increased by 8.3%, driven by higher retail lending volumes and lower cost of funds, in an environment of falling reference rates, further boosted by wholesale issuances carried out by BBVA Mexico.
Net fees and commissions grew by 6.0%, mainly as a result of the higher revenues from asset management, mostly investment and pension funds, related to growth in activity.
The contribution from NTI increased by 6.3% mainly due to the good performance of the ALCO portfolio.
The other operating income and expenses line item recorded an increase of 14.0%, supported by the strong performance of the insurance business, which more than offset the increase in contributions to the deposit guarantee fund.
Operating expenses grew by 10.0%, due to both higher general and personnel expenses, where the increase in technology investment expenses stood out.
Loan-loss provisions increased by 9.4%, as a result of the growth in activity, with higher requirements for the retail portfolio. Thus, the cumulative cost of risk at the end of September 2025 increased to 3.27%, which is an increase of 3 basis points compared to that recorded at the end of June, although it remains 12 basis points below the end of 2024.
In the quarter, and excluding the effect of exchange rate fluctuation, BBVA Mexico generated net attributable profit of €1,296m, which represents a +2.4% variation with respect to the previous quarter supported by the favorable performance of net interest income (benefited from lower financing costs) and fees, as well as a lower loan-loss provisions.
Read legal disclaimer of this report.