
South America
Highlights
- Growth in lending activity and customer funds
- Significantly lower year-on-year hyperinflation adjustment in Argentina
- Decrease in loan loss provisions and improvement of risk indicators
- Increase in the area's half-year attributable profit
BUSINESS ACTIVITY (1)
(VARIATION AT CONSTANT EXCHANGE RATES COMPARED TO 31-12-24)
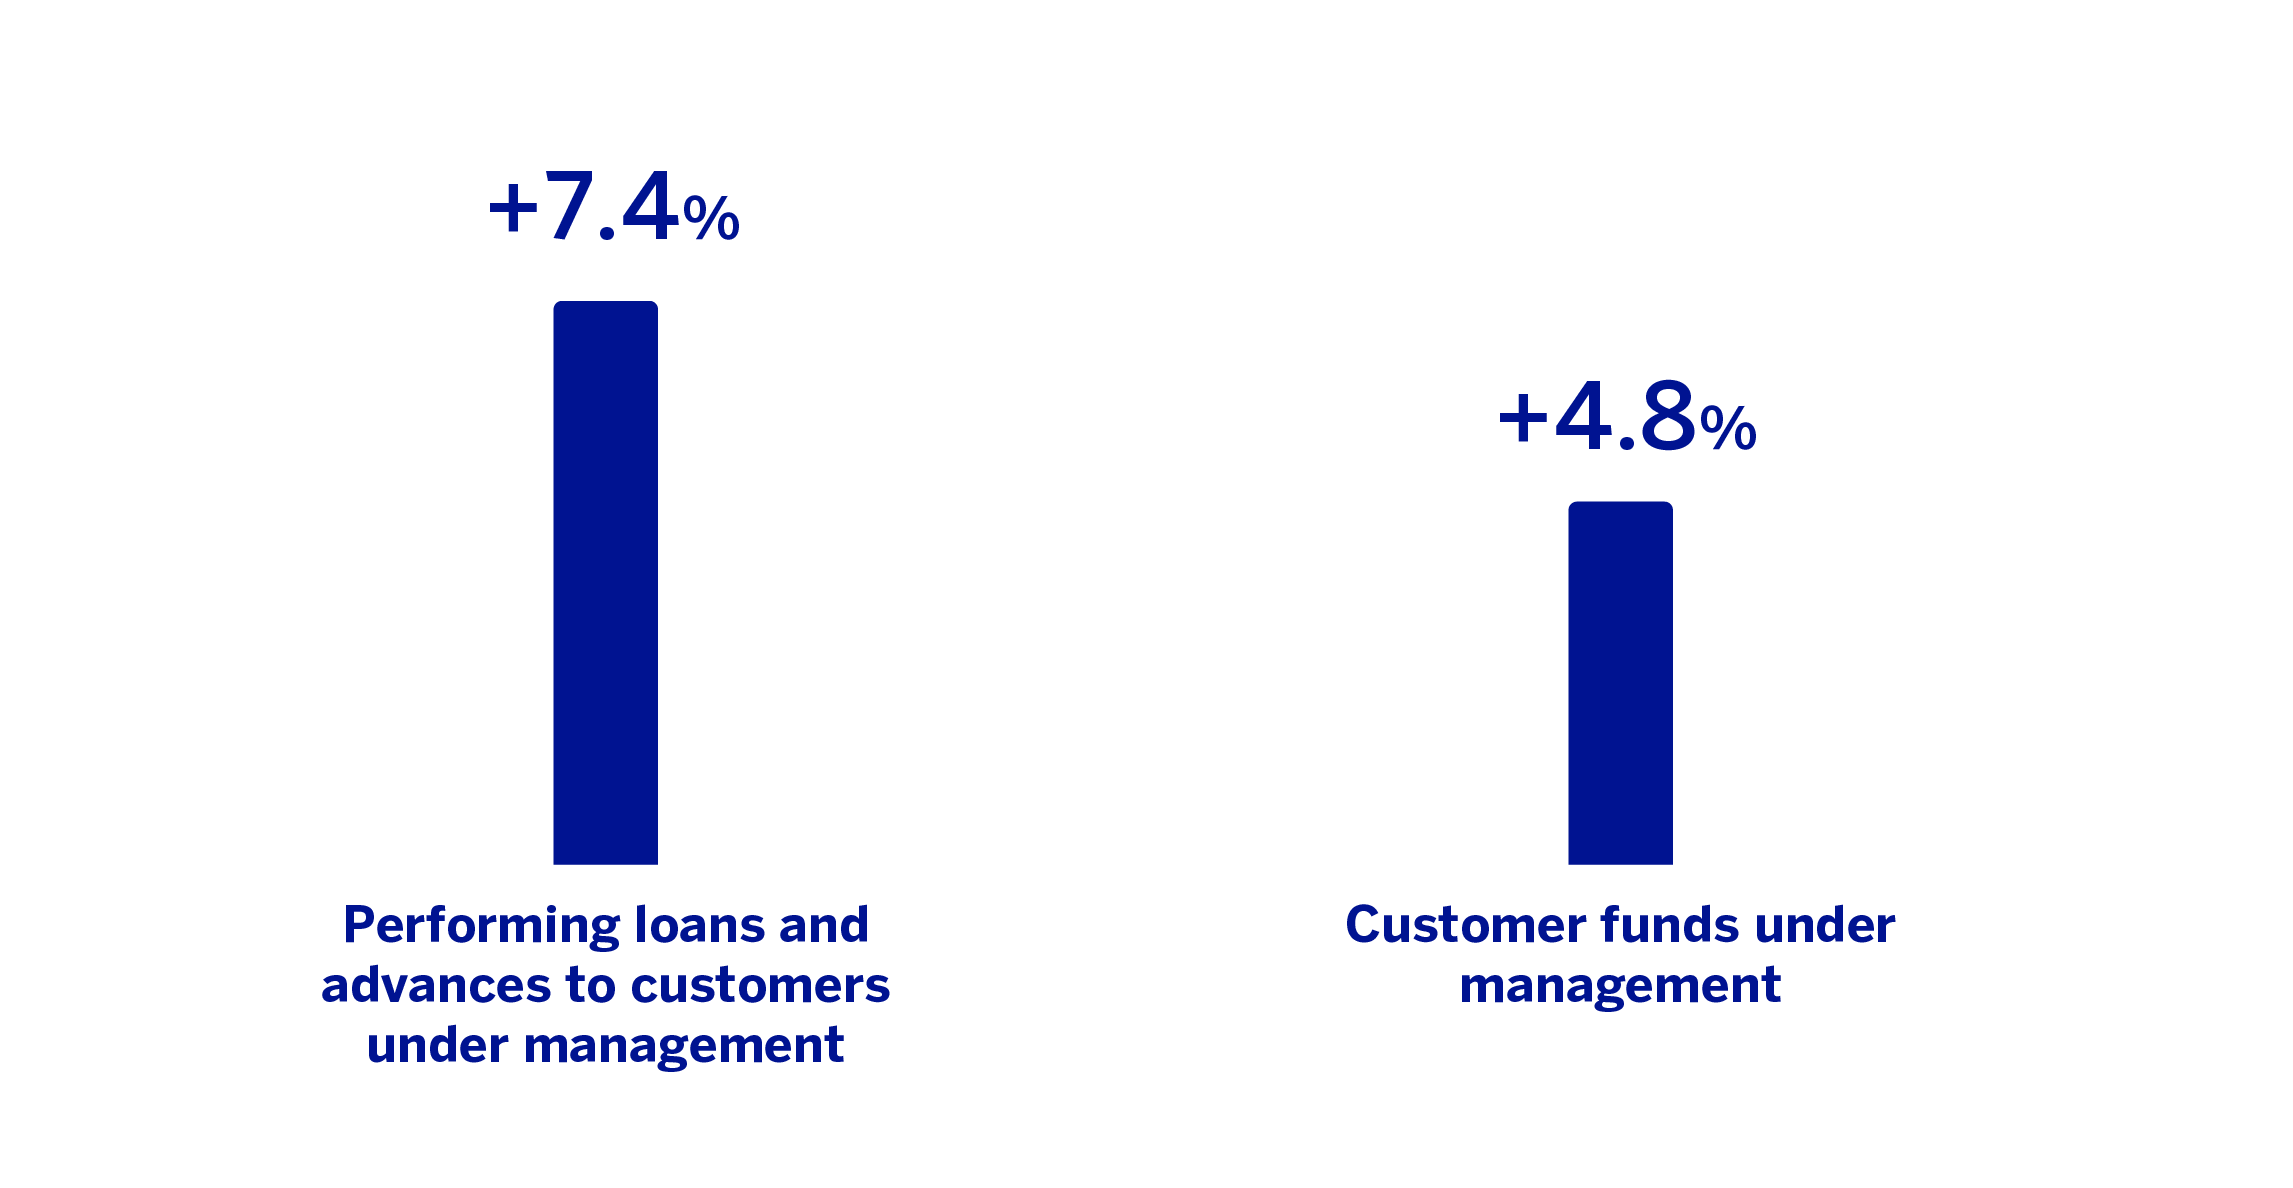
(1) Excluding repos.
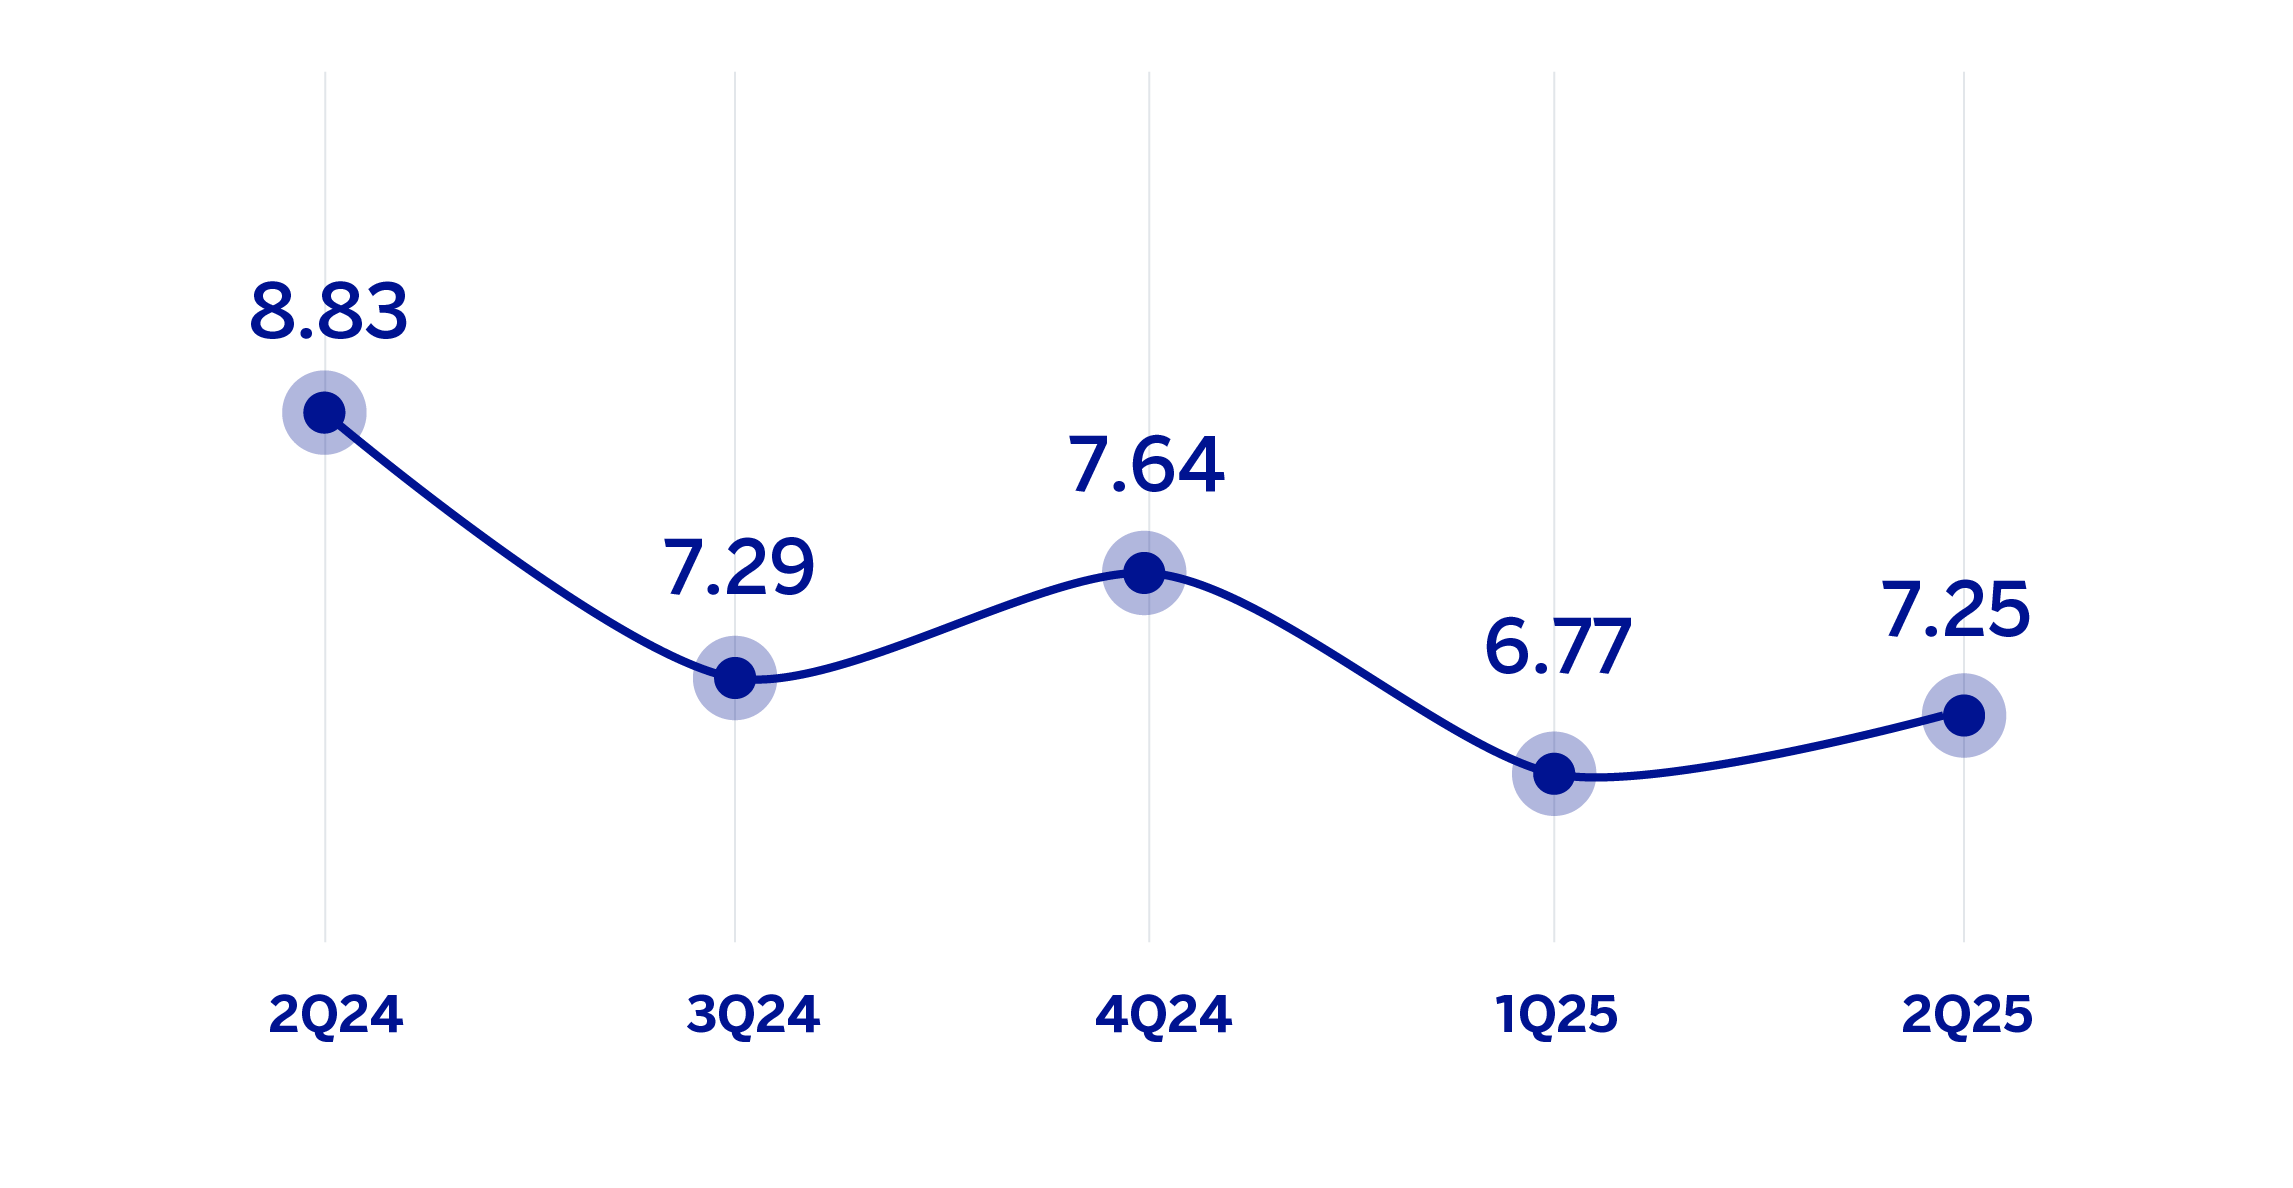
NET INTEREST INCOME / AVERAGE TOTAL ASSETS
(PERCENTAGE AT CONSTANT EXCHANGE RATES)
OPERATING INCOME
(MILLIONS OF EUROS AT CURRENT EXCHANGE RATES)
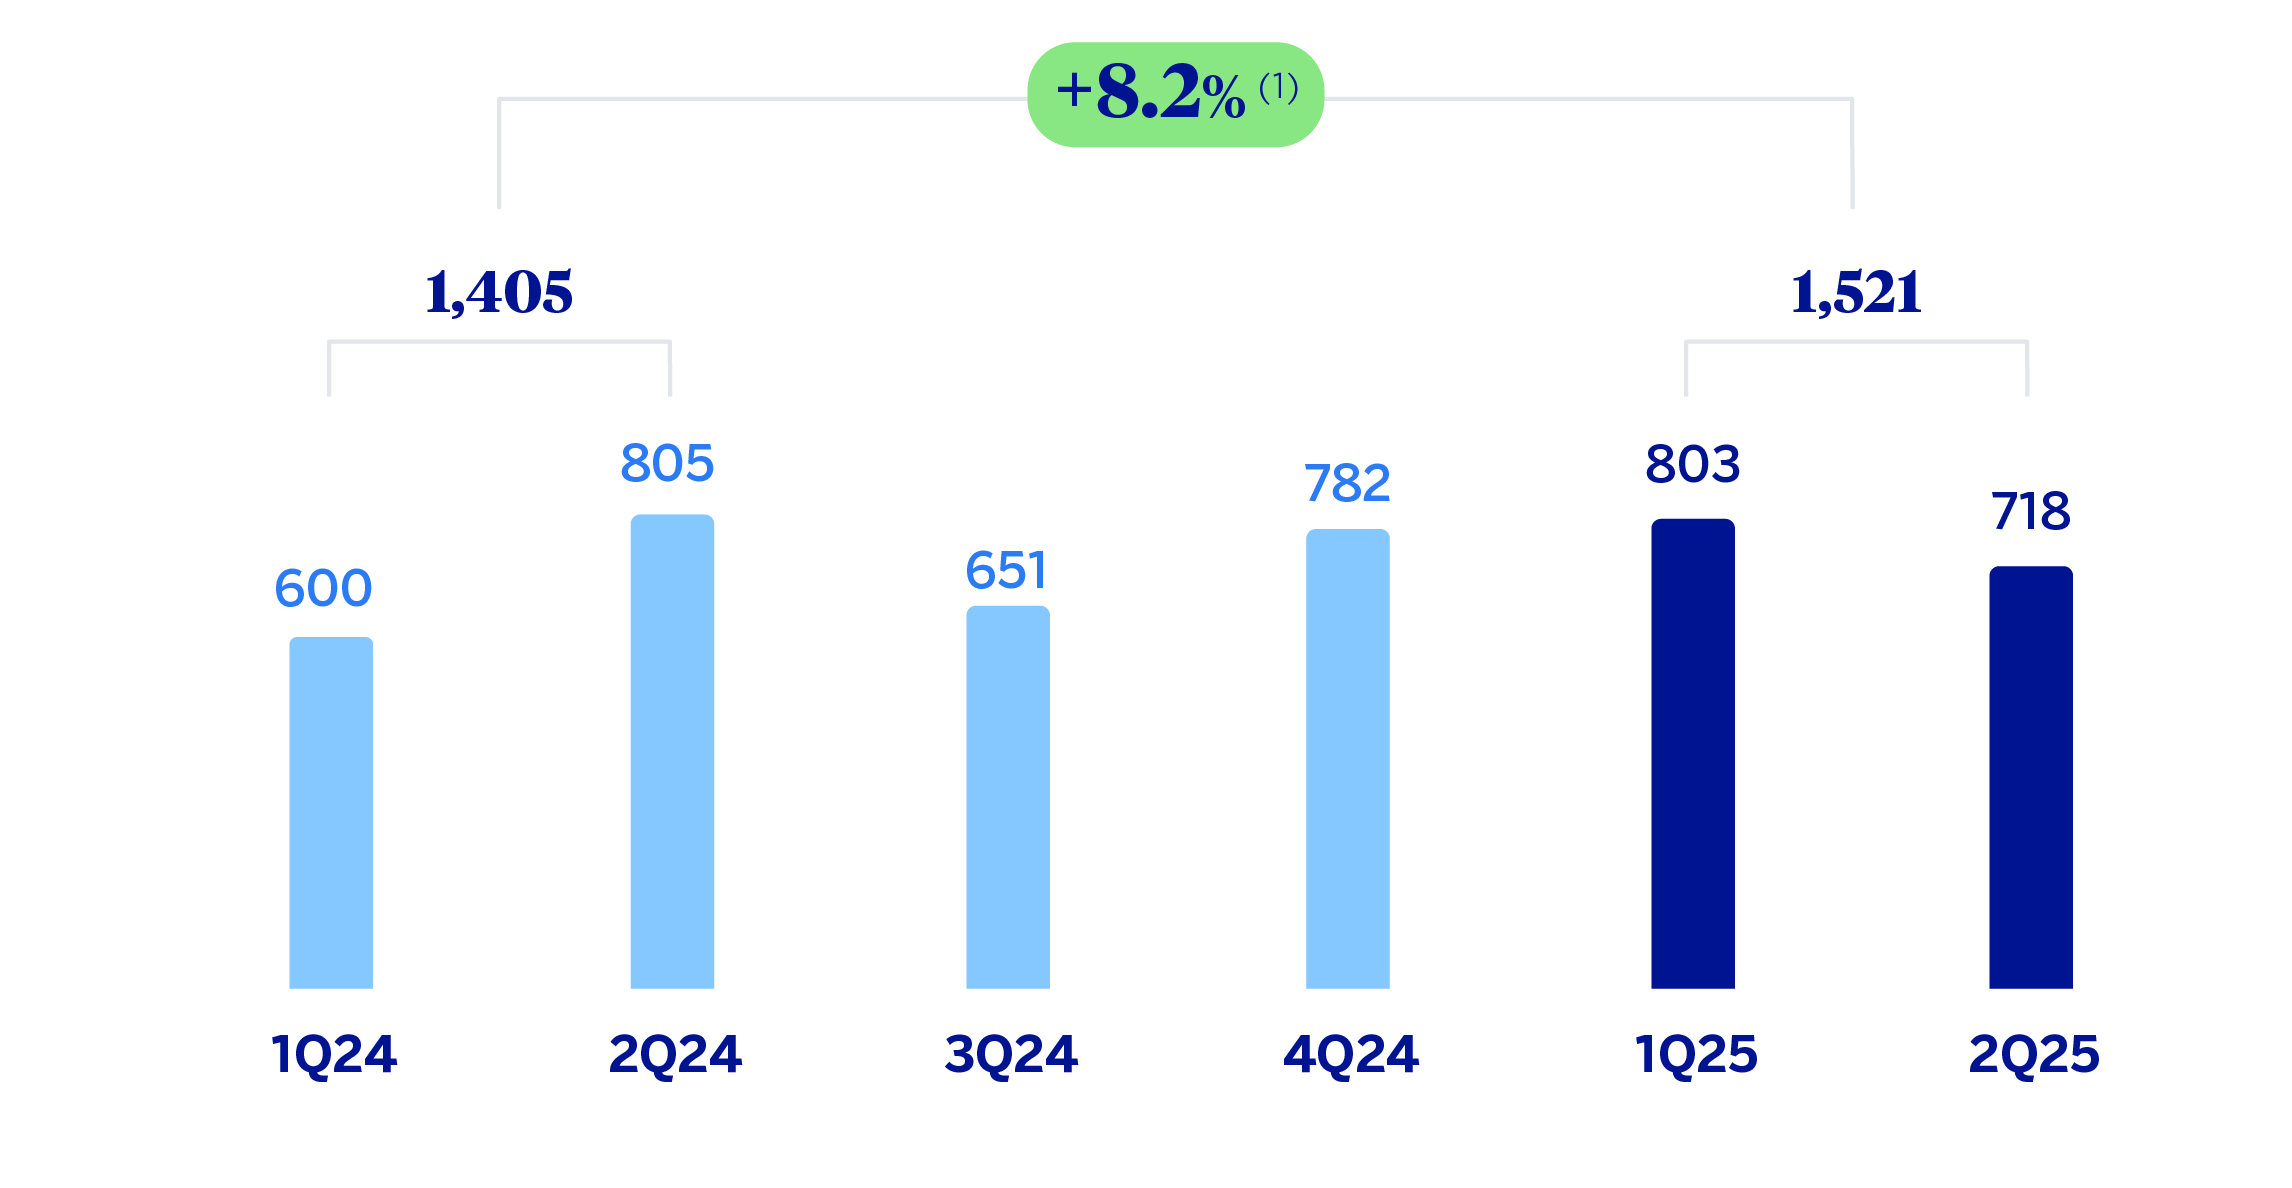
(1) At constant exchange rates: +45.3%.
NET ATTRIBUTABLE PROFIT (LOSS)
(MILLIONS OF EUROS AT CURRENT EXCHANGE RATES)
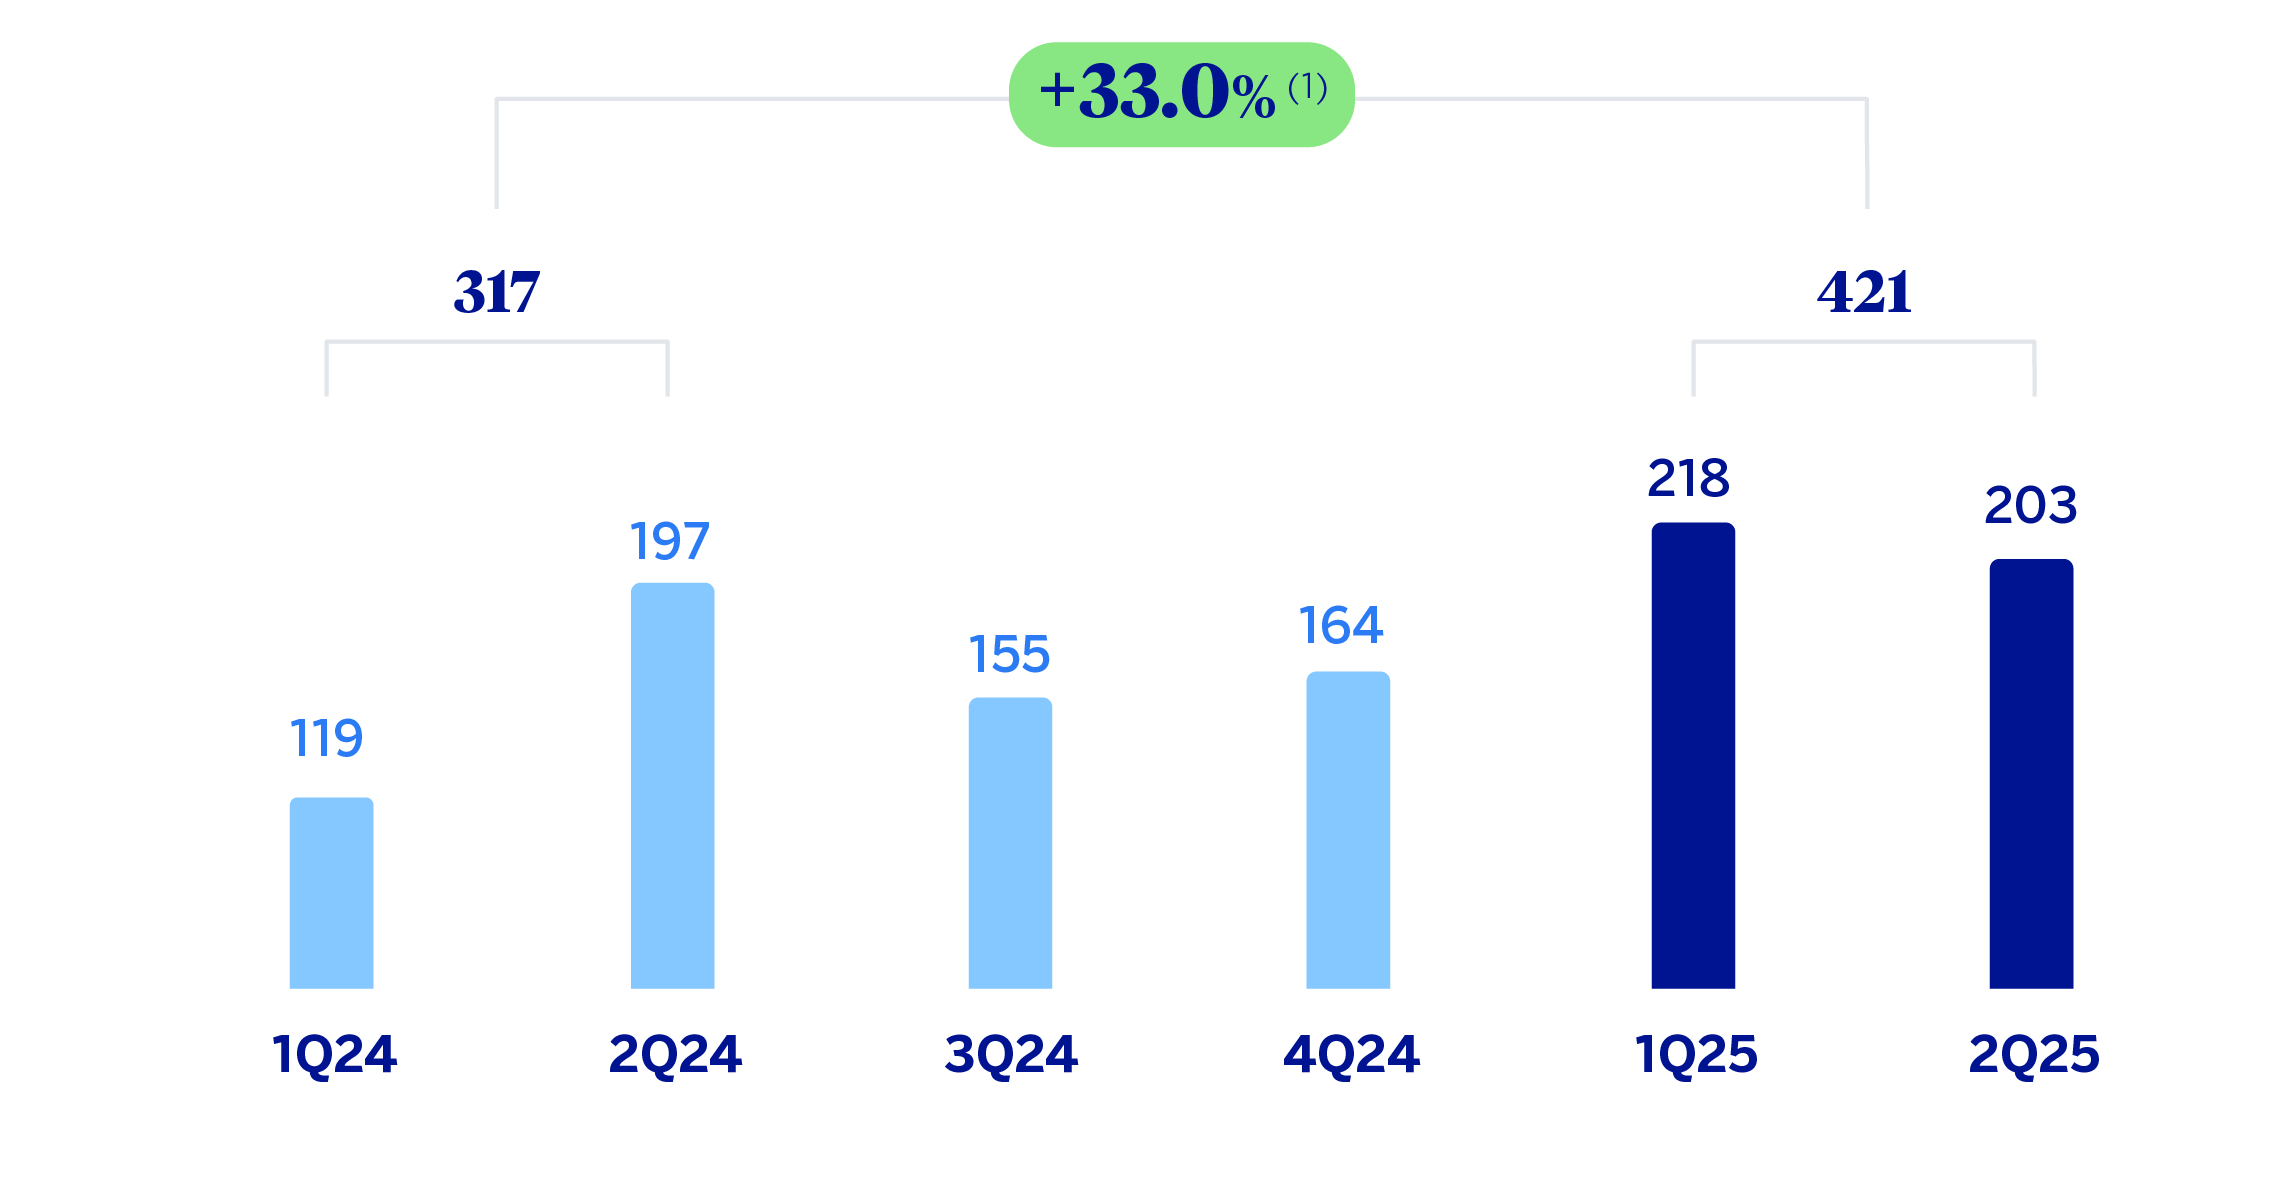
(1) At constant exchange rates: +128.8%.
| FINANCIAL STATEMENTS AND RELEVANT BUSINESS INDICATORS (MILLIONS OF EUROS AND PERCENTAGE) | ||||
|---|---|---|---|---|
| Income statement | 1H25 | 𝚫 % | 𝚫 % (1) | 1H24 |
| Net interest income | 2,382 | (22.5) | (8.8) | 3,075 |
| Net fees and commissions | 417 | 1.9 | 12.4 | 410 |
| Net trading income | 319 | (18.6) | (7.8) | 391 |
| Other operating income and expenses | (404) | (67.3) | (66.0) | (1,236) |
| Gross income | 2,714 | 2.9 | 26.7 | 2,639 |
| Operating expenses | (1,194) | (3.2) | 9.0 | (1,234) |
| Personnel expenses | (528) | (6.6) | 6.6 | (565) |
| Other administrative expenses | (560) | (1.1) | 11.8 | (566) |
| Depreciation | (106) | 3.2 | 6.9 | (103) |
| Operating income | 1,521 | 8.2 | 45.3 | 1,405 |
| Impairment on financial assets not measured at fair value through profit or loss | (528) | (30.1) | (24.8) | (755) |
| Provisions or reversal of provisions and other results | (16) | (37.5) | (22.7) | (25) |
| Profit (loss) before tax | 977 | 56.3 | 201.9 | 625 |
| Income tax | (293) | 152.7 | n.s. | (116) |
| Profit (loss) for the period | 684 | 34.3 | 118.3 | 509 |
| Non-controlling interests | (263) | 36.5 | 103.4 | (192) |
| Net attributable profit (loss) | 421 | 33.0 | 128.8 | 317 |
| Balance sheets | 30-06-25 | 𝚫 % | 𝚫 % (1) | 31-12-24 |
| Cash, cash balances at central banks and other demand deposits | 6,582 | (26.1) | (18.1) | 8,906 |
| Financial assets designated at fair value | 10,756 | (1.2) | 8.4 | 10,884 |
| Of which: Loans and advances | 344 | 67.6 | 74.5 | 205 |
| Financial assets at amortized cost | 49,666 | (0.6) | 7.4 | 49,983 |
| Of which: Loans and advances to customers | 46,501 | (0.7) | 7.3 | 46,846 |
| Tangible assets | 1,134 | (11.1) | (7.5) | 1,277 |
| Other assets | 2,478 | (16.0) | (9.2) | 2,948 |
| Total assets/liabilities and equity | 70,616 | (4.6) | 3.6 | 73,997 |
| Financial liabilities held for trading and designated at fair value through profit or loss | 1,822 | (11.5) | (7.6) | 2,060 |
| Deposits from central banks and credit institutions | 4,305 | 0.3 | 7.0 | 4,292 |
| Deposits from customers | 48,464 | (4.5) | 3.8 | 50,738 |
| Debt certificates | 3,656 | (2.6) | 5.0 | 3,752 |
| Other liabilities | 5,428 | (10.5) | (0.7) | 6,066 |
| Regulatory capital allocated | 6,942 | (2.1) | 6.6 | 7,090 |
| Relevant business indicators | 30-06-25 | 𝚫 % | 𝚫 % (1) | 31-12-24 |
| Performing loans and advances to customers under management (2) | 46.351 | (0,7) | 7,4 | 46.663 |
| Non-performing loans | 2.178 | (8,8) | (3,3) | 2.387 |
| Customer deposits under management (3) | 48.464 | (4,5) | 3,8 | 50.738 |
| Off-balance sheet funds (4) | 7.830 | (1,3) | 11,3 | 7.936 |
| Risk-weighted assets | 52.707 | (6,7) | 1,3 | 56.489 |
| RORWA (5) | 2.46 | 1.94 | ||
| Efficiency ratio (%) | 44,0 | 47,5 | ||
| NPL ratio (%) | 4,2 | 4,5 | ||
| NPL coverage ratio (%) | 89 | 88 | ||
| Cost of risk (%) | 2,33 | 2,87 | ||
| (1) At constant exchange rate. (2) Excluding repos. (3) Excluding repos and including specific marketable debt securities. (4) Includes mutual funds and customer portfolios in Colombia and Peru. (5) For more information on the methodology, as well as the calculation of the metric at the consolidated Group level, see Alternative Performance Measures at this report. |
||||
| SOUTH AMERICA. DATA PER COUNTRY (MILLIONS OF EUROS) | |||||||||
|---|---|---|---|---|---|---|---|---|---|
| Country | Operating income | Net attributable profit (loss) | |||||||
| 1H25 | 𝚫 % | 𝚫 % (1) | 1H24 | 1H25 | 𝚫 % | 𝚫 % (1) | 1H24 | ||
| Argentina | 359 | 6.5 | n.s. | 337 | 91 | (11.9) | n.s. | 103 | |
| Colombia | 305 | (5.6) | 2.2 | 323 | 73 | 29.4 | 40.1 | 57 | |
| Peru | 603 | (4.2) | (5.0) | 630 | 156 | 41.7 | 40.6 | 110 | |
| Other countries (2) | 254 | 119.0 | 132.6 | 116 | 101 | 115.5 | 133.7 | 47 | |
| Total | 1,521 | 8.2 | 45.3 | 1,405 | 421 | 33.0 | 128.8 | 317 | |
| (1) At constant exchange rates. (2) Chile (Forum), Uruguay and Venezuela. Additionally, it includes eliminations and other charges. |
|||||||||
| SOUTH AMERICA. RELEVANT BUSINESS INDICATORS PER COUNTRY (MILLIONS OF EUROS) | ||||||||
|---|---|---|---|---|---|---|---|---|
| Argentina | Colombia | Perú | ||||||
| 30-06-25 | 31-12-24 | 30-06-25 | 31-12-24 | 30-06-25 | 31-12-24 | |||
| Performing loans and advances to customers under management (1)(2) | 7,854 | 5,401 | 15,585 | 14,990 | 18,151 | 18,062 | ||
| Non-performing loans (1) | 224 | 79 | 837 | 928 | 942 | 1,066 | ||
| Customer deposits under management (1) (3) | 9,362 | 7,091 | 16,821 | 16,497 | 18,341 | 19,164 | ||
| Off-balance sheet funds (1) (4) | 2,470 | 2,185 | 2,486 | 2,438 | 2,871 | 2,407 | ||
| Risk-weighted assets | 11,352 | 11,037 | 17,428 | 18,868 | 18,266 | 20,384 | ||
| RORWA (5) | 2.81 | 3.93 | 0.82 | 0.46 | 3.33 | 2.40 | ||
| Efficiency ratio (%) | 54.7 | 59.5 | 45.2 | 46.9 | 37.8 | 36.5 | ||
| NPL ratio (%) | 2.7 | 1.4 | 5.0 | 5.7 | 4.3 | 4.9 | ||
| NPL coverage ratio (%) | 98 | 145 | 85 | 82 | 92 | 90 | ||
| Cost of risk (%) | 4.46 | 4.48 | 2.42 | 2.83 | 1.53 | 2.83 | ||
| (1) Figures at constant exchange rates. (2) Excluding repos. (3) Excluding repos and including specific marketable debt securities. (4) Includes mutual funds and customer portfolios (in Colombia and Peru). (5) For more information on the methodology, as well as the calculation of the metric at the consolidated Group level, see Alternative Performance Measures at this report. |
||||||||
Unless expressly stated otherwise, all the comments below on rates of change, for both activity and results, will be given at constant exchange rates. These rates, together with the changes at current exchange rates, can be found in the attached tables of the financial statements and relevant business indicators.
Activity and results
The most relevant aspects related to the area's activity during the first half of 2025 were:
Lending activity (performing loans under management) recorded a variation of +7.4%, with a more dynamic growth in the wholesale portfolio (+7.8%), growing above the retail portfolio (+7.0%), the latter favored by the evolution of credit cards which grew by 14.1%, and consumer loans (+6.1%), in line with Group BBVA's strategy which is focused in growing in the most profitable segments.
Customer funds under management grew by 4.8% compared to the closing balances at the end of 2024, where the evolution of time deposits (+7.7%) and off-balance sheet funds (+11.3%) stand out.
The most relevant aspects related to the area's activity during the second quarter of the year 2025 have been:
Lending activity grew by 4.8%, favored by the dynamism of commercial loans (+7.0%), credit consumption and credit cards (+4.2%, overall).
With regard to asset quality, the area's NPL ratio stood at 4.2%, which represents a decrease of 12 basis points compared to the previous quarter, favored by the reduction in the non-performing balance, with limited entries to NPLs offset by a good recovery performance, mainly in Peru and Colombia. For its part, the coverage ratio for the area was 89%, which represents a decrease of 76 basis points compared to the end of March because of lower coverage in Argentina.
Customer funds under management increased at a rate of 2.9%, with growth of 3.3% in customer deposits and stability in off-balance sheet funds (+0.6%).
South America generated a net attributable profit of €421m at the end of the first half of 2025, which represents a year-on-year variation of 128.8%, derived from a less negative hyperinflation adjustment in Argentina and a better performance of fees and commissions, together with a more contained level of loan-loss provisions.
The impact of the adjustment for hyperinflation is the recording in the income statement of the loss on the net monetary position of the Argentina subsidiaries under "Other operating income and expenses" and amounted to €211m in the period from January - June 2025, much lower than the €1,020m recorded in the period from January - June 2024.
More detailed information on the most representative countries of the business area is provided below.
Argentina
Macro and industry trends
The process of macroeconomic normalization has continued in recent months. In addition to continued fiscal consolidation and monetary tightening, more recently a large part of the exchange controls have been lifted and a floating exchange rate regime with wide bands has been implemented. Although the new exchange rate regime has allowed some depreciation of the peso, its impact on inflation has been limited. Thus, BBVA Research forecasts that annual inflation, which reached 39.4% in June, will close 2025 at around 28.0%. On the other hand, it maintains unchanged its GDP growth forecast of 5.5% in 2025, after the contraction of 1.7% recorded in 2024.
The banking system continues to grow at a high pace. With data at the end of June 2025, total lending was increased by 176% compared to June 2024, favored by consumer, corporate and, above all, mortgage portfolios, which grew by 188%, 154% and 453% year-on-year, respectively. For its part, deposits continue to decelerate, and at the end of June recorded a year-on-year growth of 67%. Finally, the NPL ratio remains controlled, placing at 2.19% at the end of April 2025.
Activity and results
In the first half of 2025, performing loans under management grew by 45.4% (+21.0% in the second quarter), mainly driven by the growth in corporate loans and all the retail loans, notable was the growth in consumer loans (+61.1%) and the dynamism that mortgage loans start to show (+87.6% in the first half). At the end of June 2025, the NPL ratio stood at 2.7%, an increase of 99 basis points compared to the end of March 2025, mainly due to retail portfolio NPL entries, which affected the NPL coverage ratio, which stood at 98%, below the level recorded at the end of March 2025.
On balance sheet funds recorded a 32.0% growth in the first half of 2025 (+19.1% in the second quarter), with growth in time deposits (+54.8%, favored by corporate balances) higher than demand deposits (+20.0%). For its part, mutual funds (off-balance resources) also had a good performance in the same time horizon (+13.1%), with decrease in the second quarter (-4.1%).
The cumulative net attributable profit at the end of June 2025 stood at €91m, above that achieved in the same quarter of the previous year, due to a significantly lower hyperinflationary impact than at the end of June 2024. Net interest income continues to be affected by the cuts in the monetary policy rate, which was not offset by the higher lending volume. Net fee and commission income grew by 60.6% year-on-year, with growth driven by payment methods activity. On the other hand, a significantly lower negative adjustment for hyperinflation was recorded (mainly reflected in the other operating income and expenses line) and higher expenses, both in personnel (fixed compensation to staff) and general expenses. Loan-loss provisions increased as a result of the growth in lending activity and higher requirements in the retail portfolio. As a result of the above, the cost of risk stood at 4.46%, which represents an increase of 16 basis points in the quarter. Thus, the result of the second quarter reached €57m, up from the previous quarter in constant terms, mainly due to a better performance of the net interest income thanks to the evolution of business activity with individuals and companies, also favored by a less negative adjustment for hyperinflation and lower provisions for impairment of financial assets in the fixed income portfolio. All of the above offset lower NTI revenues (despite higher results from exchange rate differences and derivatives due to the relaxation of the exchange rate hedge) and the growth in operating expenses.
Colombia
Macro and industry trends
The recovery in economic growth has continued in recent months and is likely to continue going forward. BBVA Research has also revised down its GDP growth forecast for 2025 by two tenths to 2.3% (which is placed above the growth of 1.7% recorded in 2024), mainly due to a less favorable global environment and a lower than expected fall in inflation and interest rates. In this respect, inflation is most likely to moderate from levels above 5.0% at the beginning of this year, and from 4.8% in June, to around 4.7% in December. Despite the relative persistence of inflation, and concerns about fiscal performance, interest rates could be cut from 9.25% in June to around 8.25% in December.
Total credit growth in the banking system stood at 5.2% year-on-year in May 2025. As in previous months, the system's lending continued to be driven by corporate credit and mortgage loans, with growth of 6.6% and 9.9% respectively. As for consumer credit remained virtually flat in May in year-on-year terms, with growth of 0.3%. On the other hand, total deposits grew by 9.4% year-on-year at the end of May 2025, with a more balanced evolution by portfolios than in previous quarters. Thus, demand and time deposits grew by 8.5% and 10.6% year-on-year respectively. The system's NPL ratio has improved in the last few months placing at 4.41% in May 2025, 77 basis points below the figure of the same month of the previous year.
Activity and results
Lending activity grew at a rate of 4.0% compared to the end of 2024, and 1.9% in the quarter. In terms of credit quality indicators, they improved with respect to the end of 2024: the NPL ratio stood at 5.0%, a decrease of 31 basis points with respect to the previous quarter, as a result of the containment of inflows and the good recovery dynamics of the quarter, as well as the write-offs in both the retail and wholesale portfolios. On the other hand, the coverage ratio rose 115 basis points in the quarter placing at 85%.
Customer deposits grew by 2.0% compared to the end of 2024, mainly thanks to the growth of time deposits (+5.6%) and, to a lesser extent, to the increase of off-balance sheet funds (+2.0%). In the second quarter, demand deposits grew by 5.0% and offset the flat evolution of time deposits and off-balance sheet funds over the same time period.
The cumulative net attributable profit at the end of June 2025 stood at 73 million euros, 40.1% higher than at the end of the same period of the previous year, favored by the evolution of the net interest income, a more efficient management of expenses, and particularly a lower level of provisions for impairment of financial assets associated with the lower requirements of the retail portfolio as a result of lower entries into NPLs. Finally, the cost of risk fell 13 basis points in the quarter to 2.42%. The net attributable profit of the quarter stood at €41m, 30.5% above the previous quarter at constant exchange rates, mainly as result of the dynamism of the net interest income and lower loan-loss provisions, partially offset by the NTI decrease.
Peru
Macro and industry trends
BBVA Research estimates that GDP will grow by 3.1% in 2025. This forecast is identical to the previous one and close to the 3.3% growth recorded in 2024. Controlled inflation (1.7% in June and expected to be close to 2.0% thereafter) and low interest rates (likely to remain stable at the current level of 4.5%), as well as relatively high copper prices, among other factors, support growth expectations.
Total lending in the Peruvian banking system continued the trend of recent quarters and increased 2.3% year-on-year in May 2025, with growth in all portfolios. Thus, the consumer credit portfolio grew by 1.1% year-on-year, the mortgage portfolio increased by 5.9% and the corporate loan portfolio by 1.6% year-on-year. The system's total deposits rose by 8.8% year-on-year in May, due to the strength of demand deposits (+12.9% year-on-year), which offset the lower growth in time deposits (+1.5% year-on-year). Lastly, the system's NPL ratio continued to fall to 3.60% in May 2025.
Activity and results
Lending activity recorded a slight growth of 0.5% compared to the end of December 2024, focused on the retail segments, mainly mortgages and consumer loans, which offset the deleveraging in the wholesale segments. In the second quarter of 2025, lending growth stood at 1.8%, with growth in both the wholesale and retail portfolios. Regarding the quality indicators, the NPL ratio was lower than at the end of March 2025 (-35 basis points) placing at 4.3% as a result of the positive recovery performance and the write-offs made in the quarter. The coverage ratio was 92%, 111 basis points higher than at the end of March, helped by the reduction in doubtful assets.
Customers funds under management decreased by (-1.7%) during the first half of 2025, with lower balances in demand and time deposits (-4.3%) which were partially offset by growth in off-balance sheet funds (+19.3%).
BBVA Peru's cumulative attributable profit stood at €156m at the end of June 2025, which represents an increase of 40.6% compared to the first half of 2024 due to lower provisions for impairment of financial assets, which were significantly lower than in the second quarter of 2024 (-54.6%) due, among other factors, to a lower retail products requirement as a result of the improved credit quality of the portfolio in the last quarters. For its part, the cost of risk increased up to 1.53%, 12 basis points above the end of March. The profit of the quarter stood at €75m, which is a variation of -8.1% compared to the previous quarter, at constant exchange rates, mainly as a result of the provisions made in the quarter, which contrasted with the releases recorded in the previous quarter, originating from a particular customer.
Read legal disclaimer of this report.