
Mexico
Highlights
- Growth in lending activity, again driven by the retail segment
- Favorable evolution of the net interest income
- Good NTI behavior during the first half
- Quarterly attributable profit remains at high levels
BUSINESS ACTIVITY (1)
(VARIATION AT CONSTANT EXCHANGE RATE COMPARED TO 31-12-24)
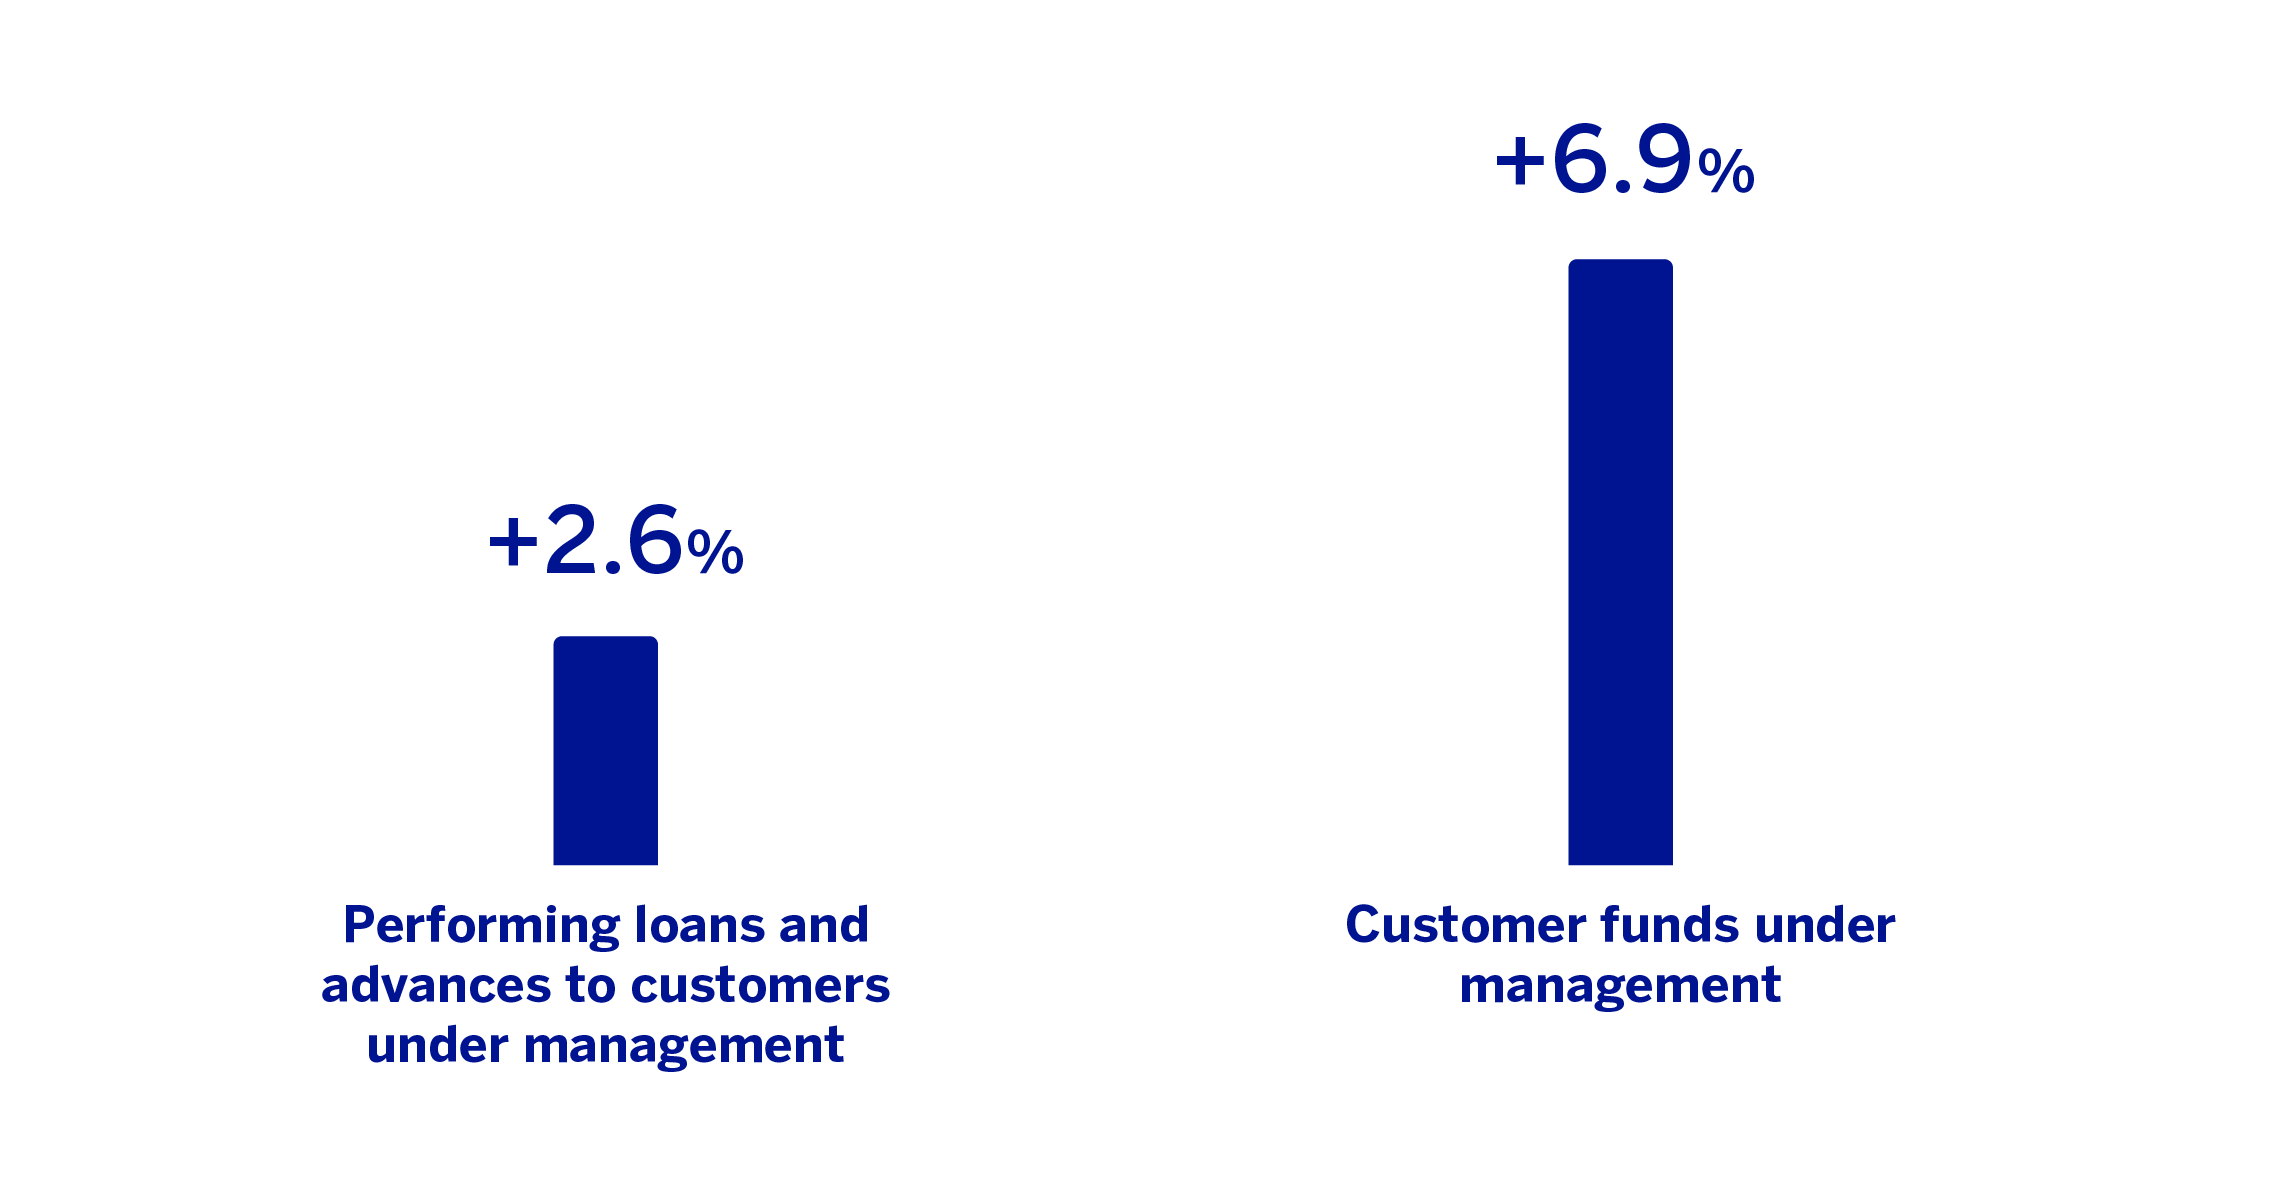
(1) Excluding repos.
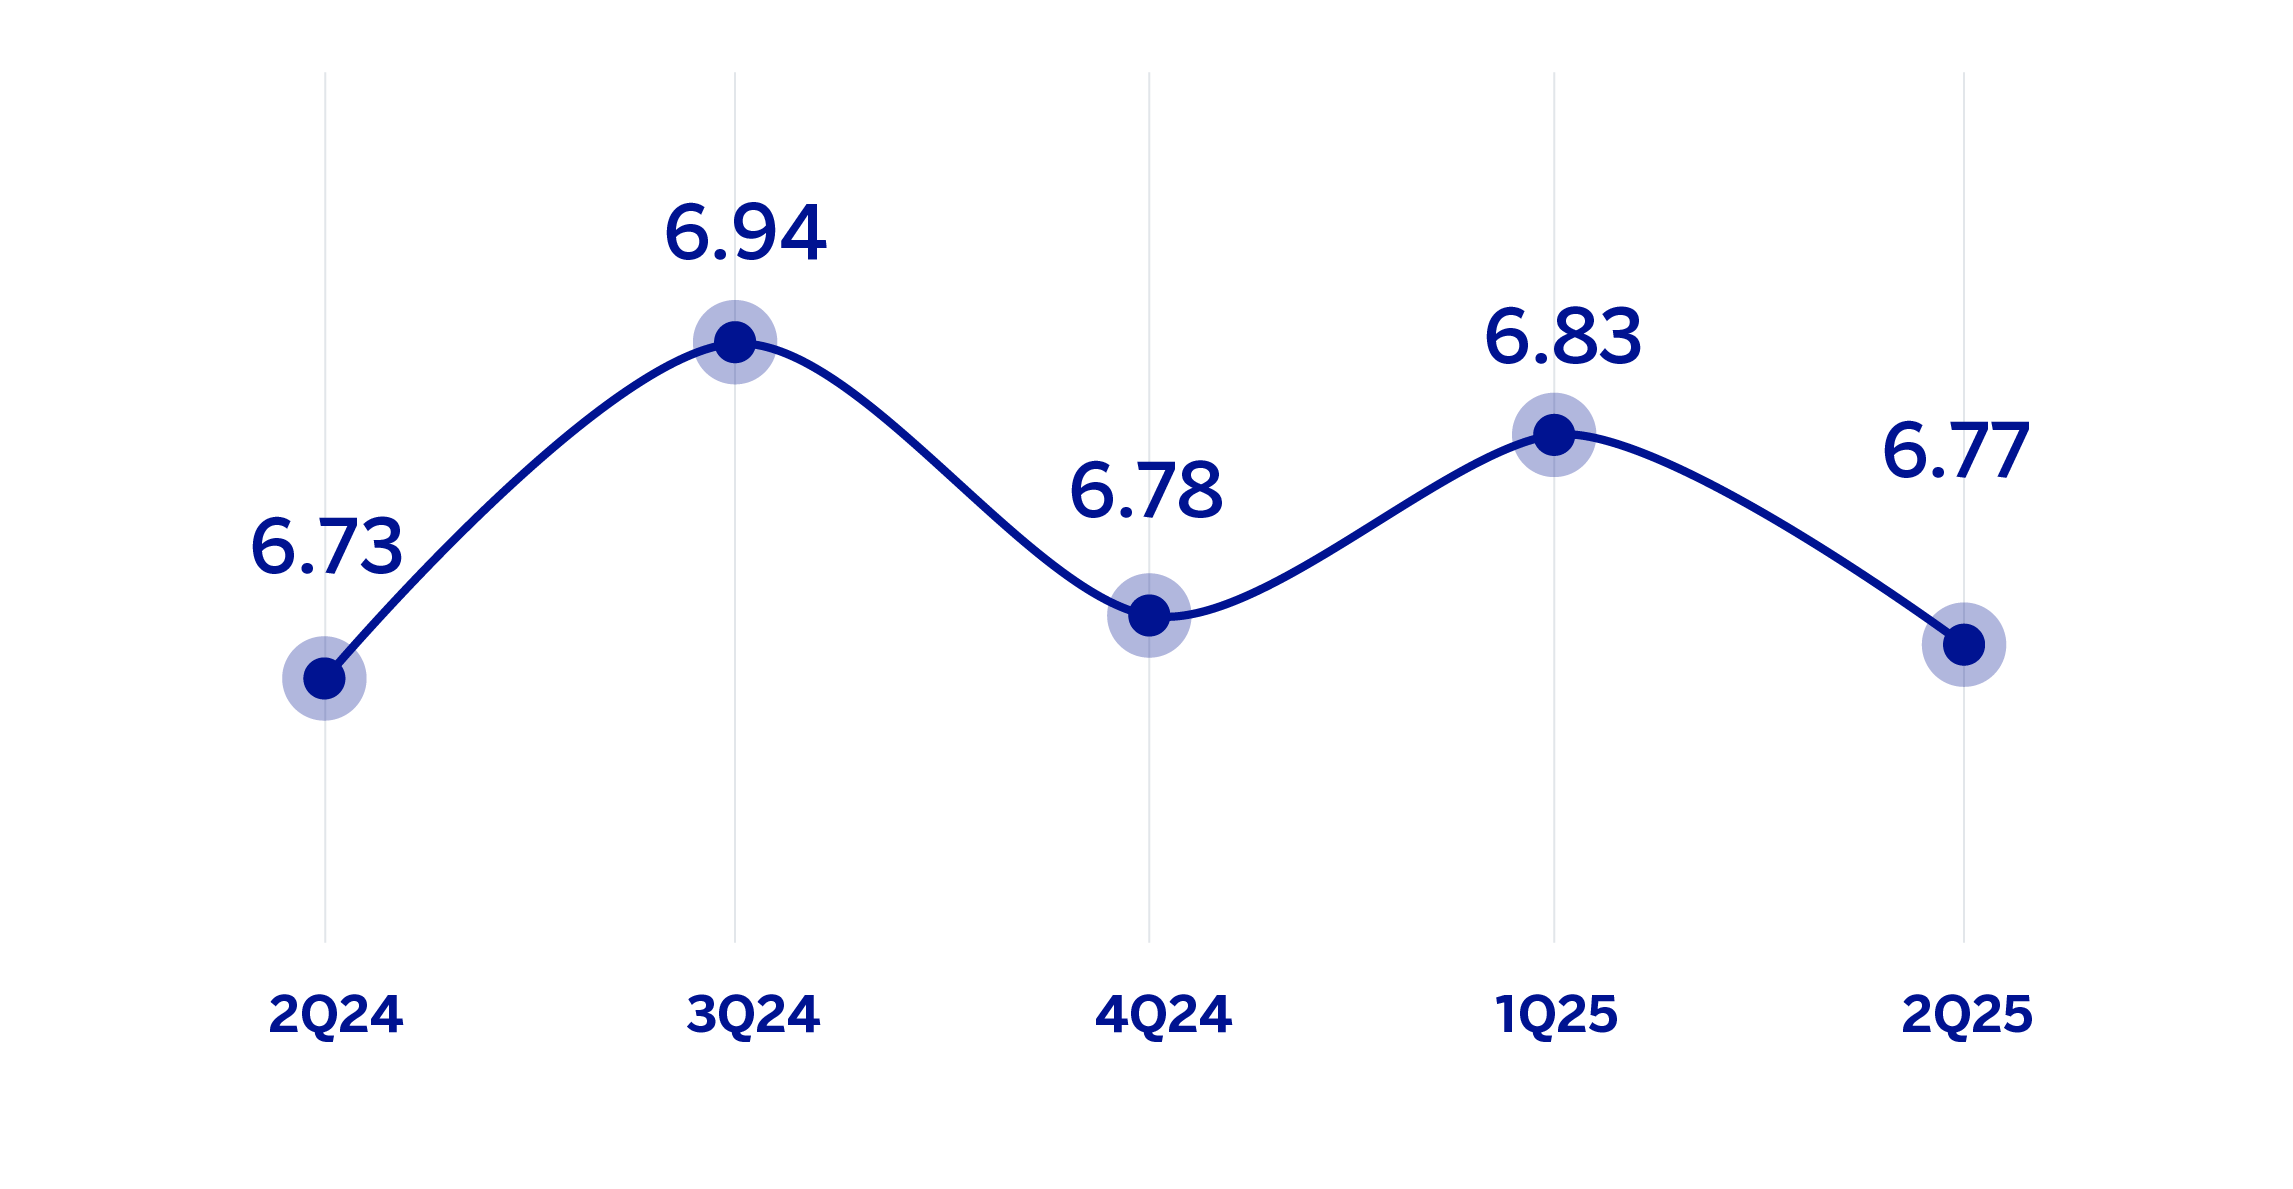
NET INTEREST INCOME / AVERAGE TOTAL ASSETS
(PERCENTAGE AT CONSTANT EXCHANGE RATE)
OPERATING INCOME
(MILLIONS OF EUROS AT CONSTANT EXCHANGE RATE)
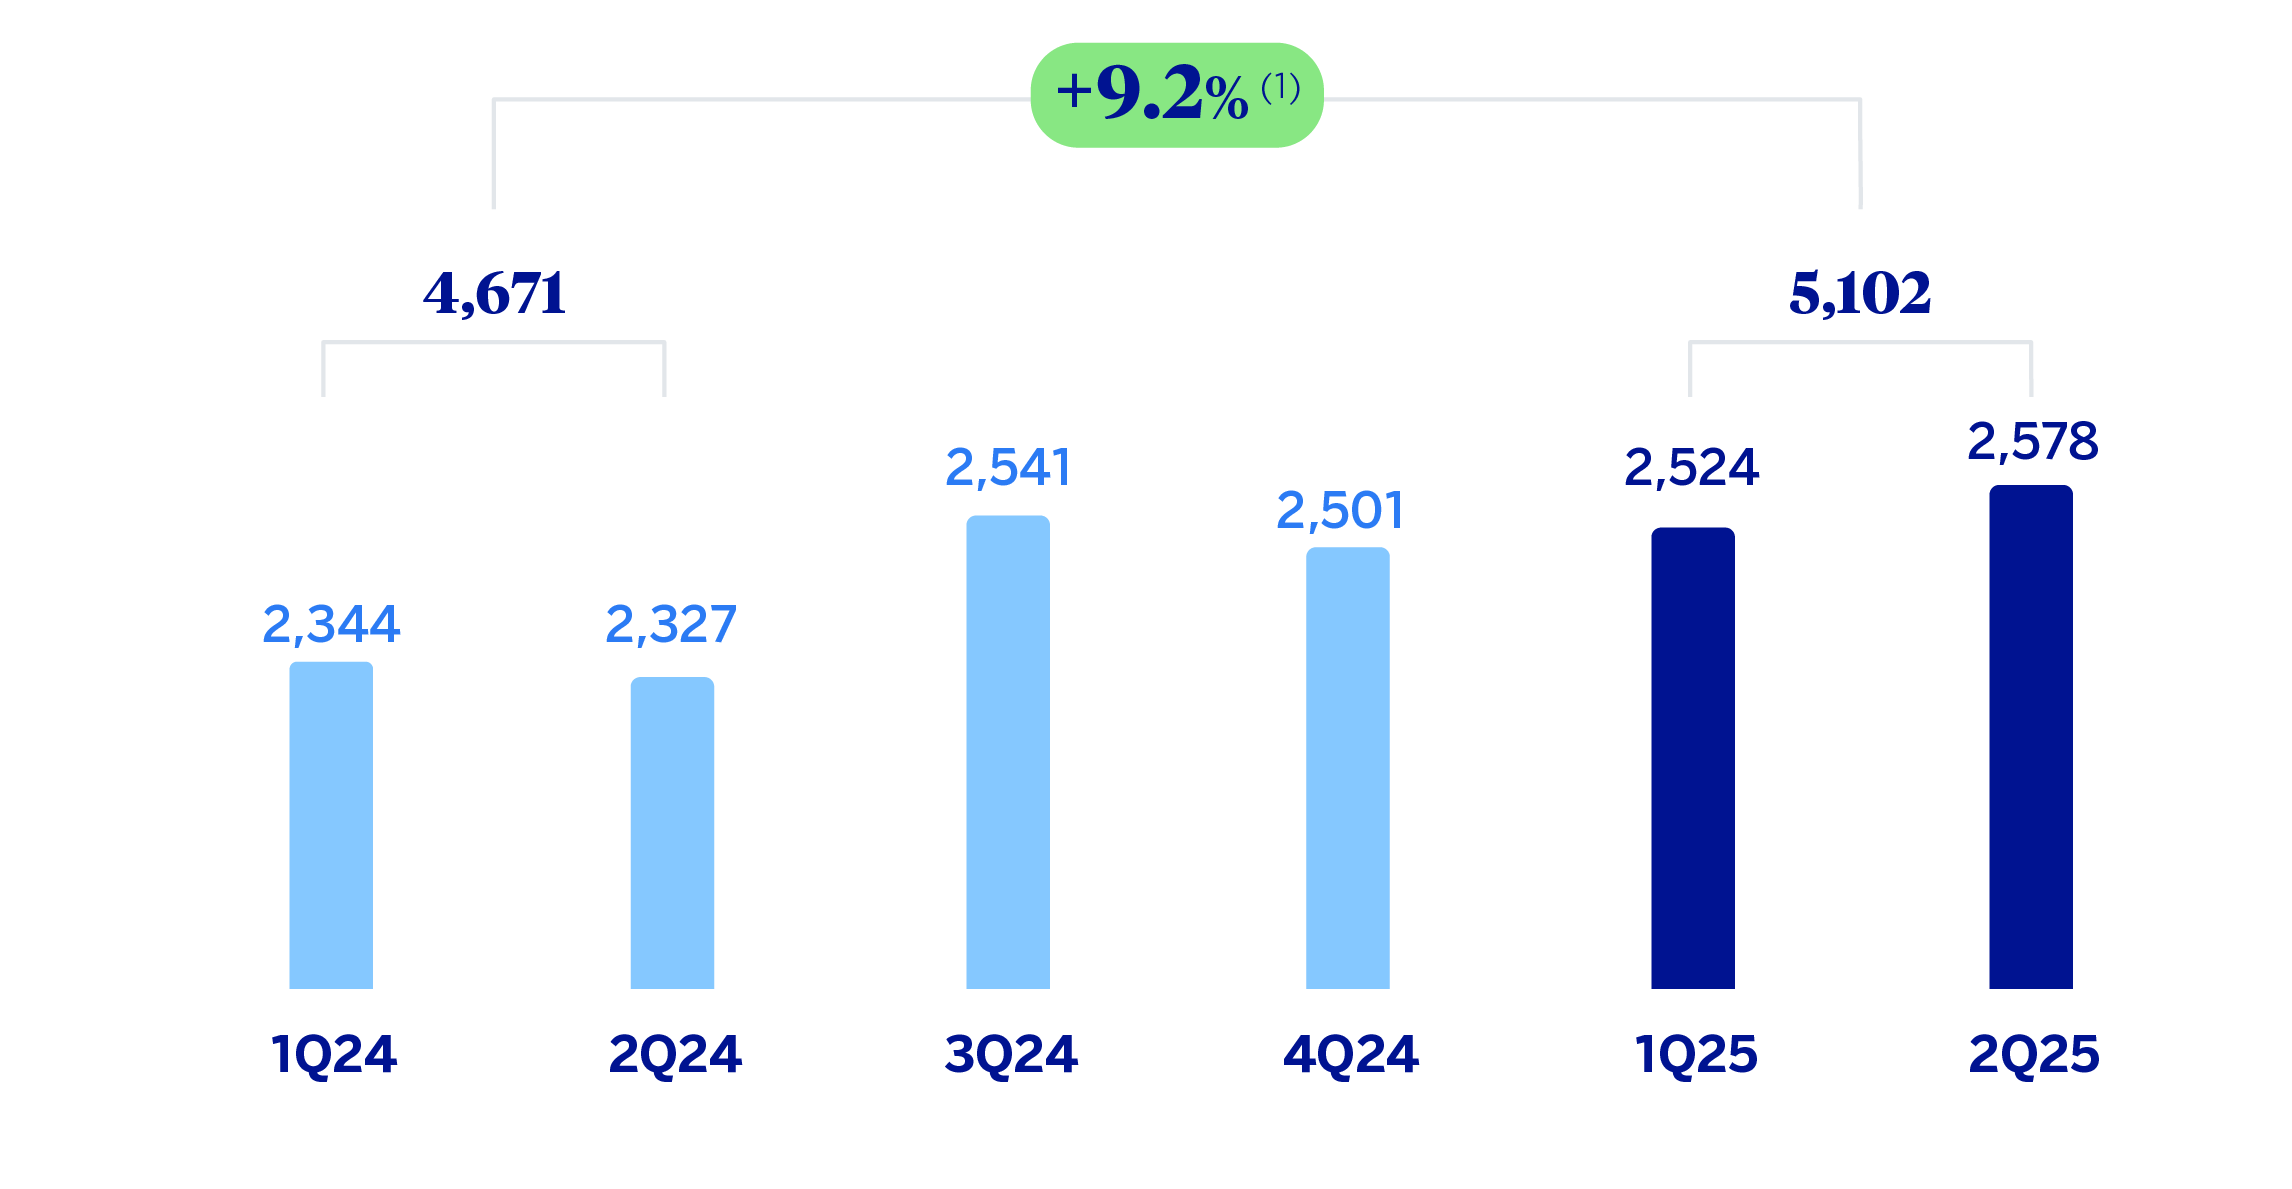
(1) At current exchange rate: -7.4%.
NET ATTRIBUTABLE PROFIT (LOSS)
(MILLIONS OF EUROS AT CONSTANT EXCHANGE RATE)
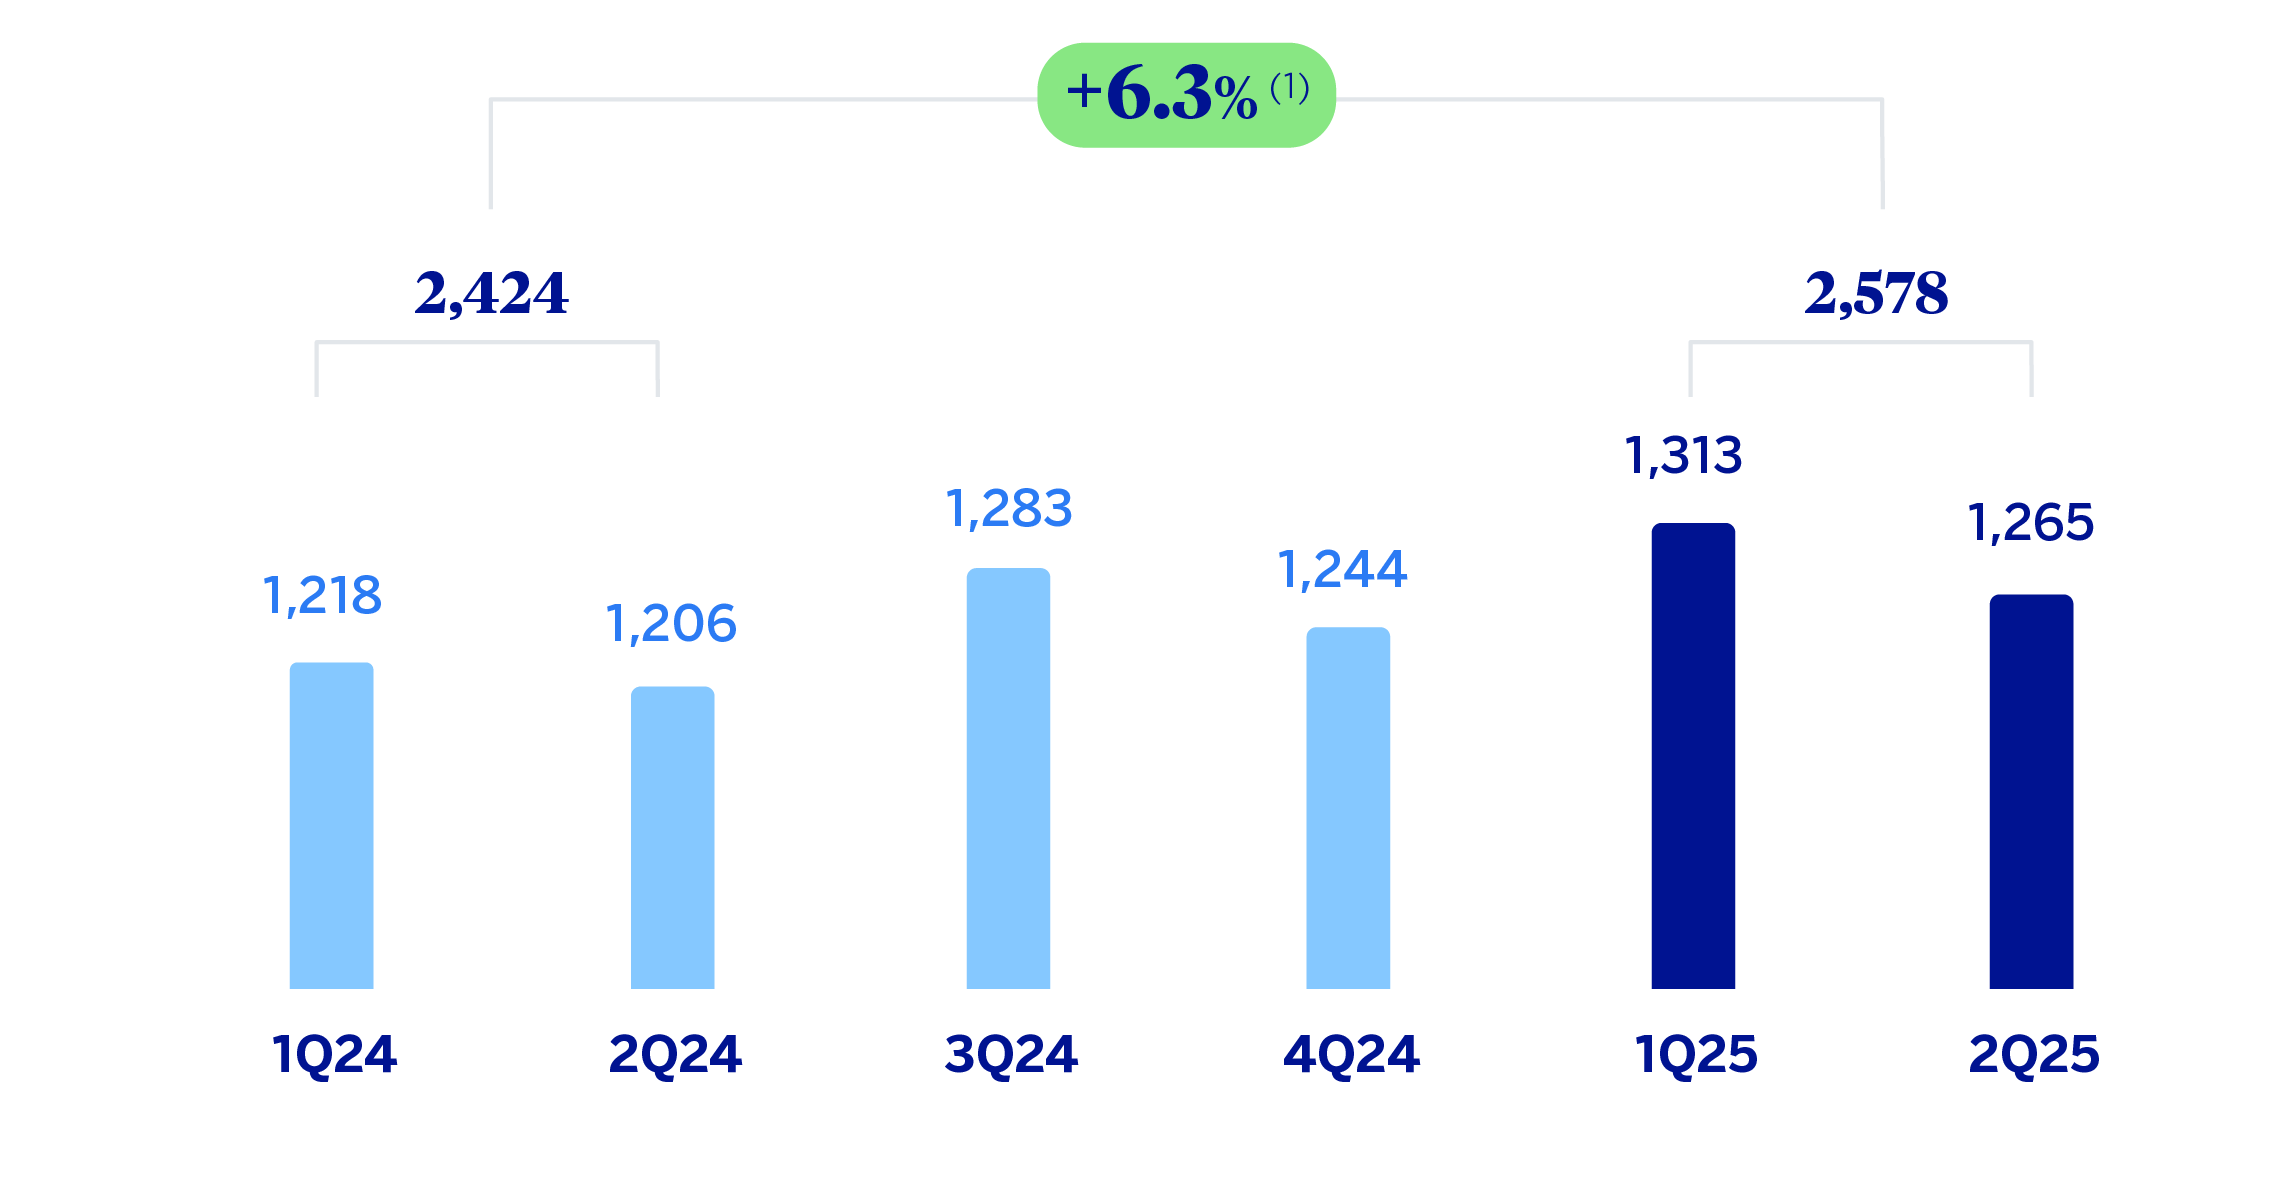
(1) At current exchange rate: -9.8%.
| FINANCIAL STATEMENTS AND RELEVANT BUSINESS INDICATORS (MILLIONS OF EUROS AND PERCENTAGE) | ||||
|---|---|---|---|---|
| Income statement | 1H25 | 𝚫 % | 𝚫 % (1) | 1H24 |
| Net interest income | 5,511 | (7.7) | 8.9 | 5,968 |
| Net fees and commissions | 1,144 | (9.9) | 6.3 | 1,269 |
| Net trading income | 400 | 0.7 | 18.8 | 397 |
| Other operating income and expenses | 293 | 6.3 | 25.3 | 276 |
| Gross income | 7,349 | (7.1) | 9.5 | 7,910 |
| Operating expenses | (2,247) | (6.5) | 10.2 | (2,403) |
| Personnel expenses | (1,067) | (6.7) | 10.0 | (1,144) |
| Other administrative expenses | (964) | (4.2) | 13.0 | (1,006) |
| Depreciation | (216) | (14.7) | 0.6 | (253) |
| Operating income | 5,102 | (7.4) | 9.2 | 5,508 |
| Impairment on financial assets not measured at fair value through profit or loss | (1,486) | (4.3) | 12.8 | (1,553) |
| Provisions or reversal of provisions and other results | (35) | 101.7 | 137.8 | (17) |
| Profit (loss) before tax | 3,581 | (9.1) | 7.2 | 3,938 |
| Income tax | (1,003) | (7.1) | 9.6 | (1,079) |
| Profit (loss) for the period | 2,578 | (9.8) | 6.3 | 2,858 |
| Non-controlling interests | (0) | (8.5) | 7.9 | (1) |
| Net attributable profit (loss) | 2,578 | (9.8) | 6.3 | 2,858 |
| Balance sheets | 30-06-25 | 𝚫 % | 𝚫 % (1) | 31-12-24 |
| Cash, cash balances at central banks and other demand deposits | 10,672 | (15.1) | (12.9) | 12,564 |
| Financial assets designated at fair value | 53,117 | (2.6) | (0.2) | 54,547 |
| Of which: Loans and advances | 3,569 | 70.9 | 75.2 | 2,088 |
| Financial assets at amortized cost | 95,453 | 0.9 | 3.4 | 94,595 |
| Of which: Loans and advances to customers | 88,758 | 0.0 | 2.5 | 88,725 |
| Tangible assets | 1,963 | (3.7) | (1.3) | 2,038 |
| Other assets | 4,441 | (6.0) | (3.7) | 4,726 |
| Total assets/liabilities and equity | 165,647 | (1.7) | 0.8 | 168,470 |
| Financial liabilities held for trading and designated at fair value through profit or loss | 28,262 | (8.5) | (6.2) | 30,885 |
| Deposits from central banks and credit institutions | 7,915 | (13.5) | (11.3) | 9,149 |
| Deposits from customers | 85,537 | 0.7 | 3.2 | 84,949 |
| Debt certificates | 10,835 | 1.1 | 3.6 | 10,717 |
| Other liabilities | 21,262 | 1.0 | 3.6 | 21,043 |
| Regulatory capital allocated | 11,836 | 0.9 | 3.5 | 11,727 |
| Relevant business indicators | 30-06-25 | 𝚫 % | 𝚫 % (1) | 31-12-24 |
| Performing loans and advances to customers under management (2) | 89,137 | 0.1 | 2.6 | 89,044 |
| Non-performing loans | 2,518 | 0.0 | 2.5 | 2,517 |
| Customer deposits under management (2) | 85,534 | 1.9 | 4.4 | 83,962 |
| Off-balance sheet funds (3) | 61,736 | 7.8 | 10.5 | 57,253 |
| Risk-weighted assets | 88,043 | (5.3) | (2.9) | 92,925 |
| RORWA (4) | 5.87 | 5.85 | ||
| Efficiency ratio (%) | 30.6 | 30.3 | ||
| NPL ratio (%) | 2.7 | 2.7 | ||
| NPL coverage ratio (%) | 125 | 121 | ||
| Cost of risk (%) | 3.24 | 3.39 | ||
| (1) At constant exchange rate. (2) Excluding repos. (3) Includes mutual funds, customer portfolios and other off-balance sheet funds. (4) For more information on the calculation methodology, as well as the calculation of the metric at the consolidated Group level, see Alternative Performance Measures at this report. |
||||
Macro and industry trends
Economic activity slowed in the first half of the year, in an environment marked by high uncertainty, with the impact of the tariffs imposed by the United States administration added to the effects of recent domestic reforms and the fiscal consolidation process. In this context, BBVA Research has revised its forecast for GDP growth in 2025 from 1.0% to -0.4%. The economy will also eventually benefit from relatively moderate inflation (4.3% in June and expected to be close to 3.9% in December), lower interest rates, which were cut to 8.0% in June and could reach 7.0% in December, as well as possible structural gains related to lower tariffs on exports to the United States than those applied to China and other competing countries.
Regarding the banking system, with data at the end of May 2025, the volume of credit to the non-financial private sector increased by 12.2% year-on-year, with growth in all the main portfolios: consumer loans (+13,6%), mortgage loans (+6,2%) and corporate loans (+14,0%). The growth of total deposits (demand and time deposits) remained slightly below than the credit growth (+9,0% year-on-year at May 2025), with higher balances in time deposits (+8,7%) and in demand deposits (+9,2%). The system's NPL ratio worsened slightly to 2.28% in May 2025 and the capital indicators are comfortable.
Unless expressly stated otherwise, all the comments below on rates of variation, for both activity and results, will be given at constant exchange rate. These rates, together with variations at current exchange rates, can be found in the attached tables of financial statements and relevant business indicators.
Activity
The most relevant aspects related to the area's activity during the first half of 2025 were:
Lending activity (performing loans under management) grew by 2.6% during the first half of 2025, with a more dynamic behavior in the retail portfolio, which grew by 5.6%, with a favorable evolution of all the portfolios, particularly consumer loans, which increased by 7.3%. For its part, the wholesale portfolio remained stable (-0.7% the first half of 2025).
Customer deposits under management increased by 6.9% in the first half of 2025, with growth in customer deposits of 4.4%, thanks to the commercial boost in a highly competitive environment to attract liabilities and of 10.5% in off-balance sheet resources.
The most relevant aspects related to the area's activity in the second quarter of 2025 were:
During the quarter, lending activity grew by 0.6%, driven by the dynamism of all products in the retail portfolio, which increased by 2.9%, especially consumer loans (+3.6%) and credit cards (+3.9%).
With regard to the asset quality indicators, the NPL ratio stood at 2.7% at the end of June 2025, which represents an increase of 26 basis points compared to the end of March, mainly explained by the growth of non-performing loans in the retail portfolio, as a result of higher inflows and lower write-offs. Compared to the end of the year, this indicator remains stable. On the other hand, the NPL coverage ratio was 125% at the end of June 2025, which represents a decrease compared to the end of March mainly explained by the aforementioned higher volume of inflows of non-performing loans.
Customer deposits under management were 2.1% above the March balances, originated in the evolution of investment funds (+4.7 in the second quarter).
Results
BBVA Mexico achieved a cumulative net attributable profit of €2,578m at the end of June 2025, which represents a year-on-year growth of 6.3%, mainly due to the evolution of the net interest income.
The most relevant aspects of the year-on-year changes in the income statement as of the end of June 2025 are summarized below:
Net interest income increased by 8.9%, favored by the higher lending balances together with a lower cost of customer funds and wholesale financing.
Net fees and commissions grew by 6.3%, mainly as a result of the revenues from asset management and payments.
The contribution from NTI increased by 18.8%.
Other operating income and expenses recorded an increase of 25.3%, thanks to the favorable evolution of the insurance business.
Operating expenses grew by 10.2%, due to both higher general and personnel expenses, where the increase in technology investment expenses stood out.
Loan-loss provisions increased by 12.8%, as a result of the dynamism of activity and the worsening of the macroeconomic environment compared to the initially forecasted at the beginning of 2025. Thus, the cumulative cost of risk at the end of June 2025 increased to 3.24%, an increase of 19 basis points compared to that recorded at the end of March, although it remains 15 basis points below the end of 2024.
In the quarter, and excluding the effect of exchange rate fluctuations, BBVA Mexico generated net attributable profit of €1,265m, which represents a -3.6% variation with respect to the previous quarter. On the positive side, of note was the growth in net interest income, the other operating income and expenses line, which included higher results from the insurance business compared to the previous quarter and lower expenses. This was offset by flat fee income, a decline in NTI due to the lower results of Global Markets and growth in loan-loss provisions, affected by higher requirements from the updated macroeconomic scenario and the growth in the retail portfolio.
Read legal disclaimer of this report.