
Rest of Business
Highlights
- Good performance of lending activity and significant growth in customers funds
- Dynamism in recurring revenues and NTI in the quarter
- Improvement of the NPL ratio and increase in the coverage ratio
- Significant improvement of the efficiency ratio
BUSINESS ACTIVITY (1)
(VARIATION AT CONSTANT EXCHANGE RATES COMPARED TO 31-12-23)
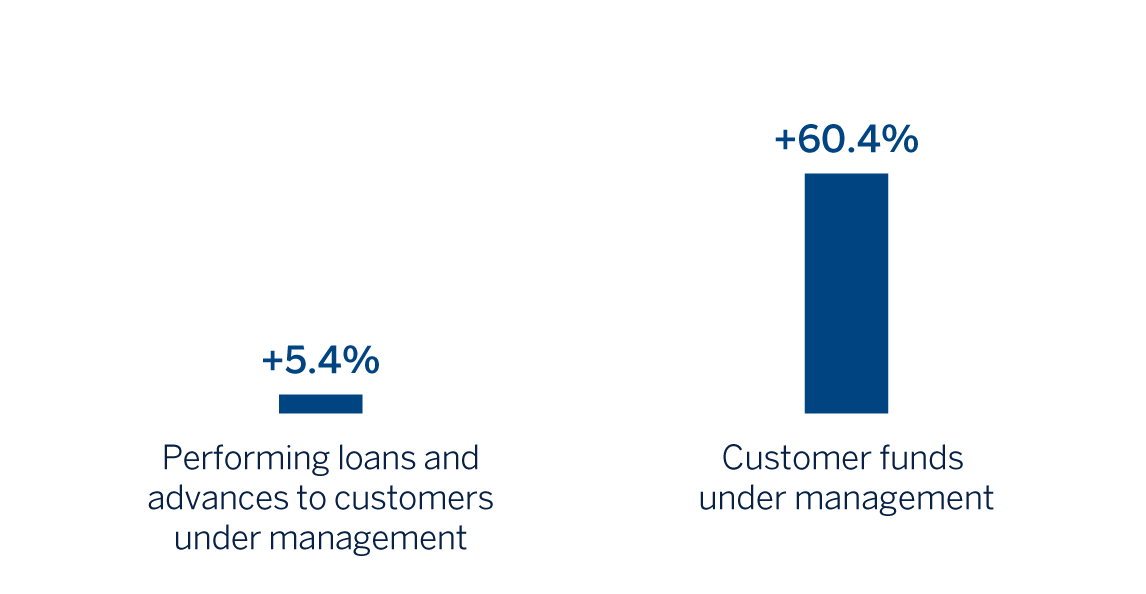
(1) Excluding repos.
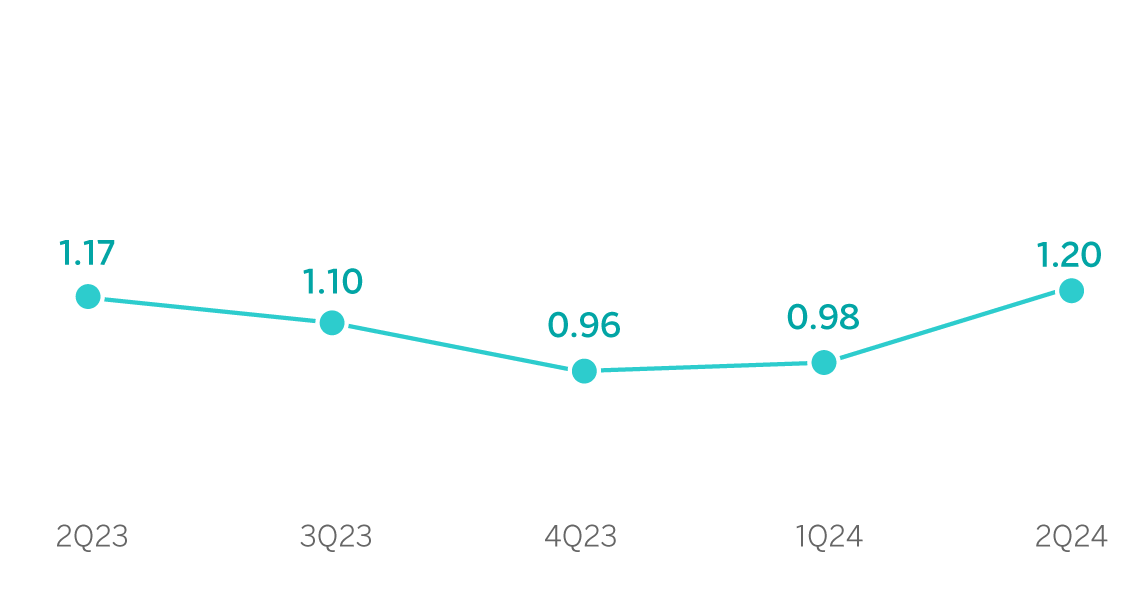
NET INTEREST INCOME / AVERAGE TOTAL ASSETS
(PERCENTAGE AT CONSTANT EXCHANGE RATES)
OPERATING INCOME
(MILLIONS OF EUROS AT CONSTANT EXCHANGE RATES)
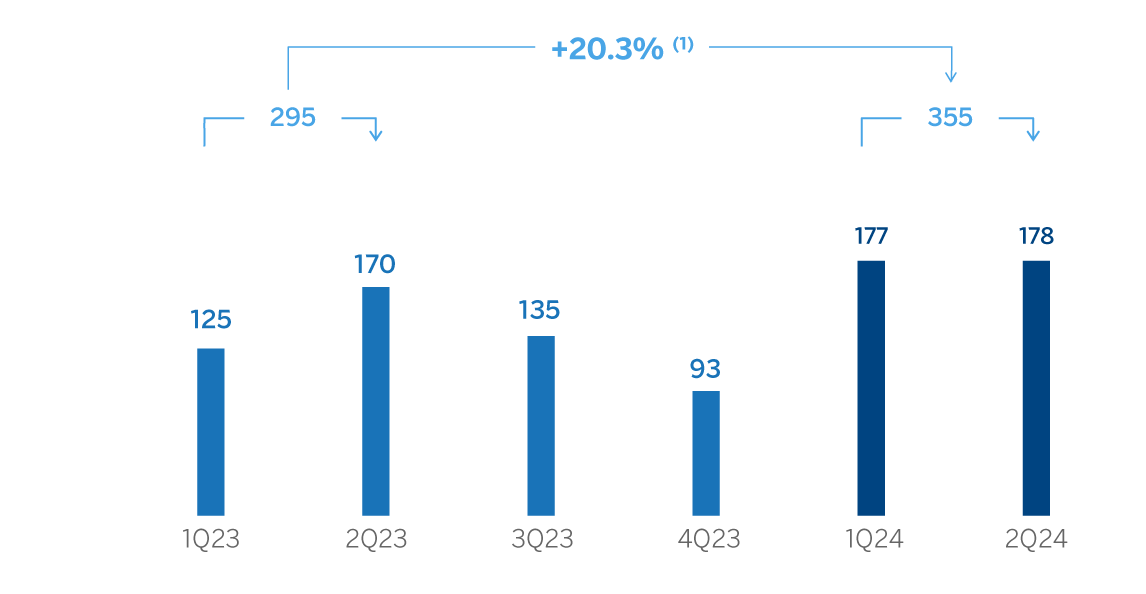
(1) At current exchange rates: +20.9%.
NET ATTRIBUTABLE PROFIT (LOSS)
(MILLIONS OF EUROS AT CONSTANT EXCHANGE RATES)
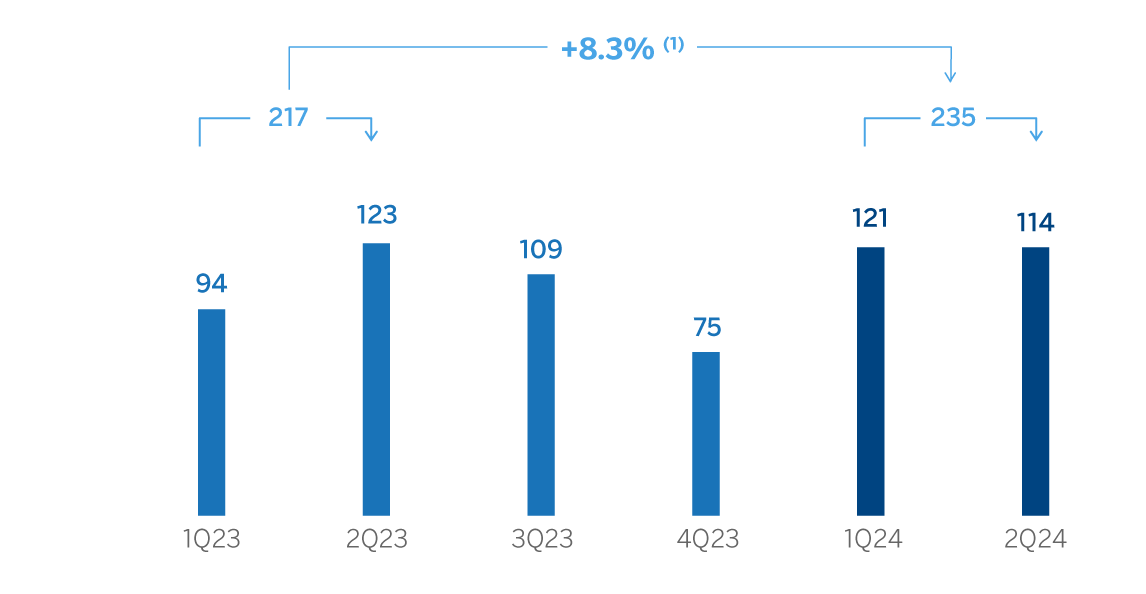
(1) At current exchange rates: +8.9%.
| FINANCIAL STATEMENTS AND RELEVANT BUSINESS INDICATORS (MILLIONS OF EUROS AND PERCENTAGE) | ||||
|---|---|---|---|---|
| Income statement | 1H24 | ∆ % | ∆ % (2) | 1H23 (1) |
| Net interest income | 335 | 28.9 | 28.3 | 260 |
| Net fees and commissions | 138 | 4.1 | 3.4 | 132 |
| Net trading income | 204 | 17.7 | 17.1 | 173 |
| Other operating income and expenses | 2 | n.s. | n.s. | — |
| Gross income | 678 | 20.0 | 19.3 | 566 |
| Operating expenses | (324) | 18.9 | 18.3 | (272) |
| Personnel expenses | (166) | 23.4 | 22.7 | (134) |
| Other administrative expenses | (143) | 13.8 | 13.3 | (126) |
| Depreciation | (15) | 22.5 | 22.0 | (12) |
| Operating income | 355 | 20.9 | 20.3 | 293 |
| Impairment on financial assets not measured at fair value through profit or loss | (46) | 99.9 | 99.6 | (23) |
| Provisions or reversal of provisions and other results | (3) | n.s. | n.s. | 6 |
| Profit (loss) before tax | 306 | 10.5 | 9.9 | 277 |
| Income tax | (71) | 16.4 | 15.7 | (61) |
| Profit (loss) for the period | 235 | 8.9 | 8.3 | 216 |
| Non-controlling interests | — | — | — | — |
| Net attributable profit (loss) | 235 | 8.9 | 8.3 | 216 |
Balance sheets | 30-06-24 | ∆ % | ∆ % (2) | 31-12-23 |
| Cash, cash balances at central banks and other demand deposits | 5,806 | 22.3 | 18.7 | 4,748 |
| Financial assets designated at fair value | 8,398 | (45.7) | (47.4) | 15,475 |
| Of which: Loans and advances | 7,719 | (47.8) | (49.4) | 14,783 |
| Financial assets at amortized cost | 46,595 | 7.5 | 6.4 | 43,363 |
| Of which: Loans and advances to customers | 41,856 | 6.4 | 5.4 | 39,322 |
| Inter-area positions | — | — | — | — |
| Tangible assets | 163 | 7.8 | 6.1 | 151 |
| Other assets | 602 | 12.2 | 10.0 | 537 |
| Total assets/liabilities and equity | 61,564 | (4.2) | (5.8) | 64,274 |
| Financial liabilities held for trading and designated at fair value through profit or loss | 7,450 | (49.8) | (51.3) | 14,831 |
| Deposits from central banks and credit institutions | 2,290 | (25.8) | (26.7) | 3,085 |
| Deposits from customers | 21,397 | 63.9 | 62.9 | 13,056 |
| Debt certificates | 1,597 | 13.0 | 11.8 | 1,413 |
| Inter-area positions | 22,827 | (13.8) | (15.0) | 26,466 |
| Other liabilities | 1,432 | 16.2 | 14.8 | 1,232 |
| Regulatory capital allocated | 4,572 | 9.1 | 7.9 | 4,191 |
Relevant business indicators | 30-06-24 | ∆ % | ∆ % (2) | 31-12-23 |
| Performing loans and advances to customers under management (3) | 41,742 | 6.5 | 5.4 | 39,202 |
| Non-performing loans | 389 | 5.7 | 5.7 | 368 |
| Customer deposits under management (3) | 21,397 | 63.9 | 62.9 | 13,056 |
| Off-balance sheet funds (4) | 585 | 3.4 | 3.4 | 566 |
| Risk-weighted assets | 39,434 | 8.3 | 7.1 | 36,410 |
| Efficiency ratio (%) | 47.7 | 53.1 | ||
| NPL ratio (%) | 0.6 | 0.7 | ||
| NPL coverage ratio (%) | 72 | 69 | ||
| Cost of risk (%) | 0.23 | 0.08 | ||
(1) Revised balances. For more information, please refer to the “Business Areas” section.
(2) At constant exchange rate.
(3) Excluding repos.
(4) Includes pension funds.
Unless expressly stated otherwise, all the comments below on rates of change, for both activity and results, will be given at constant exchange rates. These rates, together with the changes at current exchange rates, can be found in the attached tables of the financial statements and relevant business indicators. Comments that refer to Europe exclude Spain.
Activity
The most relevant aspects of the evolution of BBVA Group's Rest of Business activity between January and June 2024 were:
- Lending activity (performing loans under management) grew 5.4%, thanks to the favorable evolution of project finance as well as corporate lending, both in the New York branch and in Europe. Also noteworthy is the transactional business, which offers integral and personalized financial solutions for clients and collaborates with them to optimize their finances, in both geographic areas through increased participation in factoring programs.
- Customer funds under management grew by 60.4%, favored by the evolution of deposits in both the New York branch and in Europe.
The most relevant aspects of the evolution of BBVA Group's Rest of Business activity during the second quarter of 2024 were:
- Lending activity (performing loans under management) grew at a rate of 2.2%, mainly due to the evolution of corporate loans (+3.4%). In respect of the geographical areas that compose this area, New York and, to a lesser extent, Asia stood out for their good performance once again.
- Compared to the end of 2023, the NPL ratio slightly reduced to 0.6%, thanks to the growth in activity and the reduction of the doubtful balance, favored by the evolution in repayments and recoveries. For its part, the coverage ratio grew to 72% due to the reduction of NPLs and the coverage of individual customers.
- Customer funds under management increased by 2.2% due to the performance of deposits in the European branches.
Results
Rest of Business achieved an accumulated net attributable profit of €235m during the first half of 2024, 8.3% higher than in the same period of the previous year, favored by the performance of the net interest income and the NTI, which offset the increase in operating expenses. and loan-loss provision.
In the year-on-year evolution of the main lines of the area's income statement at the end of June 2024, the following was particularly noteworthy:
- Net interest income increased by 28.3% as a result of increased volume in activity and price management. This growth was observed both in the New York branch and, especially, in Europe, mainly in investment banking.
- Net fees and commissions increased by 3.4%, arising from primary market issuance fees on debt issued by the New York Branch.
- The NTI grew by 17.1% supported by the good results of Global Markets in Europe, especially in credit.
- Increase in operating expenses of 18.3%, with growth mainly in the New York branch and in Europe due to the growth of the workforce and the execution of strategic plans.
- The impairment on financial assets line at the end of June 2024 registered a provision of €-46m, mainly originated in Europe.
In the second quarter of 2024 and excluding the effect of the exchange rates fluctuations, the Group's Rest of Businesses as a whole generated a net attributable profit of €114m, -5.6% below to the previous quarter. In the quarterly evolution, the good performance of recurring income was offset by a lower NTI performance and higher loan-loss provisioning requirements of the wholesale business in Europe.