In the second quarter of 2012, the main features of the BBVA Group’s earnings were those already outlined in preceding quarters: high recurrence, quality and resilience.
- The most recurring revenue (gross income excluding NTI and dividends) was up for the sixth quarter in a row, proving the success of the Group’s customer-centric business model of retail banking, supported by diversification by geographical areas, customers and products.
- The turmoil in the markets during this period had a negative impact on the Bank’s NTI. However, this item has been offset by the positive results from the securitization bond repurchase offer executed in June.
- The dividend received from Telefónica.
- The heading other operating income and expenses continues to benefit from the positive performance of the insurance business in all the geographical areas, and reflects the increased allocations to the various deposit guarantee funds in the countries where BBVA operates.
- The cost/income ratio improved on the level achieved at the close of March 2012.
- The amount of loan-loss provisions increased compared to previous quarters as a result of the impairment of assets related to the real estate sector in Spain, owed to the worsening of the country’s macroeconomic conditions.
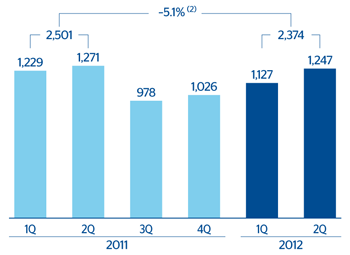
- In conclusion, the Group generated a quarterly net attributable profit of €505m, with a cumulative figure through June this year of €1,510m, or an adjusted result of €2,374m excluding the impairment of assets related to the deterioration of the real estate sector in Spain.
Consolidated income statement: quarterly evolution
(Million euros)
|
2012 |
2011 |
|
2Q |
1Q |
4Q |
3Q |
2Q |
1Q |
| Net interest income |
3,744 |
3,597 |
3,485 |
3,286 |
3,215 |
3,175 |
| Net fees and commissions |
1,215 |
1,216 |
1,136 |
1,143 |
1,167 |
1,114 |
| Net trading income |
462 |
367 |
416 |
(25) |
336 |
752 |
| Dividend income |
311 |
27 |
230 |
50 |
259 |
23 |
| Income by the equity method |
178 |
193 |
207 |
150 |
123 |
121 |
| Other operating income and expenses |
51 |
47 |
42 |
22 |
62 |
79 |
| Gross income |
5,960 |
5,447 |
5,515 |
4,627 |
5,162 |
5,263 |
| Operating Costs |
(2,688) |
(2,585) |
(2,652) |
(2,461) |
(2,479) |
(2,359) |
| Personnel expenses |
(1,429) |
(1,379) |
(1,404) |
(1,325) |
(1,306) |
(1,276) |
| General and administrative expenses |
(1,021) |
(974) |
(1,021) |
(920) |
(964) |
(887) |
| Depreciation and amortization |
(238) |
(232) |
(227) |
(216) |
(208) |
(196) |
| Operating income |
3,272 |
2,862 |
2,863 |
2,166 |
2,683 |
2,904 |
| Impairment on financial assets (net) |
(2,182) |
(1,085) |
(1,337) |
(904) |
(962) |
(1,023) |
| Provisions (net) |
(99) |
(131) |
(182) |
(94) |
(83) |
(150) |
| Other gains (losses) |
(311) |
(222) |
(1,718) |
(166) |
(154) |
(71) |
| Income before tax |
680 |
1,423 |
(375) |
1,002 |
1,484 |
1,659 |
| Income tax |
(21) |
(250) |
368 |
(95) |
(189) |
(369) |
| Net income |
659 |
1,173 |
(7) |
907 |
1,295 |
1,290 |
| Non-controlling interests |
(154) |
(168) |
(132) |
(103) |
(106) |
(141) |
| Net attributable profit |
505 |
1,005 |
(139) |
804 |
1,189 |
1,150 |
| Adjusted (1) |
742 |
122 |
1,166 |
173 |
82 |
80 |
| Net attributable profit (adjusted) (1) |
1,247 |
1,127 |
1,026 |
978 |
1,271 |
1,229 |
| Basic earnings per share (euros) |
0.10 |
0.19 |
-0.03 |
0.16 |
0.24 |
0.24 |
| Basic earnings per share adjusted (euros) (1) |
0.23 |
0.22 |
0.21 |
0.20 |
0.26 |
0.25 |
(1) In 2011, during the fourth quarter, US goodwill imparment charge. In 2011 and 2012, impairment charge related to the deterioration of the real estate sector in Spain.
Consolidated income statement
(Million euros)
|
1H12 |
Δ % |
Δ% at constant exchange rate |
1H11 |
Δ % |
Δ % at constant exchange rate |
2H11 |
| Net interest income |
7,340 |
14.9 |
12.9 |
6,389 |
8.4 |
4.5 |
6,771 |
| Net fees and commissions |
2,431 |
6.6 |
4.6 |
2,281 |
6.6 |
3.0 |
2,280 |
| Net trading income |
829 |
(23.8) |
(25.1) |
1,088 |
112.3 |
100.2 |
391 |
| Dividend income |
338 |
19.6 |
19.2 |
282 |
20.6 |
20.2 |
280 |
| Income by the equity method |
371 |
52.3 |
52.3 |
243 |
3.9 |
3.8 |
357 |
| Other operating income and expenses |
98 |
(30.3) |
(18.3) |
141 |
54.8 |
87.3 |
64 |
| Gross income |
11,407 |
9.4 |
7.8 |
10,425 |
12.5 |
8.8 |
10,141 |
| Operating Costs |
(5,273) |
9.0 |
7.1 |
(4,838) |
3.1 |
0.0 |
(5,113) |
| Personnel expenses |
(2,808) |
8.7 |
6.7 |
(2,582) |
2.9 |
0.1 |
(2,729) |
| General and administrative expenses |
(1,995) |
7.8 |
6.1 |
(1,851) |
2.8 |
(0.6) |
(1,941) |
| Depreciation and amortization |
(470) |
16.2 |
13.4 |
(404) |
6.1 |
2.8 |
(443) |
| Operating income |
6,134 |
9.8 |
8.5 |
5,587 |
22.0 |
17.6 |
5,028 |
| Impairment on financial assets (net) |
(3,267) |
64.6 |
63.4 |
(1,986) |
45.8 |
42.5 |
(2,241) |
| Provisions (net) |
(230) |
(1.8) |
(3.0) |
(234) |
(16.8) |
(18.6) |
(276) |
| Other gains (losses) |
(533) |
137.1 |
137.5 |
(225) |
(71.7) |
(73.2) |
(1,884) |
| Income before tax |
2,104 |
(33.1) |
(34.2) |
3,143 |
235.7 |
225.3 |
627 |
| Income tax |
(271) |
(51.3) |
(52.2) |
(558) |
(199.4) |
(198.6) |
273 |
| Net income |
1,832 |
(29.1) |
(30.3) |
2,585 |
103.6 |
98.7 |
900 |
| Non-controlling interests |
(322) |
30.7 |
21.2 |
(247) |
37.2 |
28.1 |
(235) |
| Net attributable profit |
1,510 |
(35.4) |
(36.0) |
2,339 |
127.1 |
125.2 |
665 |
| Adjusted (1) |
(864) |
- |
- |
(162) |
- |
- |
(1,339) |
| Net attributable profit (adjusted) (1) |
2,374 |
(5.1) |
(5.9) |
2,501 |
18.5 |
13.9 |
2,004 |
| Basic earnings per share (euros) |
0.29 |
|
|
0.48 |
|
|
0.14 |
| Basic earnings per share adjusted (euros) (1) |
0.45 |
|
|
0.52 |
|
|
0.42 |
(1) In 2011, during the fourth quarter, US goodwill imparment charge. In 2011 and 2012, impairment charge related to the deterioration of the real estate sector in Spain.
Net attributable profit (1)
(Million euros)
(1) Adjusted.
(2) At constant exchange rates: –5,9%.