Mexico highlights in the second quarter
- Strong activity.
- Improved spreads.
- Launch of Efectivo móvil for withdrawing money and making payments without the need for a card.
Industry Trends
The Mexican banking system continued to maintain high capitalization and liquidity levels in the second quarter of 2012. This enabled lending expansion and fund gathering activities. The three main categories in the lending portfolio (consumer finance, residential mortgages and SMEs) have continued to record high rates of year-on-year growth.
Fund gathering in demand and time deposits was up 9.3% in the same period, slightly down on the growth of the previous quarter. This is due to a slowdown in the growth of time deposits. In contrast, investment companies (SIDs) have increased their year-on-year growth rate. SIDs are non-banking savings instruments that compete with time deposits.
Regarding the regulatory environment it is worth noting the discussions to implement the Basel III capital rules in 2012 and to postpone the presentation of a future banking insolvency law until 2013.
The peso/euro exchange rate appreciated over the last quarter and the last 12 months.
Regarding the average exchange rate, it strengthened over the quarter but depreciated over the last 12 months. This has had a positive impact on the Group’s balance sheet and activity for the last 12 months and the quarter, and on the income statement for the quarter. However, the foreign-currency impact on the year-on-year earnings on the area is negative. Unless otherwise indicated, all comments below on percentage changes refer to constant exchange rates, with the aim of providing a better understanding of the performance of the business in Mexico.
Income statement
(Million euros)
|
|
Units: |
|
Mexico |
Banking Business |
Pensions and Insurance |
|
1H12 |
Δ% |
Δ% (1) |
1H11 |
1H12 |
Δ% |
Δ% (1) |
1H11 |
1H12 |
Δ% |
Δ% (1) |
1H11 |
| Net interest income |
2,016 |
5.6 |
8.7 |
1,910 |
1,977 |
5.7 |
8.8 |
1,871 |
37 |
3.5 |
6.6 |
35 |
| Net fees and commissions |
612 |
2.0 |
5.1 |
600 |
574 |
1.9 |
4.9 |
563 |
30 |
(7.3) |
(4.5) |
33 |
| Net trading income |
111 |
(52.2) |
(50.8) |
233 |
71 |
(60.5) |
(59.3) |
179 |
40 |
(25.7) |
(23.5) |
54 |
| Other income/expenses |
138 |
41.6 |
45.8 |
97 |
(58) |
(11.5) |
(8.9) |
(65) |
228 |
17.0 |
20.5 |
194 |
| Gross income |
2,877 |
1.3 |
4.3 |
2,840 |
2,563 |
0.6 |
3.6 |
2,548 |
334 |
5.7 |
8.9 |
316 |
| Operating costs |
(1,092) |
6.4 |
9.6 |
(1,026) |
(1,028) |
6.6 |
9.8 |
(965) |
(83) |
1.3 |
4.3 |
(82) |
| Personnel expenses |
(468) |
3.9 |
7.0 |
(450) |
(428) |
3.4 |
6.5 |
(414) |
(40) |
9.0 |
12.3 |
(37) |
| General and administrative expenses |
(561) |
7.1 |
10.3 |
(524) |
(539) |
7.6 |
10.8 |
(501) |
(42) |
(3.9) |
(1.0) |
(43) |
| Deprecation and amortization |
(62) |
21.2 |
24.8 |
(51) |
(62) |
23.1 |
26.8 |
(50) |
(1) |
(43.6) |
(41.9) |
(1) |
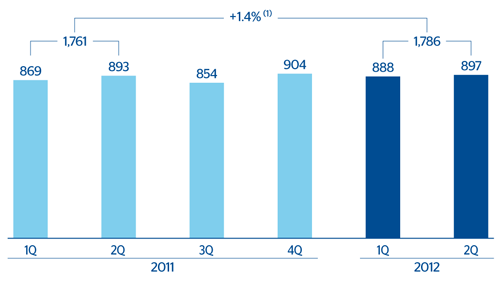
| Operating income |
1,786 |
(1.6) |
1.4 |
1,814 |
1,535 |
(3.1) |
(0.2) |
1,583 |
251 |
7.3 |
10.5 |
234 |
| Impairment on financial assets (net) |
(616) |
0.7 |
3.7 |
(612) |
(616) |
0.7 |
3.7 |
(612) |
- |
- |
- |
- |
| Provisions (net) and other gains (losses) |
(25) |
(10.9) |
(8.2) |
(28) |
(24) |
(10.3) |
(7.6) |
(27) |
(1) |
(20.8) |
(18.4) |
(2) |
| Income before tax |
1,144 |
(2.5) |
0.4 |
1,173 |
895 |
(5.3) |
(2.4) |
945 |
250 |
7.5 |
10.7 |
233 |
| Income tax |
(278) |
(8.2) |
(5.4) |
(302) |
(203) |
(13.2) |
(10.6) |
(234) |
(74) |
7.7 |
10.9 |
(69) |
| Net income |
866 |
(0.5) |
2.4 |
871 |
692 |
(2.7) |
0.2 |
711 |
176 |
7.4 |
10.6 |
164 |
| Non-controlling interests |
(1) |
8.3 |
11.6 |
(1) |
(0) |
(2.3) |
0.7 |
(0) |
(1) |
7.6 |
10.9 |
(1) |
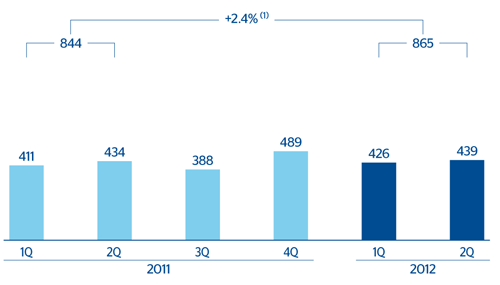
| Net attributable profit |
865 |
(0.5) |
2.4 |
870 |
691 |
(2.7) |
0.2 |
710 |
175 |
7.4 |
10.6 |
163 |
(1) At constant exchange rate.
Balance sheet
(Million euros)
|
|
Units: |
|
Mexico |
Banking Business |
Pensions and Insurance |
|
30-06-12 |
Δ% |
Δ% (1) |
30-06-11 |
30-06-12 |
Δ% |
Δ% (1) |
30-06-11 |
30-06-12 |
Δ% |
Δ% (1) |
30-06-11 |
| Cash and balances with central banks |
5,266 |
2.5 |
1.8 |
5,139 |
5,266 |
2.5 |
1.8 |
5,139 |
- |
- |
- |
- |
| Financial assets |
29,884 |
16.5 |
15.8 |
25,658 |
23,995 |
13.6 |
12.9 |
21,131 |
6,153 |
28.7 |
27.9 |
4,781 |
| Loans and receivables |
40,944 |
16.8 |
16.1 |
35,051 |
40,519 |
17.4 |
16.7 |
34,513 |
492 |
(16.9) |
(17.4) |
592 |
| Loans and advances to customers |
36,526 |
13.7 |
13.0 |
32,124 |
36,315 |
13.6 |
12.9 |
31,963 |
242 |
23.6 |
22.8 |
196 |
| Loans and advances to credit institutions and other |
4,418 |
50.9 |
50.0 |
2,927 |
4,205 |
64.9 |
63.9 |
2,550 |
250 |
(36.9) |
(37.3) |
396 |
| Tangible assets |
1,108 |
25.8 |
25.0 |
881 |
1,102 |
26.0 |
25.3 |
874 |
6 |
(10.5) |
(11.0) |
7 |
| Other assets |
2,475 |
27.9 |
27.1 |
1,935 |
2,906 |
6.2 |
5.5 |
2,737 |
154 |
57.4 |
56.4 |
98 |
| Total assets/Liabilities and equity |
79,677 |
16.0 |
15.3 |
68,665 |
73,788 |
14.6 |
13.9 |
64,394 |
6,806 |
24.2 |
23.5 |
5,478 |
| Deposits from central banks and credit institutions |
12,759 |
41.8 |
41.0 |
8,997 |
12,759 |
41.8 |
41.0 |
8,997 |
- |
- |
- |
0 |
| Deposits from customers |
36,343 |
5.6 |
4.9 |
34,425 |
36,381 |
5.6 |
5.0 |
34,446 |
- |
- |
- |
- |
| Debt certificates |
4,219 |
7.9 |
7.2 |
3,911 |
4,219 |
7.9 |
7.2 |
3,911 |
- |
- |
- |
- |
| Subordinated liabilities |
2,623 |
12.4 |
11.8 |
2,333 |
3,189 |
(0.4) |
(1.0) |
3,202 |
- |
- |
- |
- |
| Financial liabilities held for trading |
6,787 |
54.9 |
54.0 |
4,381 |
6,787 |
54.9 |
54.0 |
4,381 |
- |
- |
- |
- |
| Other liabilities |
12,282 |
14.3 |
13.7 |
10,741 |
6,108 |
1.3 |
0.7 |
6,028 |
6,533 |
28.7 |
27.9 |
5,077 |
| Economic capital allocated |
4,663 |
20.3 |
19.5 |
3,878 |
4,345 |
26.7 |
25.9 |
3,429 |
272 |
(32.0) |
(32.4) |
401 |
(1) At constant exchange rate.
Significant ratios
(Percentage)
|
Mexico |
|
30-06-12 |
31-03-12 |
30-06-11 |
| Efficiency ratio |
37.9 |
38.1 |
36.1 |
| NPA ratio |
4.0 |
3.8 |
3.6 |
| NPA coverage ratio |
111 |
116 |
134 |
| Risk premium |
3.40 |
3.52 |
3.58 |
Mexico. Operating income
(Million euros at constant exchange rate)
(1) At current exchange rate: –1.6%.
Mexico. Net attributable profit
(Million euros at constant exchange rate)
(1) At current exchange rate +0.5%