The United States highlights in the second quarter
- Agreement for the sale of the Puerto Rico business to Oriental Financial Group.
- Consolidation of growth in lending.
- Improved asset quality explains growth in profits.
Industry Trends
In the first quarter of 2012 net interest income in the US banking sector was better than anticipated, with levels of mortgage revenue holding up strongly. However, some analysts are concerned about the sustainability of these positive trends due to increased fears about a bigger than expected slowdown of the US economy.
Expenses continue to be an area of focus, as banks will try to mitigate the likely effect of dampened revenue levels through greater cost control. Moreover, expense levels in the previous quarter remained higher than projected, so savings and efficiency should be a distinguishing characteristic for banks.
Credit quality continues to improve, with lower provisions having a positive impact on results in the financial industry.
As regards lending, the C&I and auto segments continue to be bright spots. However, overall loan growth is expected to be modest in the second quarter of 2012.
Another important point is that as the implementation of the proposed Basel III rules nears, several peers are taking capital actions in preparation, such as the conversion of preferred securities.
Finally, the exchange rate of the dollar against the euro has strengthened in the last quarter and the last year, both in terms of the fixing and average rate. This has had a positive impact on the balance sheet, activity and earnings in the area over the quarter and in the last 12 months. Unless indicated otherwise, all comments below on percentage changes refer to constant exchange rates, with the aim of providing a better understanding of the performance of the business in the United States.
Income statement
(Million euros)
|
|
Units: |
|
The United States |
BBVA Compass |
|
1H12 |
Δ% |
Δ% (1) |
1H11 |
1H12 |
Δ% |
Δ% (1) |
1H11 |
| Net interest income |
849 |
4.8 |
(3.4) |
810 |
739 |
5.3 |
(2.2) |
698 |
| Net fees and commissions |
313 |
(1.3) |
(9.5) |
317 |
262 |
0.6 |
(7.0) |
261 |
| Net trading income |
100 |
20.1 |
9.9 |
83 |
70 |
19.2 |
12.2 |
57 |
| Other income/expenses |
(36) |
46.6 |
35.5 |
(24) |
(33) |
39.0 |
32.4 |
(23) |
| Gross income |
1,226 |
3.4 |
(4.9) |
1,186 |
1,038 |
4.1 |
(3.4) |
994 |
| Operating costs |
(783) |
6.3 |
(2.2) |
(737) |
(682) |
4.9 |
(2.5) |
(646) |
| Personnel expenses |
(448) |
14.4 |
5.3 |
(392) |
(390) |
11.5 |
4.2 |
(346) |
| General and administrative expenses |
(249) |
(4.7) |
(12.3) |
(261) |
(208) |
(4.3) |
(12.0) |
(219) |
| Deprecation and amortization |
(86) |
2.3 |
(5.5) |
(84) |
(84) |
1.8 |
(5.7) |
(82) |
| Operating income |
443 |
(1.3) |
(9.4) |
449 |
357 |
2.4 |
(5.1) |
347 |
| Impairment on financial assets (net) |
(54) |
(72.1) |
(74.0) |
(193) |
(43) |
(70.0) |
(79.5) |
(195) |
| Provisions (net) and other gains (losses) |
(31) |
n.m. |
268.6 |
(7) |
(27) |
n.m. |
n.m. |
0 |
| Income before tax |
358 |
43.9 |
31.2 |
249 |
287 |
79.3 |
73.8 |
153 |
| Income tax |
(113) |
64.4 |
49.7 |
(69) |
(90) |
113.4 |
108.8 |
(40) |
| Net income |
245 |
36.1 |
24.2 |
180 |
196 |
67.1 |
61.3 |
113 |
| Non-controlling interests |
- |
- |
- |
- |
- |
- |
- |
- |
| Net attributable profit |
245 |
36.1 |
24.2 |
180 |
196 |
67.1 |
61.3 |
113 |
(1) At constant exchange rate.
Balance sheet
(Million euros)
|
|
Units: |
|
The United States |
BBVA Compass |
|
30-06-12 |
Δ% |
Δ% (1) |
30-06-11 |
30-06-12 |
Δ% |
Δ% (1) |
30-06-11 |
| Cash and balances with central banks |
2,577 |
(57.3) |
(62.8) |
6,034 |
2,154 |
44.2 |
29.9 |
1,444 |
| Financial assets |
8,371 |
12.3 |
(2.1) |
7,451 |
8,253 |
24.1 |
10.4 |
6,512 |
| Loans and receivables |
41,544 |
11.3 |
(3.0) |
37,315 |
35,975 |
23.5 |
9.8 |
28,536 |
| Loans and advances to customers |
39,361 |
9.4 |
(4.7) |
35,973 |
34,134 |
20.6 |
7.1 |
27,765 |
| Loans and advances to credit institutions and other |
2,183 |
62.8 |
41.8 |
1,341 |
1,841 |
125.0 |
108.1 |
770 |
| Inter-area positions |
- |
- |
- |
1,279 |
412 |
- |
- |
- |
| Tangible assets |
822 |
1.5 |
(11.6) |
810 |
808 |
3.8 |
(9.2) |
775 |
| Other assets |
6,204 |
191.2 |
153.6 |
2,131 |
1,885 |
1.9 |
(11.0) |
1,846 |
| Total assets/Liabilities and equity |
59,518 |
8.2 |
(5.8) |
55,020 |
49,487 |
23.9 |
10.2 |
39,113 |
| Deposits from central banks and credit institutions |
7,241 |
(20.3) |
(30.5) |
9,081 |
4,842 |
66.8 |
51.8 |
2,779 |
| Deposits from customers |
38,143 |
0.6 |
(12.3) |
37,902 |
37,155 |
19.7 |
6.2 |
30,478 |
| Debt certificates |
- |
- |
- |
325 |
- |
- |
- |
- |
| Subordinated liabilities |
909 |
(14.3) |
(25.3) |
1,061 |
842 |
3.4 |
(9.6) |
812 |
| Inter-area positions |
1,829 |
n.s. |
n.s. |
- |
- |
- |
- |
- |
| Financial liabilities held for trading |
467 |
33.6 |
16.4 |
349 |
466 |
71.3 |
56.1 |
260 |
| Other liabilities |
7,778 |
138.1 |
107.4 |
3,266 |
3,606 |
37.1 |
23.0 |
2,553 |
| Economic capital allocated |
3,152 |
3.8 |
(9.6) |
3,037 |
2,576 |
13.9 |
0.6 |
2,231 |
(1) At constant exchange rate.
Significant ratios
(Percentage)
|
The United States |
|
30-06-12 |
31-03-12 |
30-06-11 |
| Efficiency ratio |
63.9 |
64.0 |
62.1 |
| NPA ratio |
2.8 |
3.2 |
4.0 |
| NPA coverage ratio |
82.2 |
75.5 |
67.1 |
| Risk premium |
0.3 |
0.3 |
1.0 |
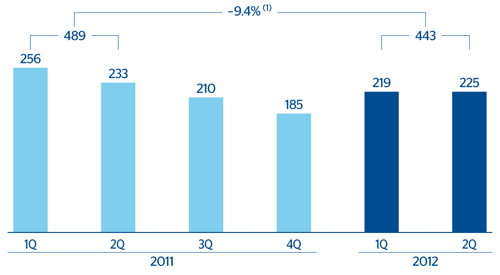
The United States. Operating income
(Million euros at constant exchange rate)
(1) At current exchange rate: —1.3%.
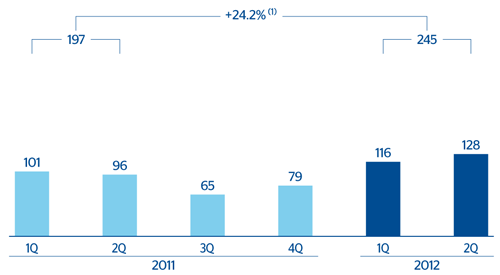
The United States. Net attributable profit
(Million euros at constant exchange rate)
(1) At current exchange rate: +36.1%.