In the second quarter of 2012, the Group’s main asset quality indicators continued stable and still compare positively with those of most of its peers.
As of 30-Jun-2012, BBVA managed a volume of total risks with customers (including contingent liabilities) of €409,145m. This is a slight increase on the figure for 31-Mar-2012, due to the impact of foreign currency appreciation and increased lending in emerging markets.
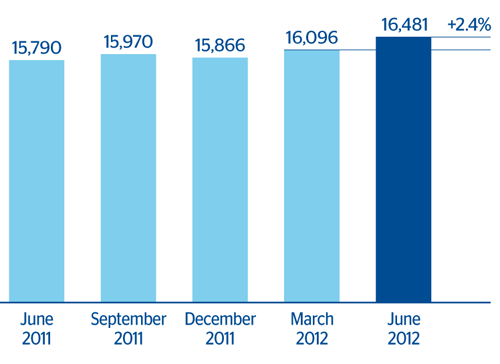
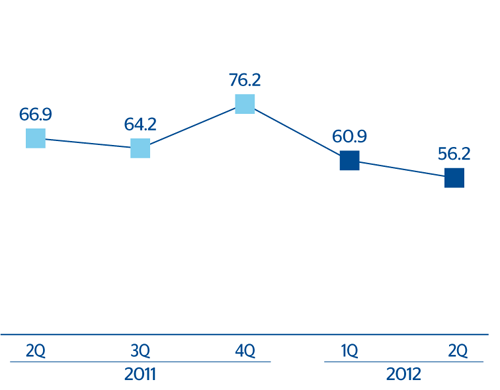
Non-performing assets ended 30-Jun-2012 at €16,481m, up 2.4% over the quarter. This increase is mainly the result of the worsening NPA ratios in Spain and the exchange-rate effect. Over the second quarter, gross additions to NPA increased by 20.2%, partly due to the inclusion of subjective non-performing loans in Spain worth over €550m. Recoveries increased by 11.1% and thus, the ratio of recoveries over gross additions to NPA stood at 56.2% as of 30-Jun-2012.
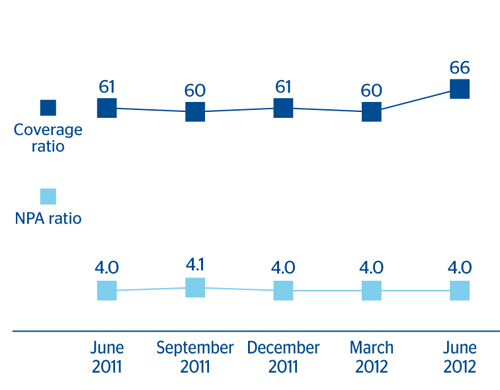
The change in both the total volume of risks and the non-performing assets makes the Group’s NPA ratio to remain at 4.0%. The ratio varies by business areas. In Spain it has risen to 5.1% (4.9% at the close of March), as a result of the country’s difficult economic situation. In Mexico it has grown slightly to 4.0% as of 30-Jun-2012 from 3.8% as of 31-Mar-2012. The ratio fell in the United States to 2.8% (3.2% as of 31-Mar-2012) thanks to yet another improvement in asset quality in the area and the sale of the subsidiary in Puerto Rico. Finally, in South America and Eurasia the ratio remains at historically low levels (2.3% and 1.4% respectively as of 30-Jun-2012).
Coverage provisions for customer risk amounted to €10,822m as of 30-Jun-2012. This represents an increase over the quarter of 11.3%. It is influenced partly by the foreign currency movements with an impact on BBVA’s financial statements, but mainly by increased loan-loss provisions in Spain as a result of the worsening macroeconomic conditions. In the rest of the geographical areas, these funds remain stable. In Spain, the impairment of assets associated with real estate development has worsened. Additional funds have been set aside to cover them, and as a result the Group’s coverage ratio has risen by 52 basis points to 66%. By business areas, in Spain, the United States and Eurasia the ratio improved to 50%, 82% and 119% respectively, Mexico closed the quarter at 111% and South America at 139%.