

As of the close of the third quarter of 2013, the BBVA Group has continued to demonstrate sound and strong capital adequacy ratios, and thus a comfortable capital position. The most relevant aspects in the quarter are:
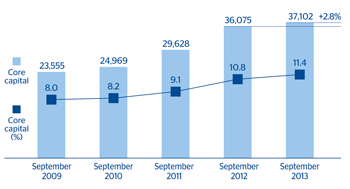
- Another improvement in the core capital ratio according to Basel II, which stood at 11.4% as of 30-Sep-2013, an increase of 13 basis points on the figure for the previous quarter and 63 basis points up on the figure at the close of 2012.
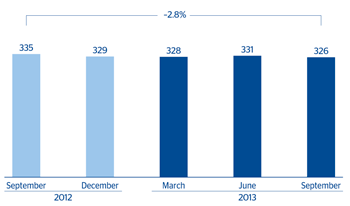
- Risk-weighted assets (RWA) declined by 1.6% over the quarter to €325,665m, due above all to the general depreciation against the euro of the currencies with the biggest influence on BBVA’s financial statements.
At the close of September, the Group’s capital base amounted to €44,319m, a slight decline of 0.5% on the figure for June 2013. This is due mainly to the negative impact of exchange rates over the quarter, as mentioned earlier.
Core capital stands at €37,102m, a figure similar to the one posted at the close of the first half of 2013. Organic capital generation of about 19 basis points has been partly offset by the unfavorable exchange-rate effect. The variations in Tier I and Tier II capital can also be explained mainly by the aforementioned changes in exchange rates.
To sum up, the Group has consolidated its sound solvency indicators in an environment that continues to be difficult, thus anticipating the future Basel III capital requirements. In fact, on October 21 BBVA effected an agreement for the sale of 5.1% of its stake in CNCB, which will allow it to make progress in adopting the new Basel III capital requirements.
Core capital evolution (BIS II Regulation)
(Million euros and percentage)
RWA evolution
(Billion euros)
Capital base (BIS II Regulation)
(Million euros)
|
|
30-09-13 | 30-06-13 | 31-03-13 | 31-12-12 | 30-09-12 |
|---|---|---|---|---|---|
| Core capital | 37,102 | 37,293 | 36,721 | 35,451 | 36,075 |
| Capital (Tier I) | 37,300 | 37,531 | 36,721 | 35,451 | 36,075 |
| Other eligible capital (Tier II) | 7,019 | 7,026 | 7,584 | 7,386 | 8,393 |
| Capital base | 44,319 | 44,557 | 44,305 | 42,836 | 44,467 |
| Risk-weighted assets | 325,665 | 331,098 | 328,002 | 329,033 | 335,203 |
| BIS ratio (%) | 13.6 | 13.5 | 13.5 | 13.0 | 13.3 |
| Core capital (%) | 11.4 | 11.3 | 11.2 | 10.8 | 10.8 |
| Tier I (%) | 11.5 | 11.3 | 11.2 | 10.8 | 10.8 |
| Tier II (%) | 2.2 | 2.1 | 2.3 | 2.2 | 2.5 |