
Rest of Business
Highlights
- Growth in lending activity and in customer funds in 2022
- Strong net interest income, which grows at double-digit
- Risk indicators improvement in the year
- Cost of risk at very low levels
Business activity (1)
(VARIATION AT CONSTANT EXCHANGE RATES COMPARED TO
31-12-21)

(1) Excluding repos.
Net interest income / AVERAGE TOTAL ASSETS
(Percentage. Constant exchange rates)

Operating income
(Millions of euros at constant exchange rates)
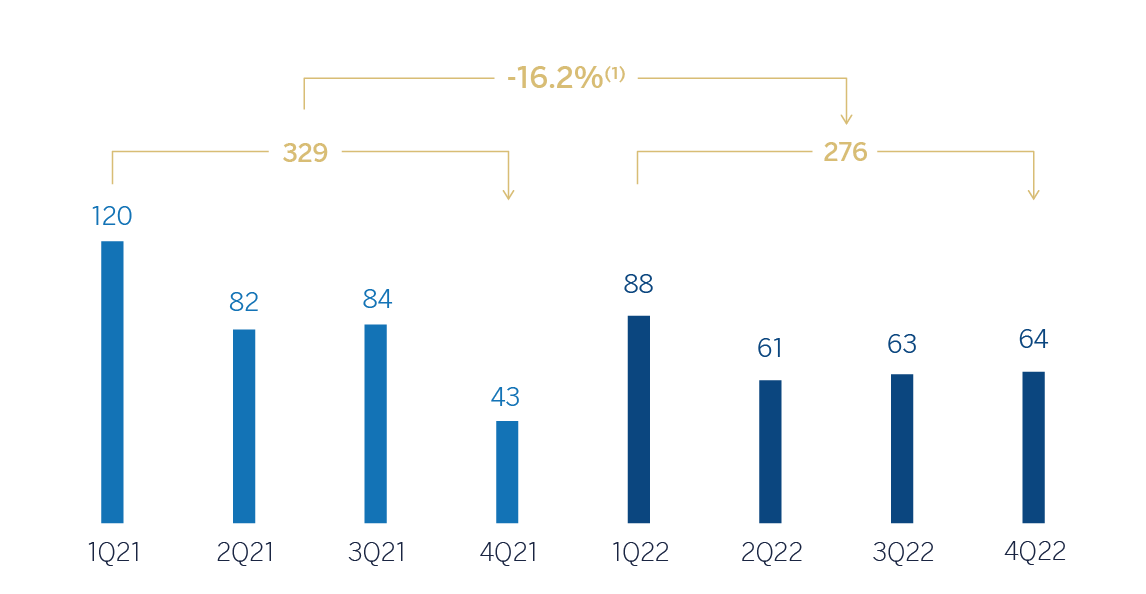
(1) At current exchange rates: -14.6%.
Net attributable profit (LOSS)
(Millions of euros at constant exchange rates)

(1) At current exchange rates: -13.3%.
Financial statements and relevant business indicators (Millions of euros and percentage)
| Income statement | 2022 | ∆% | ∆% (1) | 2021 (2) |
|---|---|---|---|---|
| Net interest income | 332 | 17.4 | 15.5 | 283 |
| Net fees and commissions | 243 | 0.3 | (4.1) | 242 |
| Net trading income | 208 | (11.7) | (13.9) | 236 |
| Other operating income and expenses | 7 | (57.7) | (59.2) | 16 |
| Gross income | 790 | 1.7 | (1.1) | 776 |
| Operating expenses | (513) | 13.4 | 9.4 | (453) |
| Personnel expenses | (262) | 11.9 | 7.5 | (234) |
| Other administrative expenses | (228) | 15.1 | 11.6 | (198) |
| Depreciation | (23) | 12.6 | 9.9 | (20) |
| Operating income | 276 | (14.6) | (16.2) | 323 |
| Impaiment on financial assets not measured at fair value through profit or loss | (13) | n.s. | n.s. | 27 |
| Provisions or reversal of provisions and other results | 14 | n.s. | n.s. | (4) |
| Profit (loss) before tax | 277 | (20.0) | (21.6) | 346 |
| Income tax | (37) | (46.6) | (47.3) | (70) |
| Profit (loss) for the period | 240 | (13.3) | (15.1) | 276 |
| Non-controlling interests | - | - | - | - |
| Net attributable profit (loss) | 240 | (13.3) | (15.1) | 276 |
- (1) At constant exchange rates.
- (2) Restated balances. For more information, please refer to the “Business Areas” section.
| Balance sheets | 31-12-22 | ∆% | ∆% (1) | 31-12-21 |
|---|---|---|---|---|
| Cash, cash balances at central banks and other demand deposits | 4,015 | 1.1 | (4.5) | 3,970 |
| Financial assets designated at fair value | 5,090 | (10.4) | (15.2) | 5,682 |
| Of which: Loans and advances | 4,230 | (9.8) | (15.1) | 4,691 |
| Financial assets at amortized cost | 40,425 | 33.4 | 31.4 | 30,315 |
| Of which: Loans and advances to customers | 37,375 | 38.6 | 36.5 | 26,965 |
| Inter-area positions | - | - | - | - |
| Tangible assets | 78 | 12.0 | 11.0 | 70 |
| Other assets | 343 | 17.9 | 15.1 | 291 |
| Total assets/liabilities and equity | 49,952 | 23.9 | 20.8 | 40,328 |
| Financial liabilities held for trading and designated at fair value through profit or loss | 4,397 | (13.1) | (18.1) | 5,060 |
| Deposits from central banks and credit institutions | 2,745 | 60.6 | 55.1 | 1,709 |
| Deposits from customers | 9,827 | 56.8 | 52.8 | 6,266 |
| Debt certificates | 1,561 | 33.9 | 31.5 | 1,166 |
| Inter-area positions | 26,061 | 18.0 | 16.0 | 22,085 |
| Other liabilities | 1,013 | 34.2 | 31.2 | 755 |
| Economic capital allocated | 4,348 | 32.3 | 29.9 | 3,287 |
| Relevant business indicators | 31-12-22 | ∆% | ∆% (1) | 31-12-21 |
|---|---|---|---|---|
| Performing loans and advances to customers under management (2) | 37,431 | 38.6 | 36.5 | 27,000 |
| Non-performing loans | 192 | (26.2) | (26.2) | 261 |
| Customer deposits under management (2) | 9,827 | 56.8 | 52.8 | 6,266 |
| Off-balance sheet funds (3) | 520 | (12.9) | (12.9) | 597 |
| Risk-weighted assets | 35,064 | 19.8 | 17.6 | 29,280 |
| Efficiency ratio (%) | 65.0 | 58.4 | ||
| NPL ratio (%) | 0.4 | 0.7 | ||
| NPL coverage ratio (%) | 131 | 116 | ||
| Cost of risk (%) | 0.04 | (0.11) |
(1) At constant exchange rates.
(2) Excluding repos.
(3) Includes pension funds.
Unless expressly stated otherwise, all the comments below on rates of change, for both activity and results, will be given at constant exchange rates. These rates, together with the changes at current exchange rates, can be found in the attached tables of the financial statements and relevant business indicators. Comments that refer to Europe exclude Spain.
Activity
The most relevant aspects of the evolution of BBVA Group's Rest of Business activity between January and December 2022 were:
- Lending activity (performing loans under management) registered an increase (+36.5%), with a favorable performance, mainly from the New York branch and, to a lesser extent, from the branches in Europe and Asia.
- Customer funds under management increased by 47.2%, with growth in time deposits, mainly from Europe and the New York branch, which more than offset the decline in demand deposits and off-balance sheet funds.
The most relevant of the evolution of the area's activity in the fourth quarter of 2022 has been:
- Lending activity increased by 8.3%, due to the growth in the business segment that offset the deleveraging in the retail segment.
- Regarding credit risk indicators, the NPL ratio stood at 0.4%, quite stable during the quarter (1 basis point below the previous quarter), and showing a reduction of 31 basis points during the year, mainly due to the wholesale clients recoveries. The NPL coverage ratio increased in the year to 131%.
- Total customer funds grew 15.7%, supported by the increase in time deposits (+29.4%), originating mainly from the branches in Europe.
Results
The good performance of the net interest income was offset by lower commissions and NTI. Together with the expenses increase in an environment of higher inflation and loan-loss provisions on normal level, represents a lower contribution of the unit to the Group results in 2022.
Regarding the year-on-year evolution of the area's income statement at the end of December 2022:
- The net interest income increased by 15.5%, with a positive performance in Europe and the New York branch.
- Net fees and commissions decreased by 4.1%, due to the lower fees and commissions recorded by BBVA Securities, which offset the good performance in Europe, and especially in New York.
- The NTI line recorded a decrease of 13.9%, mainly due to the lower results of the business in the United States.
- Decrease in the contribution of the other operating income and expenses line, as a result of the evolution of BBVA Securities.
- Increase in operating expenses of 9.4%, mainly due to higher personnel expenses in Europe and the New York branch, partially offset by the lower expenses recorded by BBVA Securities.
- The impairment on financial assets line closed December 2022 with a slight provision compared to the release of the previous year, originated in the New York branch.
- Favorable performance of the provisions or reversal of provisions line and other results mainly focused on lower provisions in New York.
- As a result, the area's cumulative net attributable profit between January and December 2022 was €240m (-15.1% year-on- year).
In the fourth quarter of 2022 and excluding the effect of the variation in exchange rates, the Group's Rest of Businesses as a whole generated a net attributable profit of €62m, which represents an increase of 21.3% compared to the previous quarter, mainly due to the net interest income increase, linked to the good results of CIB in Europe and NTI evolution in the United States, which offset the higher loan-loss provisions made in the quarter and the higher operating expenses, in particular, IT- related costs.