
Mexico
Highlights
- Balanced and double-digit growth in both the wholesale and retail portfolio in the year
- Very positive performance of recurring income due to increased activity and improved customer spreads
- Risk indicators improvement and outstanding performance of the efficiency ratio
- Constant increase in the quarterly net attributable profit
Business activity (1)
(VARIATION AT CONSTANT EXCHANGE RATE COMPARED TO
31-12-21)

(1) Excluding repos.
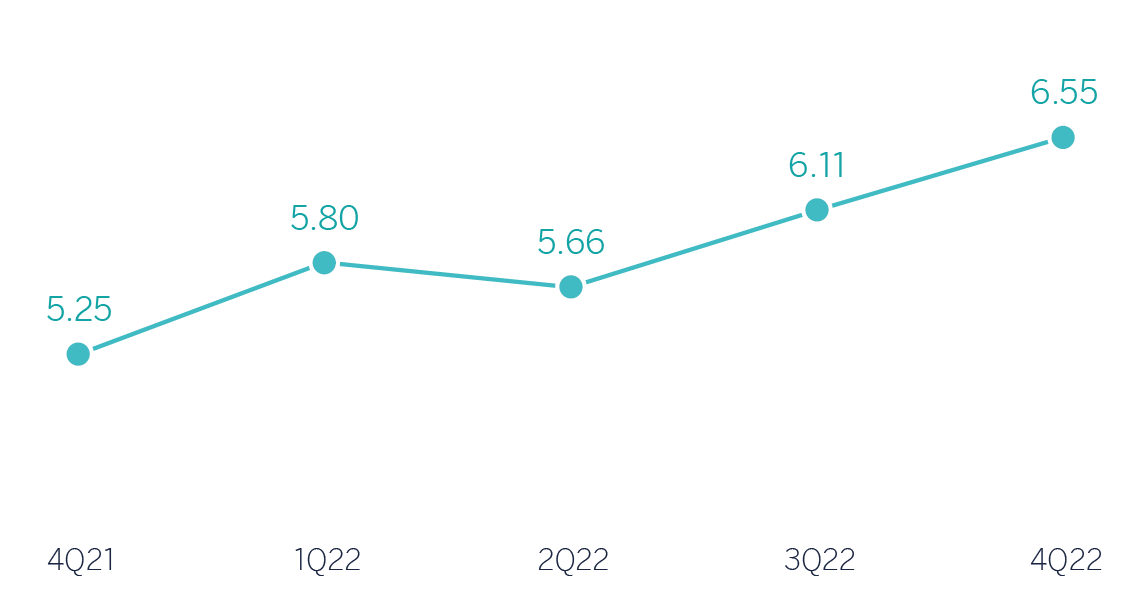
Net interest income/ AVERAGE TOTAL ASSETS
(PERCENTAGE AT CONSTANT EXCHANGE RATE)
Operating income
(Millions of euros at constant exchange rate)
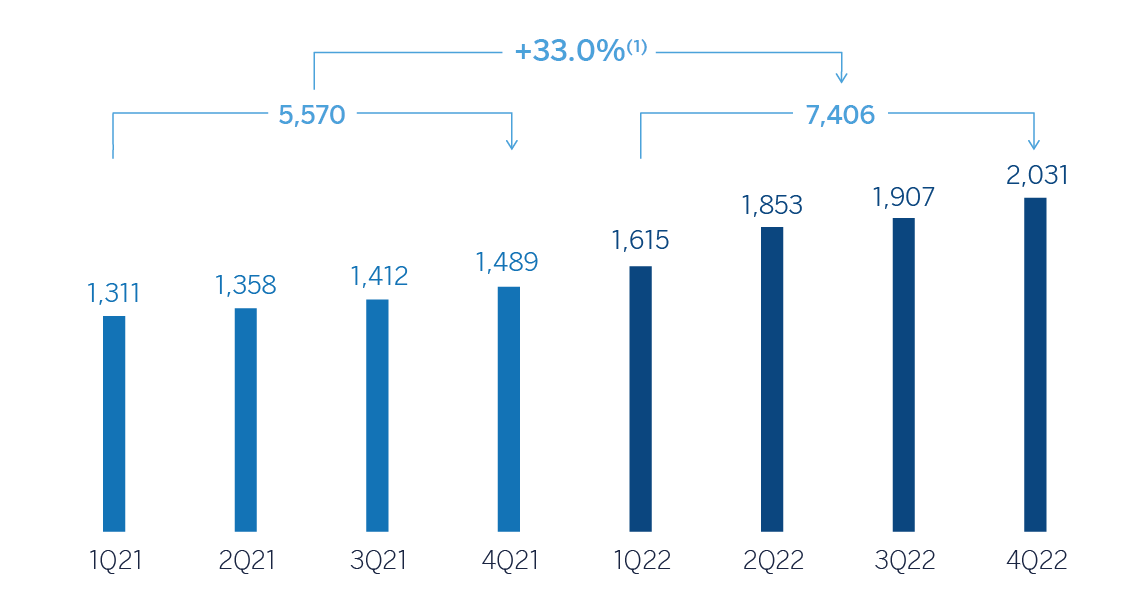
(1) At current exchange rate: +50.5%.
Net attributable profit (LOSS)
(Millions of euros at constant exchange rate)
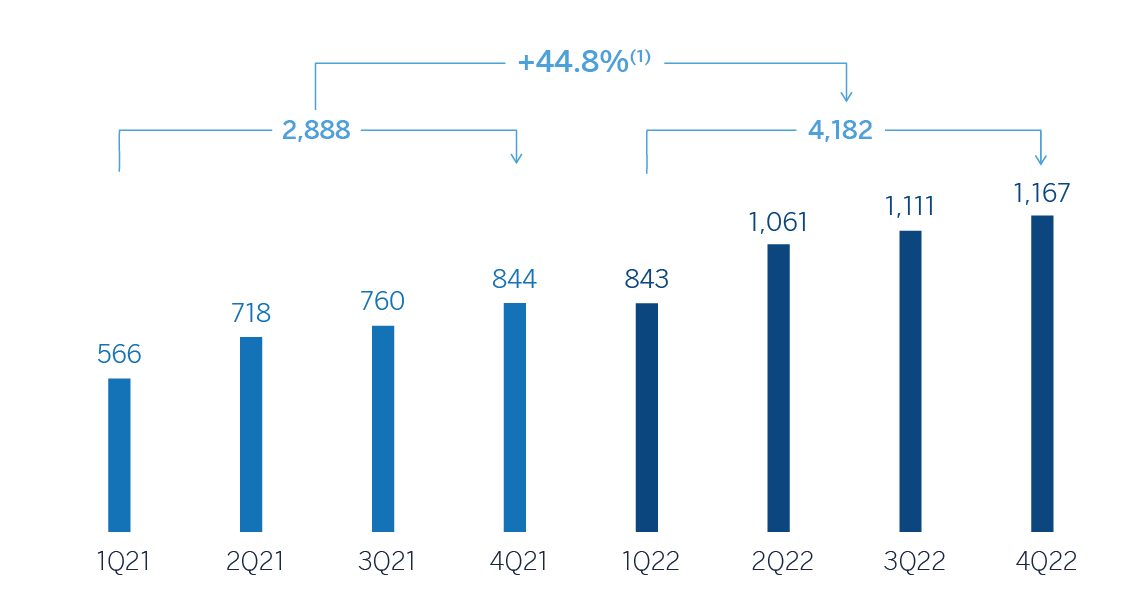
(1) At current exchange rate: +63.9%.
Financial statements and relevant business indicators (Millions of euros and percentage)
| Income statement | 2022 | ∆% | ∆% (1) | 2021 (2) |
|---|---|---|---|---|
| Net interest income | 8,378 | 43.6 | 26.8 | 5,836 |
| Net fees and commissions | 1,621 | 33.9 | 18.3 | 1,211 |
| Net trading income | 439 | 19.9 | 5.9 | 366 |
| Other operating income and expenses | 400 | 110.9 | 86.3 | 190 |
| Gross income | 10,839 | 42.6 | 25.9 | 7,603 |
| Operating expenses | (3,432) | 28.0 | 13.0 | (2,682) |
| Personnel expenses | (1,576) | 31.4 | 16.1 | (1,199) |
| Other administrative expenses | (1,459) | 26.0 | 11.3 | (1,157) |
| Depreciation | (398) | 22.0 | 7.8 | (326) |
| Operating income | 7,406 | 50.5 | 33.0 | 4,921 |
| Impairment on financial assets not measured at fair value through profit or loss | (1,693) | 17.5 | 3.8 | (1,440) |
| Provisions or reversal of provisions and other results | (24) | n.s. | n.s. | 24 |
| Profit (loss) before tax | 5,690 | 62.3 | 43.4 | 3,505 |
| Income tax | (1,507) | 58.1 | 39.7 | (953) |
| Profit (loss) for the period | 4,182 | 63.9 | 44.8 | 2,552 |
| Non-controlling interests | (1) | 60.7 | 42.0 | (0) |
| Net attributable profit (loss) | 4,182 | 63.9 | 44.8 | 2,551 |
- (1) At constant exchange rate.
- (2) Restated balances. For more information, please refer to the “Business Areas” section.
| Balance sheets | 31-12-22 | ∆% | ∆% (1) | 31-12-21 |
|---|---|---|---|---|
| Cash, cash balances at central banks and other demand deposits | 13,228 | 1.9 | (8.2) | 12,985 |
| Financial assets designated at fair value | 40,356 | 14.9 | 3.5 | 35,126 |
| Of which: loans and advances | 1,507 | 80.4 | 62.6 | 835 |
| Financial assets at amortized cost | 84,465 | 29.3 | 16.5 | 65,311 |
| Of which: loans and advances to customers | 71,754 | 28.6 | 15.9 | 55,809 |
| Tangible assets | 1,969 | 13.8 | 2.5 | 1,731 |
| Other assets | 3,387 | 14.7 | 3.4 | 2,953 |
| Total assets/liabilities and equity | 143,405 | 21.4 | 9.4 | 118,106 |
| Financial liabilities held for trading and designated at fair value through profit or loss | 25,840 | 30.2 | 17.3 | 19,843 |
| Deposits from central banks and credit institutions | 4,402 | 34.7 | 21.4 | 3,268 |
| Deposits from customers | 77,750 | 21.5 | 9.5 | 64,003 |
| Debt certificates | 7,758 | (2.8) | (12.4) | 7,984 |
| Other liabilities | 17,825 | 13.0 | 1.8 | 15,779 |
| Regulatory capital allocated | 9,831 | 36.0 | 22.6 | 7,229 |
| Relevant business indicators | 31-12-22 | ∆% | ∆% (1) | 31-12-21 |
|---|---|---|---|---|
| Performing loans and advances to customers under management (2) | 72,311 | 29.3 | 16.5 | 55,926 |
| Non-performing loans | 1,939 | 0.9 | (9.0) | 1,921 |
| Customer deposits under management (2) | 76,785 | 21.2 | 9.2 | 63,349 |
| Off-balance sheet funds (3) | 38,196 | 18.0 | 6.3 | 32,380 |
| Risk-weighted assets | 71,738 | 11.1 | 0.1 | 64,573 |
| Efficiency ratio (%) | 31.7 | 35.3 | ||
| NPL ratio (%) | 2.5 | 3.2 | ||
| NPL coverage ratio (%) | 129 | 106 | ||
| Cost of risk (%) | 2.47 | 2.67 |
- (1) At constant exchange rate.
- (2) Excluding repos.
- (3) Includes mutual funds, customer portfolios and other off-balance sheet funds.
Macro and industry trends
Economic growth surprised on the upside in the second half of 2022, maintaining the relative dynamism observed in the first half of the year. The GDP growth for the year would reach around 3.0%, according to BBVA Research (one percentage point above the previous forecast). The outlook for economic activity in 2023 remains moderate: the GDP is expected to grow by 0.6% in 2023 (unchanged from the previous forecast). The slowdown in the United States economy, the high inflation —which stood at 7.8% at the end of 2022 and could average around 5.1% in 2023— and the high central bank interest rates, which could soon reach 10.75%, will foreseeably contribute to the slowdown in economic growth.
As for the banking system, with data as of the end of November 2022, the lending volume increased by 12.8% year-on-year, with a greater boost from the consumer portfolio (+17.5%) relative to mortgages and businesses (+12.0% and +11.3%, respectively). Total deposits growth moderated slightly to 8.8% year-on-year in November 2022, highlighting the incipient shift towards time deposits (+11.1% year-on-year). The industry's non-performing loans remained stable at around 2.35% in November 2022. Capital ratios are comfortable.
Unless expressly stated otherwise, all the comments below on rates of change, for both activity and results, will be given at constant exchange rate. These rates, together with changes at current exchange rates, can be found in the attached tables of financial statements and relevant business indicators.
Activity
The most relevant aspects related to the area's activity in the year 2022 were:
- Lending activity (performing loans under management) grew 16.5% between January and December 2022, with balanced growth in the wholesale portfolio and retail portfolio. The wholesale portfolio, which includes larger companies and the public sector, recorded a growth of 15.7%, due to commercial efforts to attract and retain new customers. For its part, the retail segment accelerated its rate of growth to 15.3%. Within this segment, consumer loans (+16.0%), mortgage loans (+11.2%), and credit cards (+20.7%) stood out, with an outstanding evolution of the latter in the fourth quarter. The aforementioned has supported a stable composition in lending activity, with a balanced distribution in lending between wholesale portfolio and retail portfolio.
- Customer deposits under management increased during the year 2022 (+9.2%). This performance is explained by both the growth in time deposits and demand deposits. For its part, off-balance sheet funds grew at a rate of 6.3% between January and December 2022.
The most relevant evolution of the area's activity in the fourth quarter of 2022 has been:
- Lending activity increased by 3.5%, with a balanced growth rate in both segments above 3%. In the wholesale segment, the dynamism of loans to government institutions stood out (+10.4%) and, within the retail segment, consumer and credit card portfolios stood out, which benefited from the incentive campaign for closing of the year ("Buen Fin").
- With regard to the asset quality indicators, the NPL ratio remained stable at 2.5% at the end of December 2022, in line with the previous quarter (-3 basis points), as a result of a generalized increase in activity. For its part, the NPL coverage ratio stood at 129% at the end of December 2022, which represents a decrease during the quarter, but a significant increase compared to the end of the previous year .
- Total funds under management increased (+5.5%) with growth in both customer deposits and in mutual funds, highlighting the dynamism of demand deposits (+9.4%).
Results
In Mexico, BBVA achieved a net attributable profit of €4,182m during 2022, representing an increase of 44.8% compared to the year 2021, mainly as a result of the increase in recurring income (net interest income and commissions), due to the strong dynamism of lending activity and the continued improvement in customer spreads, which more than offset the expenses increase in a context of growth and strong activity. For its part, loan-loss provisions remained contained in the year.
The most relevant aspects of the year-on-year changes in the income statement at the end of December 2022 are summarized below:
- Net interest income increased by 26.8%, due to the strong dynamism of lending activity and the effective pricing management, in a context of rising interest rates, with a higher loan yield and a contained cost of deposits in the year.
- Net fees and commissions increased by 18.3% thanks to the higher level of transactions by customers, especially on credit cards, as well as income derived from mutual funds management.
- NTI increased by 5.9%, mainly due to the good results of the Global Markets unit and the foreign exchange operations.
- The other operating income and expenses line recorded a growth of 86.3%, due to higher results of the insurance business as result of the activity dynamism, as well as the release of provisions in a context of rising interest rates.
- Operating expenses increase (+13.0%), mainly due to higher personnel expenses, impacted by wages increases in a context of higher inflation, and higher incentives to sales position and higher variable remuneration in a context of strong growth of activity. The general expenses line also increased, in an environment of rising prices where certain expenses are indexed to inflation, as well as by higher marketing and technology expenses. Notwithstanding the above, there was significant improvement of 361 basis points in the efficiency ratio, which stood at 31.7% compared to 35.3% recorded twelve months earlier.
- Slight increase in the impairment on financial assets line in the year (+3.8%), mainly due to higher loan loss-provisions in the retail portfolio in a higher growth environment. However, the cumulative cost of risk, at the end of December 2022 stood at 2.47%, still below that recorded twelve months earlier.
In the quarter, excluding the exchange rate effect, BBVA Mexico generated a net attributable profit of €1,167m, a growth of 5.1% compared to the previous quarter. This result was driven by the good performance of the net interest income (+8.5%), which benefited again from the improved customer spread and was partially offset by the increase in operating expenses, mainly due to higher personnel expenses, which include an increase of the variable remuneration to employees, and higher tax expenses, in line with the area's results evolution.