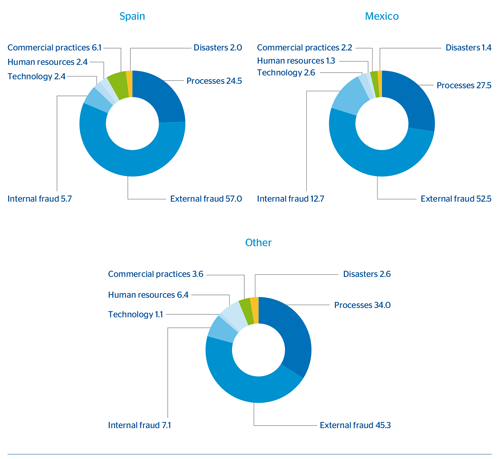

The two charts below show the operational risk profile of BBVA by risk class: distribution of evaluated risk, and distribution of historical operational losses.
BBVA Group. Risk assessed with the Ev-Ro Tool
(Percentage)
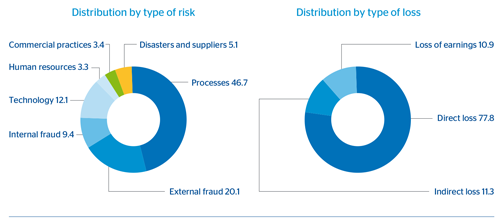
Distribution of historical operational losses
(Percentage)