Turkey
Highlights
- Dynamic activity.
- Solid growth of recurring revenue items.
- Control of operating expenses, with growth below the level of inflation and the area’s gross income.
- Risk indicators affected by the one-off impairment of the wholesale portfolio and the update of the macroeconomic scenario.
Business activity (1)
(Year-on-year change at constant exchange rate. Data as of 30-06-2018)
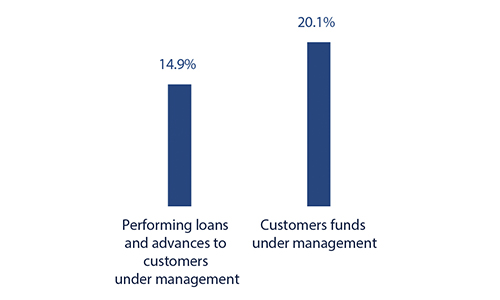
(1) Excluding repos.
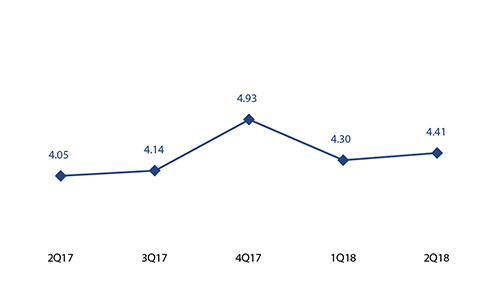
Net interest income/ATAs
(Percentage. Constant exchange rate)
Operating income
(Million euros at constant exchange rate)
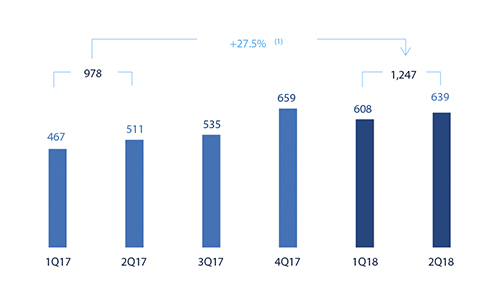
(1) At current exchange rate: 1.3%.
Net attributable profit
(Million euros at constant exchange rate)
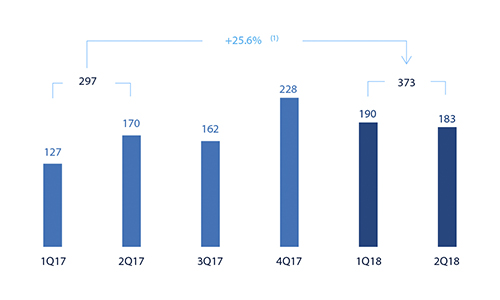
(1) At current exchange rate: -0.2%.
Breakdown of performing loans under management (1)
(30-06-2018)
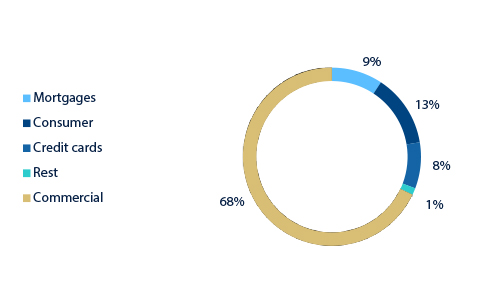
(1) Excluding repos.
Breakdown of customer funds under management (1)
(30-06-2018)
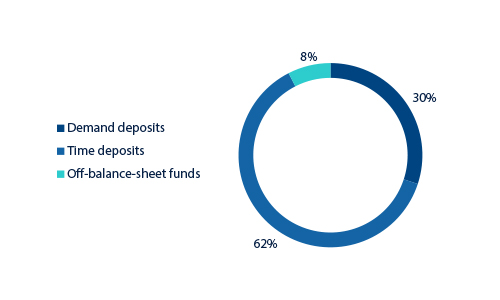
(1) Excluding repos.
Macro and industry trends
According to the most recent figures from the Turkish Statistical Institute, Turkey’s year-on-year economic growth was 7.4% in the first quarter of 2018, supported by the continued positive contribution from solid domestic demand. The cool-down in economic activity could become more evident in the second half of this year, as statistical base effects and tighter financial conditions have a negative effect on domestic demand.
Annual inflation hit 15.4% year-on-year in June, the highest level since December 2013, due to the broad-based acceleration in core prices and exceptional food inflation because of bad weather conditions. Also, the pass-through effect of accelerated exchange-rate depreciation led core inflation to jump up to 14.6% year-on-year.
The CBRT increased its funding interest rate by 500 bps to 17.75%, simplified its monetary policy framework and provided some supporting liquidity measures following its March meeting. The CBRT's goal is to reinforce its stance on inflation worries in the short term and take a solid step to restore credibility in the face of worsening inflation expectations.
In the Turkish financial sector, year-on-year credit growth decelerated throughout the first half of 2018, mainly due to business lending. As of the end of June 2018, the year-on-year growth rate in total lending (adjusted for the effect of the depreciation of the lira) stood at 14%. Deposits from customers also showed some slowdown. The year-on-year growth rate in total deposits fell to 8.7% (also adjusted for the effect of the depreciation of the lira). Turkish-lira deposits grew by 13.2% and foreign-currency deposits (in U.S. dollars) contracted by 2.3%. Lastly, the NPL ratio in the sector remained stable and closed the month of June at 2.9%.
Activity
Unless expressly stated otherwise, all the comments below on rates of change, for both activity and earnings, will be given at constant exchange rate. These rates, together with changes at current exchange rate, can be seen in the attached tables of financial statements and relevant business indicators.
The most relevant aspects related to the area’s activity year-to-date as of 30-June-2018 were:
- Lending activity (performing loans under management) in the area grew by 9.2% in the first six months (up 14.9% in year-on-year terms), mainly driven by moderate growth in Turkish-lira loans, while foreign-currency loans (in U.S. dollars) declined.
- By segments, Garanti continued to perform favorably in Turkish-lira business banking loans. Also, Garanti outperformed the sector in consumer general purpose loans and in auto loans. In mortgages, Garanti once more gained market share among Turkish private banks. Finally, there was growth in both consumer and corporate credit card balances, where Garanti strengthened its leading position.
- In terms of asset quality, the NPL ratio closed at 4.5% and the NPL coverage ratio stood at 76%.
- Customer deposits (58% of total liabilities in the area as of 30-June-2018) remained the main source of funding for the balance sheet in Turkey and grew by 11.5% in the half-year (up 20.3% in year-on-year terms), supported by growth showed by Turkish-lira deposits. Demand deposits performed well, both in Turkish lira and foreign currency, and continued to be the main support for the growth of net interest income (since they have almost zero cost), with a weight of 32% of total customer deposits. Additionally, deposits from retail and SMEs segments continued to be a focus of activity in the first half of 2018, supporting low funding costs.
Results
Turkey generated a cumulative net attributable profit of €373m in the first half of 2018, which represents a 25.6% rise in year-on-year terms. The most significant aspects of the year-on-year changes in the income statement were as follows:
- Positive performance of net interest income (up 17.9%). This positive trend is, above all, a result of the increase in activity, good management of customer spreads (despite the funding cost increase) and higher income from inflation-linked bonds.
- Income from fees and commissions grew by 32.8%. This significant increase was mainly driven by the good performance in payment systems, cash loan, insurance fees and other diversified fee-and-commission areas.
- Decrease in NTI (down 42.7%) due to lower results from the sale of securities and the non-performing-loan portfolio, partially offset by gains in derivatives and in exchange differences.
- Overall, gross income was up 21.2% in the first half of 2018 compared to the same period of 2017, thanks to increased core banking activities.
- Operating expenses were up by 11.0%, slightly below the average inflation rate (11.5%) and well below the year-on-year growth rate in gross income, thanks to the strict cost-control discipline. As a result, the efficiency ratio declined to 35.2%.
- Impairment losses on financial assets rose by 66.3%, due to more demanding IFRS 9 criteria reflected on staging, some negative impacts from wholesale-customer impairment and update of the macroeconomic scenario. As a result, the cumulative cost of risk of the area stood at 1.23%.
Financial statements and relevant business indicators (Million euros and percentage)
| IFRS 9 | IAS 39 | ||||
|---|---|---|---|---|---|
| Income statement | 1H18 | ∆% | ∆%(1) | 1H17 | |
| Net interest income | 1,510 | (6.3) | 17.9 | 1,611 | |
| Net fees and commissions | 371 | 5.5 | 32.8 | 352 | |
| Net trading income | 4 | (54.5) | (42.7) | 9 | |
| Other operating income and expenses | 39 | 48.7 | 87.1 | 26 | |
| Gross income | 1,924 | (3.7) | 21.2 | 1,998 | |
| Operating expenses | (677) | (11.8) | 11.0 | (768) | |
| Personnel expenses | (356) | (12.5) | 10.1 | (407) | |
| Other administrative expenses | (242) | (9.4) | 14.0 | (267) | |
| Depreciation | (78) | (15.7) | 6.1 | (93) | |
| Operating income | 1,247 | 1.3 | 27.5 | 1,230 | |
| Impairment on financial assets not measured at fair value through profit or loss | (315) | 32.2 | 66.3 | (239) | |
| Provisions or reversal of provisions and other results | 34 | 91.7 | 141.2 | 18 | |
| Profit/(loss) before tax | 966 | (4.3) | 20.4 | 1,010 | |
| Income tax | (210) | 4.9 | 32.1 | (201) | |
| Profit/(loss) for the year | 756 | (6.6) | 17.5 | 809 | |
| Non-controlling interests | (383) | (12.2) | 10.5 | (436) | |
| Net attributable profit | 373 | (0.2) | 25.6 | 374 | |
| IFRS 9 | IAS 39 | ||||
|---|---|---|---|---|---|
| Balance sheets | 30-06-18 | ∆% | ∆%(1) | 31-12-17 | |
| Cash, cash balances at central banks and other demand deposits | 4,171 | 3.3 | 21.3 | 4,036 | |
| Financial assets designated at fair value | 5,886 | (8.3) | 7.7 | 6,419 | |
| of which loans and advances | - | - | - | - | |
| Financial assets at amortized cost | 59,844 | (8.1) | 8.0 | 65,083 | |
| of which loans and advances to customers | 48,530 | (5.5) | 10.9 | 51,378 | |
| Tangible assets | 1,174 | (12.7) | 2.6 | 1,344 | |
| Other assets | 1,744 | (3.7) | 13.0 | 1,811 | |
| Total assets/liabilities and equity | 72,818 | (7.5) | 8.7 | 78,694 | |
| Financial liabilities held for trading and designated at fair value through profit or loss | 2,027 | 213.1 | 267.6 | 648 | |
| Deposits from central banks and credit institutions | 9,506 | (15.1) | (0.3) | 11,195 | |
| Deposits from customers | 42,309 | (5.3) | 11.2 | 44,691 | |
| Debt certificates | 6,591 | (21.0) | (7.3) | 8,346 | |
| Other liabilities | 10,061 | (11.1) | 4.4 | 11,321 | |
| Economic capital allocated | 2,323 | (6.8) | 9.4 | 2,493 | |
| Relevant business indicators | 30-06-18 | ∆% | ∆%(1) | 31-12-17 |
|---|---|---|---|---|
| Performing loans and advances to customers under management (2) | 47,840 | (7.0) | 9.2 | 51,438 |
| Non-performing loans | 2,811 | 10.1 | 29.3 | 2,553 |
| Customer deposits under management (2) | 42,299 | (5.0) | 11.5 | 44,539 |
| Off-balance sheet funds (3) | 3,440 | (11.8) | 3.5 | 3,902 |
| Risk-weighted assets | 58,770 | (6.4) | 9.9 | 62,768 |
| Efficiency ratio (%) | 35.2 | 36.5 | ||
| NPL ratio (%) | 4.5 | 3.9 | ||
| NPL coverage ratio (%) | 76 | 85 | ||
| Cost of risk (%) | 1.23 | 0.82 |
(1) Figures at constant exchange rate.
(2) Excluding repos.
(3) Includes mutual funds, pension funds and other off-balance-sheet funds.