Annex
Corporate & Investment Banking
Highlights
- Continued environment of pressure on margins and excess liquidity is maintained.
- Recovery in lending activity over the quarter.
- Containment of expenses and impairments.
Business activity (1)
(Year-on-year change at constant exchange rates. Data as of 30-06-2018)
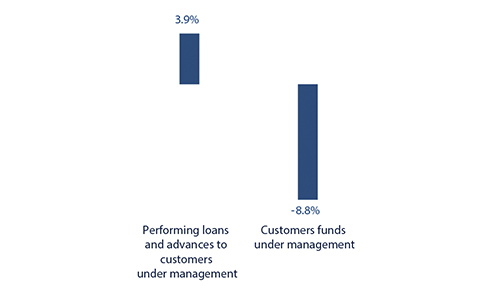
(1) Excluding repos.
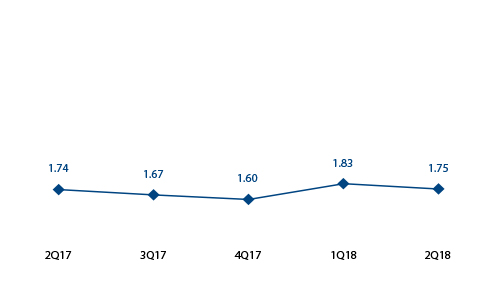
Gross income/ATAs
(Percentage. Constant exchange rates)
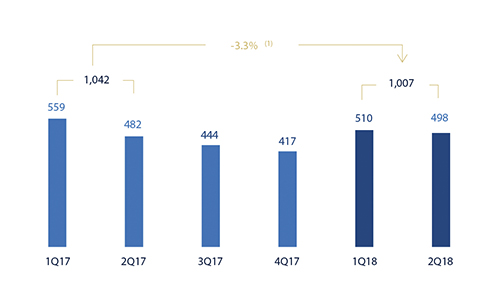
Operating income
(Million euros at constant exchange rates)
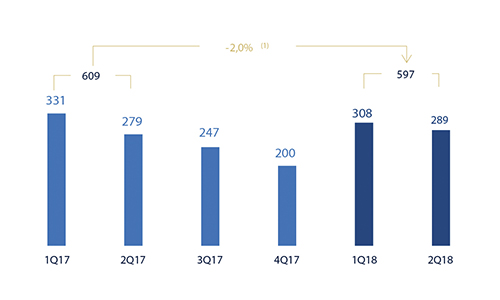
Net attributable profit
(Million euros at constant exchange rates)
(1) At current exchange rate: -12.1%.
(1) At current exchange rate: -9.8%.
Breakdown of performing loans under management (1)
(30-06-2018)
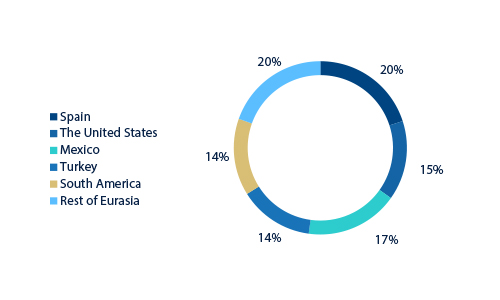
(1) Excluding repos.
Breakdown of customer funds under management (1)
(30-06-2018)
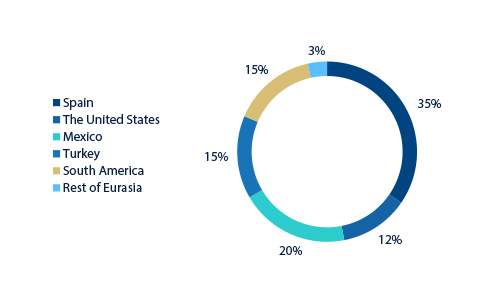
(1) Excluding repos.
Financial market trends
In the second quarter of the year, the financial markets were influenced by a tightening of global financial conditions, above all an appreciation of the dollar and an increase in interest rates in the United States. This situation caused a readjustment of the risk assessment in emerging countries, which forced several central banks to tighten their monetary policy. The escalation in trade tensions between the United States and China is a further source of uncertainty, which could make the market move towards a more risk-averse environment and anchor the interest rates of long-term debt.
In Europe, peripheral risk reappeared with the new government coalition in Italy. The country's risk premium against the German Bund increased significantly and infected the rest of the peripheral countries to a certain extent. This episode had global repercussions: refuge in German and American bonds and depreciation of the euro.
Despite the process of adjustment in emerging countries, the Fed and the ECB continued with the normalization of their monetary policies, as has been discussed throughout this report. The divergence between these monetary policies also contributed to the appreciation of the dollar against the euro.
Activity
All the comments below on rates of change, for both activity and earnings, will be given at constant exchange rate, unless expressly stated otherwise. These rates, together with changes at the current exchange rate, can be seen in the attached tables of financial statements and relevant business indicators.
The most relevant aspects related to the area’s activity year-to-date as of 30-June-2018 were:
- The market context remains unchanged, with margins squeezed and excess liquidity. Lending (performing loans under management) showed signs of recovery compared to the end of the first quarter of 2018, and grew by 6.6% year-to-date and 3.9% year-on-year. By geography, it grew in Mexico, Turkey, South America and Rest of Eurasia, while it fell in Spain and the United States.
- Decrease in customer funds (down 12.0% year-to-date and down 8.8% year-on-year). The figures varied by geography, with growth in Mexico, South America and Turkey and decline in Spain, the United States and Rest of Eurasia.
- In the mergers & acquisitions (M&A) business, activity in Spain and Portugal during the quarter continued to be positive, driven by the same factors that boosted the market throughout 2017 and influenced by the rebound of foreign direct investment. The availability of liquidity, the attractive financing conditions and the economic growth situation in Spain are expected to continue to stimulate the market during the second half of the year.
- In the Equity Capital Markets Unit (ECM), the second quarter of the year was characterized by some instability in the markets and high levels of volatility. The outlook for activity for the rest of the year is positive, thanks to the mandates achieved, many of which could be completed after the summer.
- BBVA's leadership in the green loan, market was reflected in the 17 transactions structured and led in the last 18 months, representing a total value of €11.7 billion, in a market of about €28.4 billion (approximately 41% of the total). This makes BBVA the most active financial institution in this business internationally.
Results
CIB registered a net attributable profit in the first half of €597m, down 2.0% on the first half of 2017. The highlights of the year-on-year changes in the income statement in this aggregate are summarized below:
- Increase in net interest income (up 7.7% on year-on-year terms), driven by good performance in the United States, Mexico, South America and Turkey.
- Net fees and commissions showed a flat performance.
- Rise in NTI (up 6.2%), thanks to favorable performance in recurring activity with customers and an adequate risk management arising from this activity and carried out by the Global Market Unit. All this despite the convulsive in the markets, especially in the second quarter of 2018, and the fact that they compare with an exceptionally high first half of 2017.
- This, together with the negative impact of the other income and expenses, explains the year-on-year decrease of 2.1% in gross income.
- Operating expenses remained stable (up 0.4%). The key elements were once more reduction of personnel and discretionary expenses, and moderation of costs associated with the investment plan in technology.
- Finally, there was a positive performance of impairment losses on financial assets, which decreased by 83.5%, mainly as a result of lower provision needs in Spain and a reduction in risk due to the improved ratings of some customers in the energy sector in the United States.
Financial statements and relevant business indicators (Million euros and percentage)
| IFRS 9 | IAS 39 | ||||
|---|---|---|---|---|---|
| Income statement | 1H18 | ∆% | ∆%(1) | 1H17 | |
| Net interest income | 663 | (2.2) | 7.7 | 678 | |
| Net fees and commissions | 376 | (8.5) | (0.1) | 411 | |
| Net trading income | 494 | (1.9) | 6.2 | 504 | |
| Other operating income and expenses | (13) | n.s. | n.s. | 94 | |
| Gross income | 1,520 | (9.9) | (2.1) | 1,687 | |
| Operating expenses | (513) | (5.1) | 0.4 | (541) | |
| Personnel expenses | (228) | (11.0) | (6.7) | (256) | |
| Other administrative expenses | (230) | (0.8) | 7.2 | (232) | |
| Depreciation | (55) | 3.9 | 5.9 | (53) | |
| Operating income | 1,007 | (12.1) | (3.3) | 1,146 | |
| Impairment on financial assets not measured at fair value through profit or loss | (3) | (87.1) | (83.5) | (20) | |
| Provisions or reversal of provisions and other results | (20) | (14.5) | (15.9) | (24) | |
| Profit/(loss) before tax | 984 | (10.7) | (1.7) | 1,103 | |
| Income tax | (263) | (10.3) | (2.2) | (293) | |
| Profit/(loss) for the year | 721 | (10.9) | (1.6) | 809 | |
| Non-controlling interests | (124) | (15.8) | 0.7 | (147) | |
| Net attributable profit | 597 | (9.8) | (2.0) | 662 | |
- (1) Figures at constant exchange rates.
| IFRS 9 | IAS 39 | ||||
|---|---|---|---|---|---|
| Balance sheets | 30-06-18 | ∆% | ∆%(1) | 31-12-17 | |
| Cash, cash balances at central banks and other demand deposits | 3,050 | (27.4) | (29.2) | 4,200 | |
| Financial assets designated at fair value | 99,619 | 36.7 | 36.0 | 72,878 | |
| of which loans and advances | 23,583 | n.s. | n.s. | 648 | |
| Financial assets at amortized cost | 66,960 | (28.7) | (27.9) | 93,948 | |
| of which loans and advances to customers | 59,033 | (12.6) | (11.3) | 67,529 | |
| Inter-area positions | - | - | - | - | |
| Tangible assets | 32 | (8.8) | (7.1) | 35 | |
| Other assets | 4,693 | 100.4 | 102.2 | 2,342 | |
| Total assets/liabilities and equity | 174,354 | 0.5 | 0.9 | 173,403 | |
| Financial liabilities held for trading and designated at fair value through profit or loss | 79,926 | 62.9 | 62.8 | 49,060 | |
| Deposits from central banks and credit institutions | 16,409 | (63.9) | (64.2) | 45,427 | |
| Deposits from customers | 40,978 | (16.0) | (15.1) | 48,792 | |
| Debt certificates | 1,078 | 106.1 | 105.7 | 523 | |
| Inter-area positions | 26,401 | 21.7 | 24.8 | 21,687 | |
| Other liabilities | 5,992 | 53.3 | 52.4 | 3,908 | |
| Economic capital allocated | 3,569 | (10.9) | (10.0) | 4,007 | |
- (1) Figures at constant exchange rates.
| IFRS 9 | IAS 39 | ||||
|---|---|---|---|---|---|
| Relevant business indicators | 30-06-18 | ∆% | ∆%(1) | 31-12-17 | |
| Performing loans and advances to customers under management (2) | 58,926 | 4.6 | 6.6 | 56,315 | |
| Non-performing loans | 579 | (0.9) | (2.2) | 584 | |
| Customer deposits under management (2) | 37,996 | (13.8) | (12.7) | 44,095 | |
| Off-balance sheet funds (3) | 1,360 | 0.2 | 7.4 | 1,357 | |
| Efficiency ratio (%) | 33.7 | 34.1 | |||
- (1) Figures at constant exchange rates.
- (2) Excluding repos.
- (3) Includes mutual funds, pension funds and other off-balance-sheet funds.