The United States
Highlights
- Lending growth supported by consumer and business financing.
- Positive performance of net interest income and provisions.
- Improvement in efficiency.
- Net attributable profit affected by the tax reform at the end of 2017.
Business activity (1)
(Year-on-year change at constant exchange rate. Data as of 30-06-2018)

(1) Excluding repos.
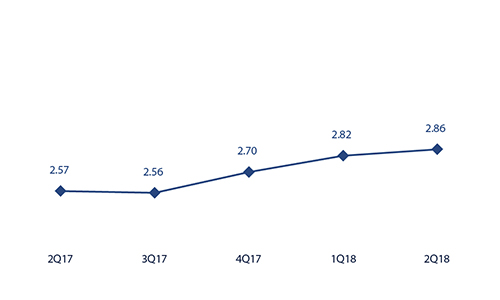
Net interest income/ATAs
(Percentage. Constant exchange rate)
Operating income
(Million euros at constant exchange rate)

(1) At current exchange rate: 8.1%.
Net attributable profit
(Million euros at constant exchange rate)
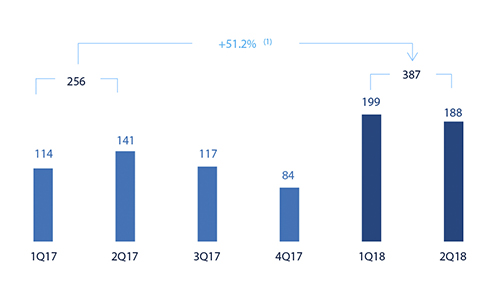
(1) At current exchange rate: 36.3%.
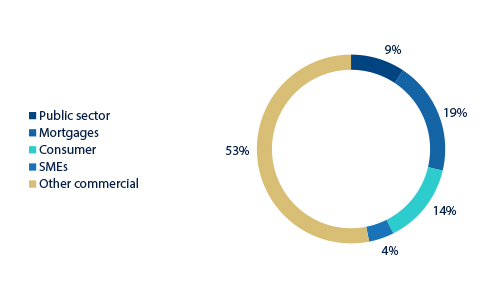
Breakdown of performing loans under management (1)
(30-06-2018)
Breakdown of customer funds under management (1)
(30-06-2018)
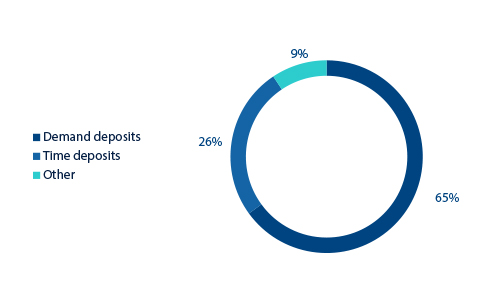
(1) Excluding repos.
(1) Excluding repos.
Macro and industry trends
According to the latest available information from the Bureau of Economic Analysis (BEA), U.S. GDP grew by 2.0% in the first quarter of 2018, showing moderation with respect to the end of last year. Despite this slowdown, both investment and consumption remained robust and continued to contribute positively to growth. Private consumption, both goods and services, continued to be supported by solid fundamentals, such as the dynamism of the labor market and the higher growth of wages, which added to the optimism of households. Given this context, the strength of domestic demand, partly driven by a more expansive fiscal policy, and the rebound in the price of oil, accelerated inflation to 2.8% (May data). The Fed continued with its monetary policy normalization, with two increases of official interest rates of 25 basis points each during the first half of 2018 (up to the 1.75-2.0% range). It is expected to continue on this path for the remainder of the year.
The persistence of the expansive U.S. cycle has combined with the resurgence of uncertainty and financial volatility associated with factors that include fear of escalating protectionism and a greater perception of the risk of vulnerability in emerging markets. As a result, the U.S. dollar experienced a substantial appreciation in the second quarter of 2018, amounting to 2.9% based on data at the end of June.
The general situation of the country's banking system continued to be very positive. According to the latest available data from the Fed through May 2018, the total volume of bank credit in the system increased by 3.0% over the last twelve months, with growth in all the main portfolios. At the same time, deposits showed a behavior similar to that of credit, with a year-on-year increase of 3.5%. Lastly, non-performing loans continued their downward trend, with an NPL ratio of 1.7% at the end of the first quarter of 2018.
Activity
Unless expressly stated otherwise, all the comments below on rates of change, for both activity and earnings, will be given at constant exchange rate. These rates, together with changes at current exchange rate, can be seen in the attached tables of financial statements and relevant business indicators.
The most relevant aspects related to the area’s activity year-to-date as of 30-June-2018 were:
- Lending activity in the area (performing loans under management) showed an increase of 1.9% year-to-date and 4.1% year-on-year.
- By portfolio, higher interest rates led to a decline in mortgages and loans to developers (construction real estate). In contrast, consumer and credit card loans, which have higher margins and are therefore more profitable, increased by 12.1% year-to-date. Both loans to SMEs (up 9.1%) and corporates (up 3.8%) also performed well.
- With respect to asset quality, risk indicators in the area continued to be solid. The NPL ratio remained at 1.2%. The NPL coverage ratio closed the quarter at 93%.
- Customer deposits under management decreased 2.8% year-to-date, but had a year-on-year increase of 6.0%, thanks to deposit-gathering campaigns launched in 2017. It is worth noting that the second quarter of each year are those when bank deposits are most affected by seasonal factors.
Regarding BBVA Compass’ capital plan, on June, 28 the Fed announced that it had not objected to neither the plan nor the proposed capital actions. This is the fifth consecutive year that BBVA Compass has obtained this result.
Results
The United States generated a cumulative net attributable profit of €387m in the first half of 2018, up 51.2% year-on-year, due mainly to the increase in net interest income, lower provisions and lower tax expenses as a result of a reduction in the effective tax rate following the tax reform approved in the last quarter of 2017. Also worth noting are the following:
- Net interest income continued to perform positively, with the cumulative figure up by 12.0% year-on-year and 3.0% over the quarter. This was due partly to the Fed's interest-rate hikes, but also the strategic measures adopted by BBVA Compass to improve loan yields (boosting consumer financing) and reduce the cost of deposits (improved deposit mix and wholesale funding).
- Net fees and commissions were flat (down 0.1% year-on-year), due to a lower contribution from markets, investment banking and money transfers. Nevertheless, there was an increase of 0.8% over the quarter.
- NTI was down by 3.4% on the figure for the first six months of the previous year, due to lower income from interest-rate derivatives, partly offset by favorable trading gains from bonds and exchange rates.
- Operating expenses grew by 5.6% year-on-year, below the growth of gross income (up 10.7%). As a result, there was an improvement in the efficiency ratio.
- Impairment losses on financial assets fell by 38.1% in the last twelve months, due to the lower provisioning requirements in those portfolios affected by the 2017 hurricanes. As a result, the cumulative cost of risk through 30-June-2018 declined to 0.23%.
Financial statements and relevant business indicators
(Million euros and percentage)
| IFRS 9 | IAS 39 | ||||
|---|---|---|---|---|---|
| Income statement | 1H18 | ∆% | ∆%(1) | 1H17 | |
| Net interest income | 1,082 | 0.3 | 12.0 | 1,078 | |
| Net fees and commissions | 302 | (10.2) | (0.1) | 336 | |
| Net trading income | 49 | (11.7) | (3.4) | 55 | |
| Other operating income and expenses | 4 | n.s. | n.s. | (24) | |
| Gross income | 1,437 | (0.6) | 10.7 | 1,446 | |
| Operating expenses | (891) | (5.3) | 5.6 | (941) | |
| Personnel expenses | (512) | (6.1) | 4.7 | (545) | |
| Other administrative expenses | (293) | (1.9) | 9.3 | (299) | |
| Depreciation | (86) | (11.5) | (1.1) | (97) | |
| Operating income | 546 | 8.1 | 20.2 | 505 | |
| Impairment on financial assets not measured at fair value through profit or loss | (63) | (44.7) | (38.1) | (113) | |
| Provisions or reversal of provisions and other results | 12 | n.s. | n.s. | (5) | |
| Profit/(loss) before tax | 495 | 28.0 | 42.1 | 386 | |
| Income tax | (108) | 5.1 | 16.9 | (103) | |
| Profit/(loss) for the year | 387 | 36.3 | 51.2 | 284 | |
| Non-controlling interests | - | - | - | - | |
| Net attributable profit | 387 | 36.3 | 51.2 | 284 | |
| IFRS 9 | IAS 39 | ||||
|---|---|---|---|---|---|
| Balance sheets | 30-06-18 | ∆% | ∆%(1) | 31-12-17 | |
| Cash, cash balances at central banks and other demand deposits | 4,655 | (34.8) | (36.6) | 7,138 | |
| Financial assets designated at fair value | 10,633 | (3.9) | (6.6) | 11,068 | |
| of which loans and advances | 225 | n.s. | 290.4 | 56 | |
| Financial assets at amortized cost | 58,969 | 7.8 | 4.8 | 54,705 | |
| of which loans and advances to customers | 56,975 | 6.1 | 3.1 | 53,718 | |
| Inter-area positions | - | - | - | - | |
| Tangible assets | 661 | 0.4 | (2.4) | 658 | |
| Other assets | 2,252 | 2.1 | (0.8) | 2,207 | |
| Total assets/liabilities and equity | 77,171 | 1.8 | (1.0) | 75,775 | |
| Financial liabilities held for trading and designated at fair value through profit or loss | 389 | 179.2 | 171.4 | 139 | |
| Deposits from central banks and credit institutions | 3,119 | (12.9) | (15.3) | 3,580 | |
| Deposits from customers | 60,704 | (0.2) | (3.0) | 60,806 | |
| Debt certificates | 3,227 | 60.0 | 55.5 | 2,017 | |
| Inter-area positions | 1,870 | 68.5 | 63.8 | 1,110 | |
| Other liabilities | 4,945 | (8.9) | (11.5) | 5,431 | |
| Economic capital allocated | 2,916 | 8.3 | 5.3 | 2,693 | |
| Relevant business indicators | 30-06-18 | ∆% | ∆%(1) | 31-12-17 |
|---|---|---|---|---|
| Performing loans and advances to customers under management (2) | 56,658 | 4.9 | 1.9 | 54,036 |
| Non-performing loans | 718 | 3.1 | 0.3 | 696 |
| Customer deposits under management (2) | 60,810 | 0.0 | (2.8) | 60,806 |
| Off-balance sheet funds (3) | - | - | - | - |
| Risk-weighted assets | 61,473 | 4.7 | 1.8 | 58,688 |
| Efficiency ratio (%) | 62.0 | 64.4 | ||
| NPL ratio (%) | 1.2 | 1.2 | ||
| NPL coverage ratio (%) | 93 | 104 | ||
| Cost of risk (%) | 0.23 | 0.43 |
- (1) Figures at constant exchange rate.
- (2) Excluding repos.
- (3) Includes mutual funds, pension funds and other off-balance-sheet funds.