Banking activity in Spain
Highlights
- Positive trend in lending activity over the quarter.
- Favorable performance of more recurrent revenue.
- Improvement of efficiency due to the steady reduction of expenses.
- Lower impairments and provisions, solid asset-quality indicators.
Business activity (1)
(Year-on-year change. Data as of 30-06-2018)
(1) Excluding repos.
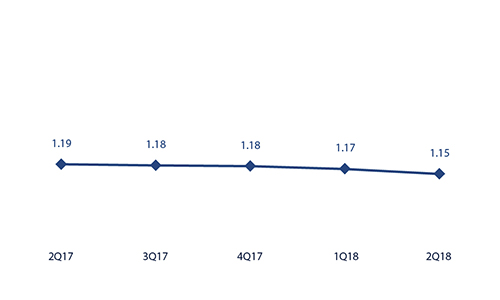
Net interest income/ATAs
(Percentage)
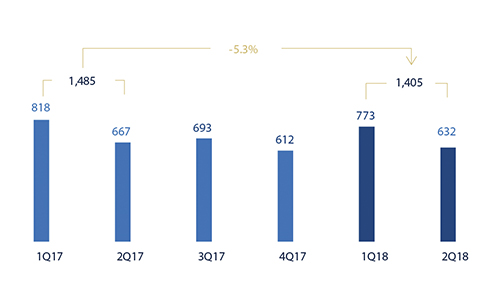
Operating income (Million euros)
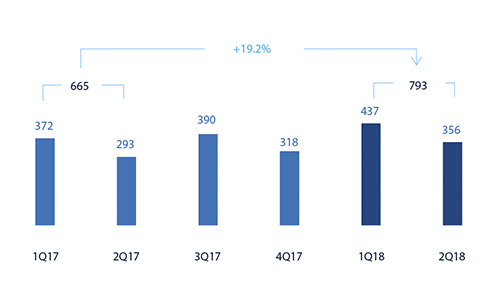
Net attributable profit (Million euros)
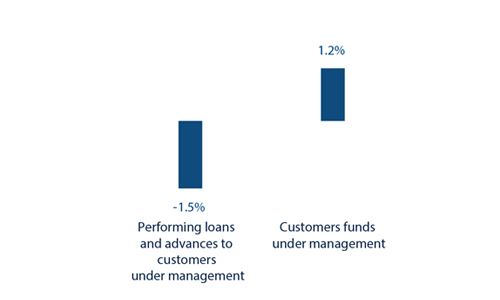
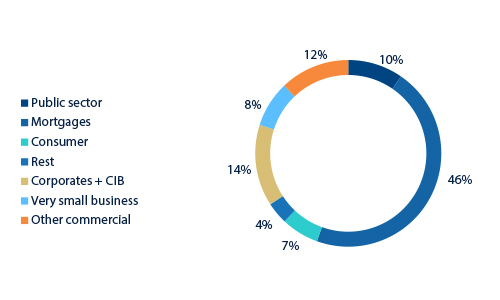
Breakdown of performing loans under management (1)
(30-06-2018)
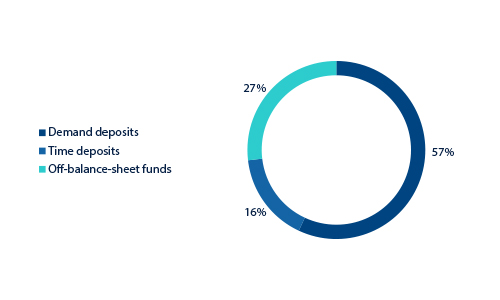
Breakdown of customer funds under management (1)
(30-06-2018)
(1) Excluding repos.
(1) Excluding repos.
Macro and industry trends
According to the latest information from the National Institute of Statistics (INE for its acronym in Spanish), the Spanish economy grew quarterly by 0.7% in the first quarter of 2018, continuing its relatively stable performance since the middle of last year. The most recent indicators show that this solid advance of the GDP has continued further into this year, despite increased uncertainty, supported by robust domestic factors related to the improvement of the labor market. The financial conditions will continue to be favorable, while the recent depreciation of the euro could give an additional boost to exports.
Regarding the Spanish banking system and according to April 2018 data from the Bank of Spain (latest published data), the total volume of lending to the private sector (household and corporate) continued to decline year-on-year (down 3.3%). Non-performing loans in the sector decreased significantly (down 26.0% year-on-year as of April 2018) due to the completion of a major sale of real-estate assets by one of the entities in the system. At the end of April, the sector’s NPL ratio was 6.8%, that is 23.5% below the figure registered a year earlier. The system's liquidity level at the end of the first quarter of 2018 continued to be comfortable: the funding gap (difference between the volume of loans and total deposits) fell to €92.96 billion, 3.6% of the total balance sheet of the system.
Activity
The most relevant aspects related to the area’s activity year-to-date as of 30-June-2018 were:
- Lending (performing loans under management) was down by 0.8% compared to the figure at the end of December 2017 (down 1.5% year-on-year), mainly due to the reduction in the mortgage portfolio (down 1.6% year-to-date) and in the public sector, corporates and other commercial portfolios (down 5.3% as a whole for the same period). In contrast, consumer financing and credit cards (up 12.6% over the last six months) and very small businesses (up 4.4%) remained strong. This explains the quarter-on-quarter growth rate of the lending balance (up 1.6%), with significant increases in the new-loan production of the aforementioned portfolios. It is worth noting that in the first half of 2018 there was a transfer of the outstanding portfolio of performing loans to developers for an amount exceeding €200m from Non Core Real Estate to Banking Activity in Spain.
- In asset quality, there was a further reduction in non-performing loans balances that positively affected the area’s NPL ratio, which reduced by 17 basis points over the last three months to 5.2%. The NPL coverage ratio closed at 57%.
- Customer deposits under management grew by 2.6% over the last three months and remained flat compared to the close of December 2017 (down 0.5%). By products, there was a further decline in time deposits (down 19.8% year-to-date), which has been practically offset by the increase in demand deposits (up 6.9%).
- There was a positive trend in off-balance-sheet funds, despite the unfavorable market performance, with a year-to-date growth of 2.9% (up 8.5% year-on-year). This performance continued to be largely supported by the growth in mutual funds (up 5.5% year-to-date and up 13.5% year-on-year).
Results
The net attributable profit generated by the Banking Activity in Spain in the first half of 2018 reached €793m, which represents a year-on-year increase of 19.2%, strongly supported by the favorable performance of more recurrent revenue, operating expenses and provisions. The year-on-year highlights of the area’s income statement are:
- Net interest income in the first half declined year-on-year by 1.5% and quarterly by 0.5%. The smaller contribution from targeted longer-term refinancing operations (TLTRO) explains most of this decline.
- Positive performance of net fees and commissions (up 8.6%), which offset the decline in net interest income. There was a significant contribution from fees from mutual and pension funds and banking commissions (especially those associated with account maintenance). Over the quarter, the growth of this heading reached 6.5%.
- Lower contribution from NTI compared to the same period the previous year (down 11.4%), associated with lower ALCO portfolio sales, but also due to comparison with the exceptionally good first half of last year.
- Reduction in other income/expenses. One of the aspects explaining this is the greater contribution made to the SRF compared to the same period of 2017. Also, net earnings from the insurance business showed a growth of 12.7% (up 6.0% over the quarter).
- As a result, there was a decline in gross income of 4.7%.
- Operating expenses continued the downward trend observed in previous periods (down 4.1% year-on-year). The efficiency ratio closed at 53.9%, below the figure registered six months earlier (54.9%), and operating income fell by 5.3%.
- Decline in impairment losses on financial assets (down 42.2% year-on-year) explained by lower gross additions to NPL and loan-loss provisions for large customers. As a result, the cumulative cost of risk stood at 0.21% as of 30-June-2018.
- Lastly, provisions (net) and other gains (losses) were favorable, with a year-on-year decline of 51.1%.
Financial statements and relevant business indicators (Million euros and percentage)
| IFRS 9 | IAS 39 | |||||
|---|---|---|---|---|---|---|
| Income statement | 1H18 | ∆% | 1H17 | |||
| Net interest income | 1,836 | (1.5) | 1,864 | |||
| Net fees and commissions | 850 | 8.6 | 783 | |||
| Net trading income | 282 | (11.4) | 318 | |||
| Other operating income and expenses | 82 | (65.1) | 234 | |||
| of which Insurance activities (1) | 235 | 12.7 | 209 | |||
| Gross income | 3,050 | (4.7) | 3,200 | |||
| Operating expenses | (1,644) | (4.1) | (1,715) | |||
| Personnel expenses | (935) | (3.0) | (965) | |||
| Other administrative expenses | (565) | (3.8) | (587) | |||
| Depreciation | (144) | (12.0) | (163) | |||
| Operating income | 1,405 | (5.3) | 1,485 | |||
| Impairment on financial assets not measured at fair value through profit or loss | (175) | (42.2) | (302) | |||
| Provisions or reversal of provisions and other results | (121) | (51.1) | (247) | |||
| Profit/(loss) before tax | 1,110 | 18.7 | 936 | |||
| Income tax | (316) | 17.5 | (269) | |||
| Profit/(loss) for the year | 795 | 19.1 | 667 | |||
| Non-controlling interests | (2) | 14.7 | (1) | |||
| Net attributable profit | 793 | 19.2 | 665 | |||
- (1) Includes premiums received net of estimated technical insurance reserves.
| IFRS 9 | IAS 39 | |||||
|---|---|---|---|---|---|---|
| Balance sheets | 30-06-18 | ∆% | 31-12-17 | |||
| Cash, cash balances at central banks and other demand deposits | 14,565 | 8.2 | 13,463 | |||
| Financial assets designated at fair value | 103,641 | 30.4 | 79,501 | |||
| of which loans and advances | 23,319 | n.s. | 1,312 | |||
| Financial assets at amortized cost | 196,145 | (11.4) | 221,391 | |||
| of which loans and advances to customers | 170,055 | (7.2) | 183,172 | |||
| Inter-area positions | 5,319 | 194.6 | 1,806 | |||
| Tangible assets | 950 | 8.4 | 877 | |||
| Other assets | 4,983 | 109.4 | 2,380 | |||
| Total assets/liabilities and equity | 325,603 | 1.9 | 319,417 | |||
| Financial liabilities held for trading and designated at fair value through profit or loss | 68,867 | 87.1 | 36,817 | |||
| Deposits from central banks and credit institutions | 40,751 | (34.5) | 62,226 | |||
| Deposits from customers | 173,441 | (2.4) | 177,763 | |||
| Debt certificates | 32,516 | (2.4) | 33,301 | |||
| Inter-area positions | - | - | - | |||
| Other liabilities | 1,985 | n.s. | 391 | |||
| Economic capital allocated | 8,043 | (9.8) | 8,920 | |||
| Relevant business indicators | 30-06-18 | ∆% | 31-12-17 |
|---|---|---|---|
| Performing loans and advances to customers under management (1) | 165,905 | (0.8) | 167,291 |
| Non-performing loans | 10,136 | (6.4) | 10,833 |
| Customer deposits under management (1) | 174,003 | (0.5) | 174,822 |
| Off-balance sheet funds (2) | 63,874 | 2.9 | 62,054 |
| Risk-weighted assets | 101,633 | (6,0) | 108,141 |
| Efficiency ratio (%) | 53.9 | 54.9 | |
| NPL ratio (%) | 5.2 | 5.5 | |
| NPL coverage ratio (%) | 57 | 50 | |
| Cost of risk (%) | 0.21 | 0.32 |
- (1) Excluding repos.
- (2) Includes mutual funds. pension funds and other off-balance-sheet funds.