South America
Highlights
- Activity continues to grow at a good pace.
- Positive performance of all the lines on the income statement.
- Expenses grow at a rate below the increase in gross income.
- Good asset quality indicators.
Business activity (1)
(Year-on-year change at constant exchange rates. Data as of 30-06-2018)
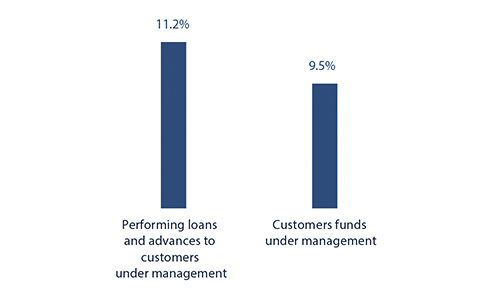
(1) Excluding repos.
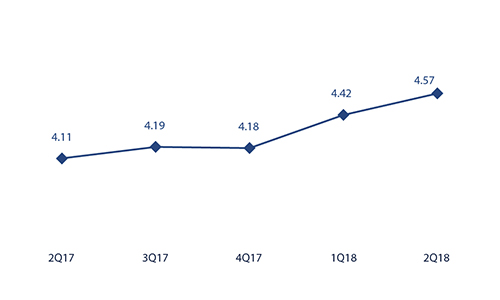
Net interest income/ATAs
(Percentage. Constant exchange rates)
Operating income
(Million euros at constant exchange rates)
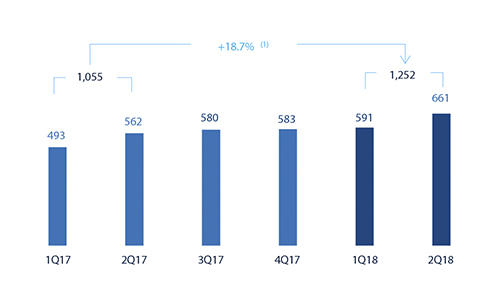
(1)At current exchange rates: 3.4%.
Net attributable profit
(Million euros at constant exchange rates)
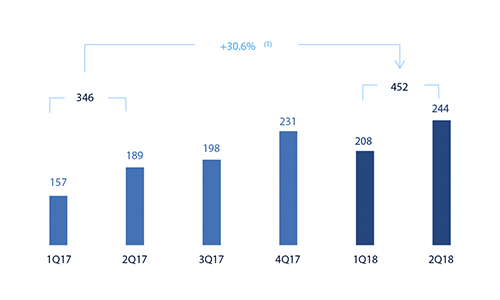
(1) At current exchange rates: 11.8%.
Breakdown of performing loans under management (1)
(30-06-2018)
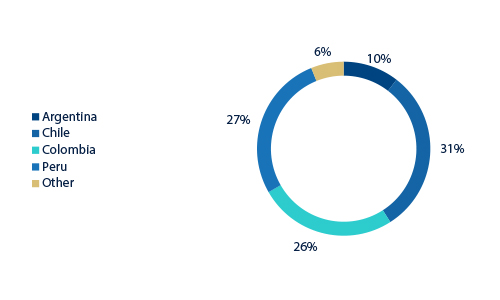
(1) Excluding repos.
Breakdown of customer funds under management (1)
(30-06-2018)
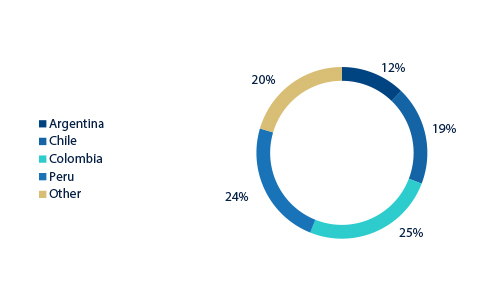
(1) Excluding repos.
Macro and industry trends
During the first quarter of 2018, the economies of South America strengthened the recovery they had begun in 2017. This good performance was due to the favorable behavior of consumption and investment (except in Argentina, as a consequence of the exchange-rate crisis). The main factors explaining this situation are: i) the increase in the price of most commodities exported by the region; and ii) a reduction in political tensions following the elections in Colombia and Peru. Both points contributed to improving the confidence of not only producers, but also consumers, except in Argentina, where market volatility, rising inflation and protests have contributed to a reduction of the confidence indices.
With respect to prices, a downward trend in inflation in the region is being observed, which is why convergence to the targets set by central banks is slowly being achieved; with the exception of Argentina and Brazil, where the depreciation of their local currencies in recent months is creating inflationary pressures. Signs of a tightening in the Fed's monetary policy are generating tensions in the financial markets in the countries of the region. Finally, interest rates have remained practically stable in the quarter, with the exception of Colombia, where there was a reduction of 25 basis points, and Argentina, whose Central Bank raised interest rates to curb exchange-rate volatility.
Regarding the banking systems within BBVA's regional footprint, the macroeconomic backdrop and low levels of banking penetration in these countries in aggregate terms (obviously with differences between countries) led to strong results in the main indicators of profitability and solvency, while non-performing loans remained under control. In addition, there has been sustained growth in lending and deposits.
Activity
As of 6-July-2018, after obtaining all required authorizations, BBVA completed the sale to The Bank of Nova Scotia of its direct and indirect stake in Banco Bilbao Vizcaya Argentaria, Chile (BBVA Chile) as well as in other companies of its group in Chile whose operations are complementary to the banking business (particularly, BBVA Seguros Vida, S.A.). BBVA’s stake in BBVA Chile amounted to approximately 68.2% of its share capital. The impacts of this transaction will be reflected in the financial statements of the BBVA Group for the third quarter of 2018.
Unless expressly stated otherwise, all the comments below on rates of change, for both activity and earnings, will be given at constant exchange rates, and include BBVA Chile. These rates, together with changes at current exchange rates, can be seen in the attached tables of financial statements and relevant business indicators.
The most relevant aspects related to the area’s activity year-to-date as of 30-June-2018 were:
- Lending (performing loans under management) in South America grew by 3.8% year-to-date and 11.2% year-on-year. By country, the most significant increase was in Argentina (up 22.4% year-to-date and up 77.5% year-on-year). By portfolios, performance was especially positive in the household segment.
- Regarding asset quality, here was a slight increase in the NPL ratio, which closed the first half of 2018 at 3.7%, while the NPL coverage ratio grew at 91%.
- Customer funds increased by 3.4% year-to-date (up 9.5% year-on-year), supported by off-balance-sheet funds (up 7.5% year-to-date) time deposits (up 4.3%) and, to a lesser extent, demand deposits (up 0.6). By country there was a positive trend in Argentina (up 27.7%), Colombia (up 4.7%) and Chile (1.7%).
Results
In the first half of 2018, South America generated a net attributable profit of €452m, which represents year-on-year growth of 30.6% (up 11.8% at current exchange rates). The year-on-year highlights of the area’s income statement are:
- A year-on-year increase of 14.3% in gross income, thanks to the good performance of more recurring revenue items and greater contribution from NTI. Net interest income (up 15.0%) grew faster than the year-on-year increase in lending, thanks to a greater volume and good price management. Net fees and commissions rose 12.7% in the same period.
- Growth of operating expenses (up 8.9%) was below the growth of gross income in the area, as a result of the cost control implemented in all the countries. Therefore, there was an improvement in the efficiency ratio.
- Decrease of the impairment losses on financial assets (down 4.0%), but well below the increase in lending in the area. As a result, the cumulative cost of risk at the close of March stood at 1.30%.
By country, the trends in the first half of 2018 were as follows:
- In Argentina, there was year-on-year growth in gross income of 50.4%. This increase was based both on the performance of recurring revenue (boosted by higher volumes of business) and the positive performance of NTI (mainly due to exchange rates). Operating expenses grew below the rate of gross income, and impairment losses on financial assets also posted a growth. As a result, there was a significant year-on-year increase in net attributable profit (up 62.5%).
- In Chile, net attributable profit was 8.9% higher than the same period of the previous year. Net interest income performed well (driven by the positive trend in lending and good management of customer spreads), net fees and commissions were higher and impairment losses on financial assets decreased.
- In Colombia, the increase in earnings was based on the good performance of net interest income (due to a positive performance in activity and customer spreads) and higher net fees and commissions, which boosted gross income (up 7.0%) above the rate of growth of operating expenses (up 6.3.%). Together with the reduction of impairment losses on financial assets, this led to a year-on-year increase of 59.6% in the net attributable profit.
- In Peru, net attributable profit increased by 10.4% year-on-year, leveraged by the good performance of net interest income (increase in lending), higher net fees and commissions, operating expenses growing at a slightly slower pace than the gross income and a decrease in impairment losses on financial assets.
Financial statements and relevant business indicators (Million euros and percentage)
| IFRS 9 | IAS 39 | |||||
|---|---|---|---|---|---|---|
| Income statement | 1H18 | ∆% | ∆% (1) | 1H17 | ||
| Net interest income | 1,606 | (0.7) | 15.0 | 1,617 | ||
| Net fees and commissions | 333 | (5.5) | 12.7 | 352 | ||
| Net trading income | 231 | (6.3) | 9.5 | 247 | ||
| Other operating income and expenses | 27 | (25.2) | 34.8 | 36 | ||
| Gross income | 2,197 | (2.4) | 14.3 | 2,252 | ||
| Operating expenses | (945) | (9.2) | 8.9 | (1,041) | ||
| Personnel expenses | (486) | (9.7) | 8.8 | (538) | ||
| Other administrative expenses | (399) | (9.6) | 8.3 | (442) | ||
| Depreciation | (60) | (1.3) | 14.6 | (60) | ||
| Operating income | 1,252 | 3.4 | 18.7 | 1,211 | ||
| Impairment on financial assets not measured at fair value through profit or loss | (326) | (13.2) | (4.0) | (375) | ||
| Provisions or reversal of provisions and other results | (35) | (24.0) | (11.2) | (46) | ||
| Profit/(loss) before tax | 891 | 12.8 | 31.8 | 790 | ||
| Income tax | (252) | 10.0 | 29.2 | (230) | ||
| Profit/(loss) for the year | 638 | 14.0 | 32.8 | 560 | ||
| Non-controlling interests | (187) | 19.8 | 38.6 | (156) | ||
| Net attributable profit | 452 | 11.8 | 30.6 | 404 | ||
| IFRS 9 | IAS 39 | |||||
|---|---|---|---|---|---|---|
| Balance sheets | 30-06-18 | ∆% | ∆%(1) | 31-12-17 | ||
| Cash, cash balances at central banks and other demand deposits | 7,514 | (16.9) | (12.5) | 9,039 | ||
| Financial assets designated at fair value | 10,098 | (13.1) | (10.7) | 11,627 | ||
| of which loans and advances | 184 | n.s. | n.s. | 3 | ||
| Financial assets at amortized cost | 51,383 | 0.3 | 3.5 | 51,207 | ||
| of which loans and advances to customers | 48,837 | 1.2 | 4.2 | 48,272 | ||
| Tangible assets | 616 | (15.0) | (7.1) | 725 | ||
| Other assets | 1,071 | (47.5) | (46.0) | 2,038 | ||
| Total assets/liabilities and equity | 70,682 | (5.3) | (2.1) | 74,636 | ||
| Financial liabilities held for trading and designated at fair value through profit or loss | 2,657 | (5.9) | (4.5) | 2,823 | ||
| Deposits from central banks and credit institutions | 5,042 | (33.2) | (33.2) | 7,552 | ||
| Deposits from customers | 45,615 | (0.1) | 3.6 | 45,666 | ||
| Debt certificates | 6,809 | (5.6) | (4.6) | 7,209 | ||
| Other liabilities | 7,286 | (14.3) | (8.4) | 8,505 | ||
| Economic capital allocated | 3,274 | 13.6 | 18.9 | 2,881 | ||
| Relevant business indicators | 30-06-18 | ∆% | ∆%(1) | 31-12-17 |
|---|---|---|---|---|
| Performing loans and advances to customers under management (2) | 48,454 | 0.8 | 13.8 | 48,068 |
| Non-performing loans | 2,088 | 10.8 | 9.9 | 1,884 |
| Customer deposits under management (3) | 45,344 | (1.4) | 2.3 | 45,970 |
| Off-balance sheet funds (4) | 12,970 | 6.3 | 7.5 | 12,197 |
| Risk-weighted assets | 55,151 | (1.5) | 3.5 | 55,975 |
| Efficiency ratio (%) | 43.0 | 45.1 | ||
| NPL ratio (%) | 3.7 | 3.4 | ||
| NPL coverage ratio (%) | 91 | 89 | ||
| Cost of risk (%) | 1.30 | 1.32 |
- (1) Figures at constant exchange rates.
- (2) Excluding repos.
- (3) Excluding repos and including specific marketable debt securities.
- (4) Includes mutual funds, pension funds and other off-balance sheet funds.
South America. Data per country (Million euros)
| IFRS 9 | IAS 39 | IFRS 9 | IAS 39 | |||||
|---|---|---|---|---|---|---|---|---|
| Operating income | Net attributable profit | |||||||
| Country | 1H18 | ∆% | ∆% (1) | 1H17 | 1H18 | ∆% | ∆% (1) | 1H17 |
| Argentina | 289 | 24.6 | 90.6 | 232 | 113 | 6.3 | 62.5 | 106 |
| Chile | 220 | 0.5 | 4.1 | 219 | 101 | 5.2 | 8.9 | 96 |
| Colombia | 324 | (1.4) | 7.4 | 329 | 123 | 46.5 | 59.6 | 84 |
| Peru | 347 | (4.9) | 5.4 | 365 | 85 | (0.4) | 10.4 | 85 |
| Other countries (2) | 72 | 7.5 | 17.4 | 67 | 31 | (8.1) | 1.2 | 33 |
| Total | 1,252 | 3.4 | 18.7 | 1,211 | 452 | 11.8 | 30.6 | 404 |
- (1) Figures at constant exchange rates.
- (2) Venezuela, Paraguay, Uruguay and Bolivia. Additionally, it includes eliminations and other charges.
South America. Relevant business indicators per country (Million euros)
| Argentina | Chile | Colombia | Peru | |||||
|---|---|---|---|---|---|---|---|---|
| 30-06-18 | 31-12-17 | 30-06-18 | 31-12-17 | 30-06-18 | 31-12-17 | 30-06-18 | 31-12-17 | |
| Performing loans and advances to customers under management (1-2) | 4,871 | 3,981 | 14,665 | 14,264 | 12,714 | 12,408 | 13,221 | 13,178 |
| Non-performing loans and guarantees given (1) | 47 | 31 | 437 | 411 | 778 | 701 | 702 | 656 |
| Customer deposits under management (1-3) | 5,934 | 4,714 | 9,502 | 9,453 | 13,298 | 12,754 | 12,065 | 12,412 |
| Off-balance sheet funds (1-4) | 1,199 | 873 | 1,398 | 1,265 | 1,273 | 1,166 | 1,692 | 1,608 |
| Risk-weighted assets | 7,914 | 9,364 | 14,861 | 14,431 | 12,983 | 12,299 | 15,360 | 14,879 |
| Efficiency ratio (%) | 49,4 | 56.1 | 45.3 | 45.2 | 36.2 | 36.0 | 36.1 | 35.6 |
| NPL ratio (%) | 0.9 | 0.8 | 2.6 | 2.6 | 5.7 | 5.3 | 4.0 | 3.8 |
| NPL coverage ratio (%) | 182 | 198 | 61 | 60 | 97 | 88 | 99 | 100 |
| Cost of risk (%) | 1.32 | 0.61 | 0.71 | 0.76 | 1.96 | 2.59 | 1.29 | 1.14 |
- (1) Figures at constant exchange rates.
- (2) Excluding repos.
- (3) Excluding repos and including specific marketable debt securities.
- (4) Includes mutual funds, pension funds and other off-balance-sheet funds.