Turkey
Highlights
- Solid growth in activity.
- Very positive growth in more recurring revenue items.
- Operating expenses increase below the level of inflation and the rate of increase in gross income.
- Risk indicators affected by more additions to NPL from certain wholesale loans that are practically fully provisioned.
Business activity (1)
(Year-on-year change at constant exchange rate. Data as of 31-12-2017)

(1) Excluding repos.
Net interest income/ATAs
(Percentage. Constant exchange rate)

Operating income
(Million euros at constant exchange rate)
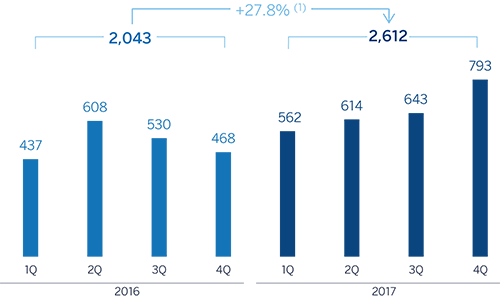
(1) At current exchange rate: +3.7%.
Net attributable profit
(Million euros at constant exchange rate)
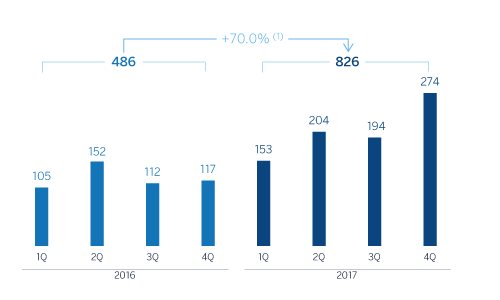
(1) At current exchange rate: +37.9%.
Breakdown of performing loans under management (1)
(31-12-2017)

(1) Excluding repos.
Breakdown of customer funds under management (1)
(31-12-2017)

(1) Excluding repos.
Macro and industry trends
According to the most recent figures from the Turkish Statistical Institute, year-on year economic growth rose to 11.1% in the third quarter of 2017. Government stimuli appear to be leveraging growth via private consumption, which is increasing household confidence, and by encouraging investment through access to credit facilities fostered by the Credit Guarantee Fund (CGF). BBVA Research has therefore revised its economic growth forecast up to 7% in 2017.
Annual inflation remained high, closing December at 11.9%, after reaching 13% in November, thanks to favorable base effects. The reduction was due to a significant upturn a year ago. Solid domestic demand and the exchange-rate effect increased core inflation to 12.3% at the end of 2017.
In this context of high inflation the CBRT kept its monetary policy tight. Since the end of last year, there has been an increase of around 450 basis points in the average funding rate, from 8.31% to 12.75%, (just over 75 basis points in the fourth quarter). The risk appetite in global financial markets will continue to have a key effect on the exchange rate.
The Turkish financial sector has showed signs of strength in 2017, thanks to access to the credit facilities fostered by the government-sponsored CGF program. Although the year-on-year growth rate in total lending (adjusted for the effect of the depreciation of the lira) stood at 20.5% at the end of December (compared to 20.4% as of September), the rate moderated in the second half of the year. Commercial loans ended the year with a higher growth rate than consumer loans, which is good for financial stability. Deposits from customers also maintained their strength, with year-on-year growth in December (adjusted for the effect of the depreciation of the lira) of 12.0%. Foreign-currency deposits grew by 15.3%, mainly due to the comparison with the very low figure at the same period last year, and Turkish lira deposits increased 12.6%. Lastly, the NPL ratio in the sector improved in 2017, closing the year at 2.9% (3.2% at the close of 2016).
Activity
In March 2017, BBVA completed the acquisition of an additional 9.95% stake in the share capital of Garanti, increasing BBVA's total stake in this entity to 49.85%. Garanti continues to be incorporated into the Group's financial statements by the full integration method.
Unless expressly stated otherwise, all the comments below on rates of change, for both activity and earnings, will be given at constant exchange rate. These rates, together with changes at current exchange rate, can be seen in the attached tables of financial statements and relevant business indicators.
The growth of lending activity (performing loans under management) in the area rose to 13.9% in year-on-year terms, mainly driven by Turkish lira loans. By segments, business banking loans performed very favorably throughout the year, thanks to the aforementioned CGF program launched at the start of the year. General purpose loans also performed well. In mortgages, Garanti gained market share among private banks thanks to using alternative sale channels effectively and providing flexible payment plan options. Garanti also performed positively, above the average of its private-sector peers, in auto loans, and strengthened its leading position in the credit card segment, thanks to the increase in both commercial and consumer credit cards.
In terms of asset quality, the NPL ratio rose to 3.9% as a result of increased additions to NPLs from certain wholesale loans, although they were practically fully provisioned (with hardly any impact on results). The NPL coverage ratio closed at 85%.
Customer deposits remained the main source of funding for the balance sheet in the area, and grew by 14.9% in 2017 (up 4.6% in the last quarter). Both, Turkish lira and foreign currency deposits grew in year-on-year terms, with current and savings accounts performing well and continuing to support growth in net interest income growth: they have almost zero cost and represent 26% of total customer deposits in Garanti.
Results
Turkey generated a cumulative net attributable profit of €826m in 2017, up 70.0% compared with the figure in 2016. The most significant aspects of the year-on-year changes in the income statement were as follows:
- Positive performance of net interest income (up 20.6%). This positive trend is a result of increased in activity, good management of customer spreads (despite the increase in cost of funding), higher income from inflation-linked bonds.
- Income from fees and commissions increased 18.5% year-on-year, thanks to good diversification (payment systems, money transfers, loans, insurance and brokerage). This positive performance has been achieved despite the lower generation of fees from account maintenance due to the suspension of charges in the retail segment implemented by the Turkish Council of State as of January, 2016, and the high revenues generated in 2016 by the Miles & Smiles program.
- Reduction of NTI (down 76.8%), mainly due to the higher base of comparison due to the capital gains generated in the first half of 2016 from the VISA deal.
- Overall, gross income was up 19.2% in 2017.
- Operating expenses increased by 6.6%, below both the inflation rate and the year-on-year growth rate in gross income, thanks to strict cost discipline. As a result, the efficiency ratio declined to 36.5% (40.8% in 2016).
- Impairment losses on financial assets rose by 7.3% year-on-year, less than the rise in lending activity. As a result, the cumulative cost of risk of the area closed 2017 at 0.82%, below the level of 2016 (0.87%).
- Finally, BBVA Group’s additional stake of 9.95% in the capital of Garanti had a positive effect on reducing the non-controlling interest heading by approximately €150m.
Financial statements and relevant business indicators (Million euros. Percentage)
| Income statement | 2017 | ∆% | ∆%(1) | 2016 |
|---|---|---|---|---|
| Net interest income | 3,331 | (2.1) | 20.6 | 3,404 |
| Net fees and commissions | 703 | (3.9) | 18.5 | 731 |
| Net trading income | 14 | (81.2) | (76.8) | 77 |
| Other income/expenses | 67 | 46.5 | 80.6 | 46 |
| Gross income | 4,115 | (3.3) | 19.2 | 4,257 |
| Operating expenses | (1,503) | (13.5) | 6.6 | (1,738) |
| Personnel expenses | (799) | (10.1) | 10.8 | (889) |
| Other administrative expenses | (526) | (17.2) | 2.1 | (635) |
| Depreciation | (178) | (16.7) | 2.7 | (214) |
| Operating income | 2,612 | 3.7 | 27.8 | 2,519 |
| Impairment on financial assets (net) | (453) | (13.0) | 7.3 | (520) |
| Provisions (net) and other gains (losses) | (12) | (87.2) | (84.2) | (93) |
| Profit/(loss) before tax | 2,147 | 12.7 | 38.9 | 1,906 |
| Income tax | (426) | 9.2 | 34.7 | (390) |
| Profit/(loss) for the year | 1,720 | 13.5 | 40.0 | 1,515 |
| Non-controlling interests | (895) | (2.4) | 20.4 | (917) |
| Net attributable profit | 826 | 37.9 | 70.0 | 599 |
| Balance sheets | 31-12-17 | ∆% | ∆%(1) | 31-12-16 |
|---|---|---|---|---|
| Cash, cash balances at central banks and other demand deposits | 4,036 | 48.2 | 81.7 | 2,724 |
| Financial assets | 11,819 | (13.5) | 6.0 | 13,670 |
| Loans and receivables | 59,683 | (7.9) | 12.9 | 64,814 |
| of which loans and advances to customers | 51,378 | (7.6) | 13.3 | 55,612 |
| Tangible assets | 1,344 | (6.0) | 15.3 | 1,430 |
| Other assets | 1,812 | (18.7) | (0.3) | 2,229 |
| Total assets/liabilities and equity | 78,694 | (7.3) | 13.7 | 84,866 |
| Financial liabilities held for trading and designated at fair value through profit or loss | 648 | (35.8) | (21.3) | 1,009 |
| Deposits from central banks and credit institutions | 11,195 | (17.0) | 1.8 | 13,490 |
| Deposits from customers | 44,691 | (5.4) | 16.0 | 47,244 |
| Debt certificates | 8,346 | 5.5 | 29.4 | 7,907 |
| Other liabilities | 11,321 | (12.1) | 7.7 | 12,887 |
| Economic capital allocated | 2,493 | 7.0 | 31.3 | 2,330 |
| Relevant business indicators | 31-12-17 | ∆% | ∆%(1) | 31-12-16 |
|---|---|---|---|---|
| Loans and advances to customers (gross) (2) | 53,445 | (7.8) | 13.1 | 57,941 |
| Non-performing loans and contingent liabilities | 2,553 | 28.8 | 58.0 | 1,982 |
| Customer deposits under management (2) | 44,499 | (6.3) | 14.9 | 47,489 |
| Off-balance sheet funds (3) | 3,902 | 4.0 | 27.5 | 3,753 |
| Risk-weighted assets | 62,768 | (10.8) | 9.4 | 70,337 |
| Efficiency ratio (%) | 36.5 | 40.8 | ||
| NPL ratio (%) | 3.9 | 2.7 | ||
| NPL coverage ratio (%) | 85 | 124 | ||
| Cost of risk (%) | 0.82 | 0.87 |
(1) Figures at constant exchange rate.
(2) Excluding repos.
(3) Includes mutual funds, pension funds and other off-balance-sheet funds.