The United States
Highlights
- Lending remained stable over the year.
- Increase in deposits from customers.
- Positive performance of net interest income and net fees and commissions.
- Solid risk indicators.
- Higher income tax charge due to the tax reform approved at the end of 2017.
Business activity (1)
(Year-on-year change at constant exchange rate. Data as of 31-12-2017)

(1) Excluding repos.
Net interest income/ATAs
(Percentage. Constant exchange rate)

Operating income
(Million euros at constant exchange rate)
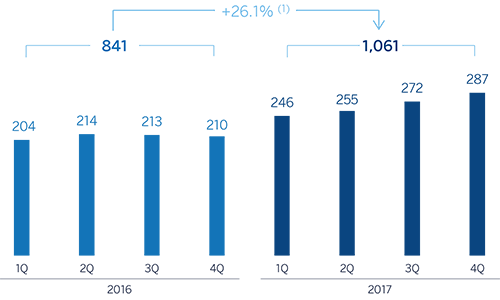
(1) At current exchange rate: +22.9%.
Net attributable profit
(Million euros at constant exchange rate)
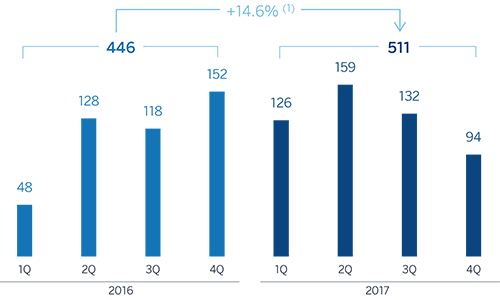
(1) At current exchange rate: +11.3%.
Breakdown of performing loans under management (1)
(31-12-2017)

Breakdown of customer funds under management (1)
(31-12-2017)

(1) Excluding repos.
(1) Excluding repos.
Macro and industry trends
According to the latest information from the Bureau of Economic Analysis (BEA), U.S. GDP grew again by over 3% in the third quarter of 2017 in annualized terms, consolidating the recovery after significant moderation at the end of 2016. The strength of the economy has benefited from a number of factors: The increased price of oil and the depreciation of the dollar boosted investment, while rising global demand favored the growth of exports. Consumer spending grew at a relatively stable and robust rate, despite the slowdown in the improvement of the labor market, an increase in inflation and slightly tougher financial conditions. The most recent indicators suggest economic activity slowed in the last quarter of the year, although this is temporary, following the end of the reconstruction work in the wake of the hurricanes. In all, the GDP may have closed the year with an increase of more than 2% in 2017, with a more balanced growth supported by both consumption and investment.
With regard to the currency market, the dollar's significant depreciation against the euro since the second quarter of 2017 was consolidated in the second half of the year, which recorded a year-on-year depreciation of 12.1%. This trend reflected on the one hand the progressive manner in which the Fed is carrying out the process of normalizing its monetary policy; and on the other, an economic performance in Europe that was somewhat better than expected, with the ECB announcing a gradual withdrawal of stimuli.
The U.S. banking system is in a very strong position. According to the latest available data from the Fed through November 2017, the total volume of bank credit in the system increased by 5.3% over the last twelve months. Growth of 2.6% recorded in the portfolios of lending to the real-estate sector (including residential mortgage loans) and 9.8% in consumer finance offset the 1.9% reduction in commercial lending. Non-performing loans in the system remained under control, with an NPL ratio of 1.82% at the close of 2017. Deposits were stable, with only a slight fall of 0.3% (November data).
Activity
All the comments below on rates of change, for both activity and earnings, will be given at constant exchange rate, unless expressly stated otherwise. These rates, together with changes at current exchange rate, can be seen in the attached tables of financial statements and relevant business indicators.
Following the increase in the third quarter of 2017, lending activity (performing loans under management) in the area grew again by 1.0% in the last quarter of the year. As a result, the balance of lending as of 31-Dec-2017 was practically the same as of the close of 2016 (down 0.1%). By portfolio, the growth was mainly focused on consumer finance and credit cards (up 3.5% in the quarter and 5.0% year-on-year), a portfolio with greater spread and thus more profitable; commercial loans (up 3.7% and 1.5% respectively) and the public sector (up 12.6% and 27.1% respectively).
With respect to asset quality, risk indicators in the area continued to be sound. The NPL ratio closed the year at 1.2% and the NPL coverage ratio at 104%.
Customer deposits under management increased both over the last twelve months (up 1.8%) and in the quarter (up 6.5%), thanks to the good performance of the more liquid lower-cost funds, such as current and savings accounts (up 3.4% year-on-year and 4.4% quarter-on-quarter). Time deposits grew significantly in the quarter (up 13.8%), although in year-on-year terms they fell by 5.6%
Results
The United States generated a cumulative net attributable profit in 2017 of €511m, 14.6% up on the previous year, primarily due to the good performance of the more recurring revenue items. The most relevant aspects of the area's income statement are as follows:
- Net interest income continued to perform positively, with a cumulative figure rising by 13.0% in year-on-year terms. This was due to the combined result of the strategic measures adopted by BBVA Compass to improve loan yields and reduce the cost of liabilities (deposits and wholesale funding), as well as the Fed's interest-rate hikes (December 2016, March and June 2017).
- Income from fees and commissions increased by 4.1%. There was an outstanding performance in practically all items, notably those from account maintenance, asset management and retail investment banking (securities transactions, annuity sales, structured notes and life insurance).
- Reduction of 19.6% in NTI compared with the figure for the previous year. The positive performance of the Global Markets unit, particularly early in the year, has not been sufficient to offset the capital gains from portfolio sales in 2016.
- Increase of 3.2% in operating expenses, focused above all on administration costs. Within this item, general expenses showed an increase in costs related to IT, consulting and marketing.
- Impairment losses on financial assets increased by 10.8% on the previous year, due partly to the inclusion of provisions allocated as a result of the estimated negative impact of the natural disasters in the third quarter and higher loan-loss provisioning related to consumer portfolio. Despite the above, the cumulative cost of risk as of 31-Dec-2017 was 0.42%, three basis points below the cumulative figure as of 30-Sep-2017 (0.37% in 2016).
- Finally, income tax included a charge of €78m in the fourth quarter of 2017 as a result of the tax reform approved at the end of the year, which reduced the corporate tax rate from 35% to 21%, and as a result the value of deferred tax assets. However, the lower tax rate in 2018 should have a positive impact on earnings in the area.
Financial statements and relevant business indicators
(Million euros. Percentage)
| Income statement | 2017 | ∆% | ∆%(1) | 2016 |
|---|---|---|---|---|
| Net interest income | 2,158 | 10.5 | 13.0 | 1,953 |
| Net fees and commissions | 647 | 1.5 | 4.1 | 638 |
| Net trading income | 111 | (22.2) | (19.6) | 142 |
| Other income/expenses | 2 | n.s. | n.s. | (27) |
| Gross income | 2,919 | 7.9 | 10.5 | 2,706 |
| Operating expenses | (1,858) | 0.8 | 3.2 | (1,843) |
| Personnel expenses | (1,067) | (0.5) | 1.8 | (1,073) |
| Other administrative expenses | (604) | 4.2 | 6.7 | (580) |
| Depreciation | (187) | (1.9) | 0.2 | (190) |
| Operating income | 1,061 | 22.9 | 26.1 | 863 |
| Impairment on financial assets (net) | (241) | 8.9 | 10.8 | (221) |
| Provisions (net) and other gains (losses) | (36) | 19.2 | 23.1 | (30) |
| Profit/(loss) before tax | 784 | 28.2 | 31.8 | 612 |
| Income tax | (273) | 78.6 | 83.0 | (153) |
| Profit/(loss) for the year | 511 | 11.3 | 14.6 | 459 |
| Non-controlling interests | - | - | - | - |
| Net attributable profit | 511 | 11.3 | 14.6 | 459 |
| Balance sheets | 31-12-17 | ∆% | ∆%(1) | 31-12-16 |
|---|---|---|---|---|
| Cash, cash balances at central banks and other demand deposits | 11,089 | 39.3 | 58.4 | 7,963 |
| Financial assets | 11,154 | (23.5) | (13.0) | 14,581 |
| Loans and receivables | 55,419 | (12.0) | 0.1 | 62,962 |
| of which loans and advances to customers | 54,406 | (11.0) | 1.2 | 61,159 |
| Inter-area positions | - | - | - | - |
| Tangible assets | 658 | (16.3) | (4.8) | 787 |
| Other assets | 2,172 | (16.7) | (5.3) | 2,609 |
| Total assets/liabilities and equity | 80,493 | (9.5) | 3.0 | 88,902 |
| Financial liabilities held for trading and designated at fair value through profit or loss | 139 | (95.2) | (94.5) | 2,901 |
| Deposits from central banks and credit institutions | 3,663 | 5.5 | 20.0 | 3,473 |
| Deposits from customers | 61,357 | (6.7) | 6.2 | 65,760 |
| Debt certificates | 2,017 | (17.5) | (6.2) | 2,446 |
| Inter-area positions | 4,965 | 1,9 | 15,9 | 4,875 |
| Other liabilities | 5,560 | (8.4) | 4.2 | 6,068 |
| Economic capital allocated | 2,791 | (17.4) | (6.0) | 3,379 |
| Relevant business indicators | 31-12-17 | ∆% | ∆%(1) | 31-12-16 |
|---|---|---|---|---|
| Loans and advances to customers (gross) (2) | 55,122 | (11.1) | 1.2 | 62,000 |
| Non-performing loans and contingent liabilities | 696 | (28.6) | (18.8) | 976 |
| Customer deposits under management (2) | 56,547 | (10.5) | 1.8 | 63,195 |
| Off-balance sheet funds (3) | - | - | - | - |
| Risk-weighted assets | 58,682 | (10.4) | 1.9 | 65,492 |
| Efficiency ratio (%) | 63.7 | 68.1 | ||
| NPL ratio (%) | 1.2 | 1.5 | ||
| NPL coverage ratio (%) | 104 | 94 | ||
| Cost of risk (%) | 0.42 | 0.37 |
- (1) Figures at constant exchange rate.
- (2) Excluding repos.
- (3) Includes mutual funds, pension funds and other off-balance-sheet funds.