Mexico
Highlights
- Good performance in activity.
- Positive trend in gross income.
- Costs continue to increase below gross income, and double-digit year-on-year growth in net attributable profit.
- Stable asset quality indicators.
Business activity (1)
(Year-on-year change at constant exchange rate. Data as of 31-12-2017)

(1) Excluding repos.
Net interest income/ATAs
(Percentage. Constant exchange rate)

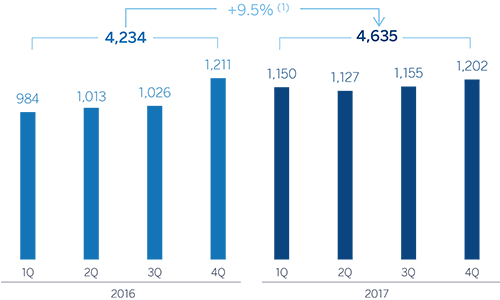
Operating income
(Million euros at constant exchange rate)
Net attributable profit
(Million euros at constant exchange rate)

(1) At current exchange rate: +6.0%.
(1) At current exchange rate: +9.2%.
Breakdown of performing loans under management (1)
(31-12-2017)

Breakdown of customer funds under management (1)
(31-12-2017)

(1) Excluding repos.
(1) Excluding repos.
Macro and industry trends
Following the slowdown of activity in Mexico in the first half of 2017, the negative impact of natural phenomena led to a 0.3% quarterly decline in the third quarter. The adverse effect was noted in more sluggish consumption, also affected by increased inflation, and the decline in oil production and construction. However, this fall should be temporary and improve steadily with the boost from consumption of goods and services to help the victims of the disasters. As a result, GDP growth could have moderated to around 2% in 2017 as a whole, mainly supported by private consumption. However, investment was affected by the increased uncertainty linked to the negotiations of the trade agreement with the United States.
The significant depreciation of the peso in the first half of 2017 affected the behavior of inflation over the year, which remained high and reached rates of around 6.5% in recent months. In this context, Banxico increased interest rates by 150 basis points to 7.25%. Despite the uncertainty and volatility, the depreciation of the peso has been checked, so this effect on inflation began to decline in recent months.
The Mexican banking system has sustained excellent capital adequacy and asset quality levels over recent years. According to data released by the National Securities Banking Commission (CNBV, according to its acronym in Spanish), the capital adequacy ratio rose slightly to 15.73% in the third quarter. All the banks in the system registered ratios well above minimum requirements. The data on activity remained as strong as in previous quarters, with year-on-year growth in total lending of 8.9% and the total volume of deposits of 10.0%, as of November 2017. By portfolios, commercial loans grew by 12.2%, consumer finance by 8.5% and residential mortgage loans by 8.7%. Non-performing loans remained under control, with an NPL ratio of 2.2%, slightly below the November 2016 figure. The NPL coverage ratio remained relatively stable over the last twelve months, at 155%. Demand deposits grew by 8.6% to November 2017 in year-on-year terms, while time deposits increased by 19.4%.
Activity
All rates of change given below, for both activity and earnings, will be given at constant exchange rate, unless expressly stated otherwise. These rates, together with changes at current exchange rate, can be seen in the attached tables of financial statements and relevant business indicators.
BBVA's lending (performing loans under management) in Mexico increased by 5.5% since December 2016 and 0.9% over the fourth quarter. As a result, BBVA Bancomer has retained its leadership position, with a market share for its performing portfolio of 23.0% (according to the latest local information from the CNBV as of November 2017).
The weight of the retail and wholesale portfolios was practically equal at the end of December (51% and 49% respectively). Wholesale lending was up 5.0% on December 2016 and 0.8% over the quarter. Within the wholesale portfolio, business loans (including loans to corporate clients and mid-sized companies, not including developer mortgage loans) grew by 8.7% on the close of 2016. Lending to housing developers continued the positive trend that began in the previous quarter, with year-on-year growth of 4.6%.
The retail portfolio registered growth of 6.0% over the last twelve months and 1.0% in the last quarter, buoyed by lending to SMEs and auto loans, which rose by 9.0% and 11.4% respectively in year-on-year terms. Meanwhile, credit cards increased by 2.6% over the year, with new production during this period of 8.3%. The mortgage portfolio continued to show the effect of early maturities on the overall amount, which increased year-on-year by 6.4% as of 31-Dec-2017.
This lending growth has been accompanied by stable asset quality indicators. The NPL and NPL coverage ratios closed the year at 2.3% and 123% respectively.
Total customer funds (customer deposits under management, mutual funds, and other off-balance-sheet funds) posted year-on-year growth of 11.4% (up 1.3% in the fourth quarter). All items continued to perform positively: current and savings accounts rose 11.5% year-on-year (up 1.5% on the previous quarter), and time deposits grew by 13.1% (up 0.4% over the quarter). BBVA in Mexico has a profitable funding mix, with low-cost items continuing to account for over 81% of total customer deposits under management. Finally, there was also an increase in mutual funds of 9.3% year-on-year and 1.0% over the quarter.
Results
The highlights of Mexico's income statement for 2017 are as follows:
- Positive performance of net interest income, with a year-on-year increase of 9.5%, driven primarily by greater activity volumes and favorable customer spreads.
- Good performance of net fees and commissions, with growth of 9.3% over the last twelve months. They remained strongly influenced by an increased volume of transactions with credit card customers and fees from online and investment banking.
- Strong growth in NTI (up 15.9% year-on-year), thanks to a very good performance from the Global Markets unit, basically in the first half of the year.
- In other income/expenses the comparison with last year is unfavorable (down 32.2% year-on-year), mainly due to insurance activity, as a result of a higher claims rate derived from the natural disasters that took place during the year.
- Operating expenses continued to grow at a controlled pace (up 5.3% year-on-year), below both the area's gross income growth of 8.0% and the country's inflation rate. As a result, the efficiency ratio stood at 34.5%.
- Year-on-year growth in impairment losses on financial assets (up 4.9%) was below that registered by lending (up 5.5%). As a result, the cumulative cost of risk in the area was 3.30%, six basis points below the cumulative figure through September and ten basis points less than that in 2016.
Overall, BBVA in Mexico posted a net attributable profit for the year of €2,162m, a year-on-year increase of 12.7%.
Financial statements and relevant business indicators (Million euros. Percentage)
| Income statement | 2017 | ∆% | ∆%(1) | 2016 |
|---|---|---|---|---|
| Net interest income | 5,437 | 6.1 | 9.5 | 5,126 |
| Net fees and commissions | 1,217 | 5.9 | 9.3 | 1,149 |
| Net trading income | 249 | 12.3 | 15.9 | 222 |
| Other income/expenses | 177 | (34.4) | (32.2) | 270 |
| Gross income | 7,080 | 4.6 | 8.0 | 6,766 |
| Operating expenses | (2,445) | 2.1 | 5.3 | (2,396) |
| Personnel expenses | (1,051) | 0.3 | 3.5 | (1,048) |
| Other administrative expenses | (1,138) | 3.3 | 6.7 | (1,101) |
| Depreciation | (256) | 3.8 | 7.2 | (247) |
| Operating income | 4,635 | 6.0 | 9.5 | 4,371 |
| Impairment on financial assets (net) | (1,652) | 1.6 | 4.9 | (1,626) |
| Provisions (net) and other gains (losses) | (35) | (47.8) | (46.2) | (67) |
| Profit/(loss) before tax | 2,948 | 10.1 | 13.6 | 2,678 |
| Income tax | (786) | 12.8 | 16.4 | (697) |
| Profit/(loss) for the year | 2.162 | 9.2 | 12.7 | 1,981 |
| Non-controlling interests | (0) | (42.5) | (40.6) | (1) |
| Net attributable profit | 2,162 | 9.2 | 12.7 | 1,980 |
| Balance sheets | 31-12-17 | ∆% | ∆%(1) | 31-12-16 |
|---|---|---|---|---|
| Cash, cash balances at central banks and other demand deposits | 4,882 | (6.0) | 2.2 | 5,192 |
| Financial assets | 28,541 | (8.7) | (0.8) | 31,273 |
| Loans and receivables | 46,977 | (2.1) | 6.4 | 47,997 |
| of which loans and advances to customers | 45,080 | (3.0) | 5.4 | 46,474 |
| Tangible assets | 1,749 | (10.6) | (2.8) | 1,957 |
| Other assets | 7,195 | 4.3 | 13.3 | 6,900 |
| Total assets/liabilities and equity | 89,344 | (4.3) | 4.1 | 93,318 |
| Financial liabilities held for trading and designated at fair value through profit or loss | 9,405 | (5.6) | 2.6 | 9,961 |
| Deposits from central banks and credit institutions | 5,769 | (2.6) | 5.9 | 5,923 |
| Deposits from customers | 49,414 | (2.3) | 6.2 | 50,571 |
| Debt certificates | 7,312 | (15.1) | (7.7) | 8,611 |
| Other liabilities | 13,642 | (2.1) | 6.3 | 13,941 |
| Economic capital allocated | 3,802 | (11.8) | (4.2) | 4,311 |
| Relevant business indicators | 31-12-17 | ∆% | ∆%(1) | 31-12-16 |
|---|---|---|---|---|
| Loans and advances to customers (gross) (2) | 46,463 | (2.9) | 5.5 | 47,865 |
| Non-performing loans and contingent liabilities | 1,124 | (2.5) | 6.0 | 1,152 |
| Customer deposits under management (2) | 43,179 | 2.8 | 11.8 | 41,989 |
| Off-balance sheet funds (3) | 19,472 | 1.9 | 10.7 | 19,111 |
| Risk-weighted assets | 43,715 | (8.7) | (0.7) | 47,863 |
| Efficiency ratio (%) | 34.5 | 35.4 | ||
| NPL ratio (%) | 2.3 | 2.3 | ||
| NPL coverage ratio (%) | 123 | 127 | ||
| Cost of risk (%) | 3.30 | 3.40 |
(1) Figures at constant exchange rate.
(2) Excluding repos.
(3) Includes mutual funds, pension funds and other off-balance sheet funds.