South America
Highlights
- Growth of activity in the region continues to moderate, in line with the current macro economic situation.
- Customer funds are increasing at a good pace.
- Positive trend of more recurring revenues.
- Expenses conditioned by the high level of inflation in some countries.
- The macroeconomic environment continues to influence the behavior of the risk indicators.
Business activity (1)
(Year-on-year change at constant exchange rate. Data as of 30-06-2017)
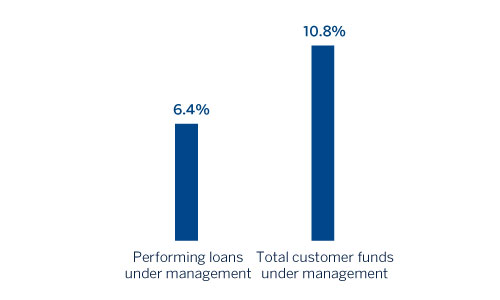
(1) Excluding repos.
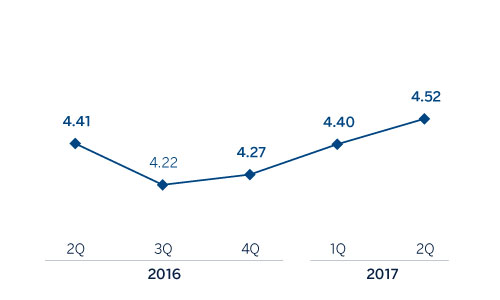
Net interest income/ATA
(Percentage. Constant exchange rate)
Operating income
(Million euros at constant exchange rate)
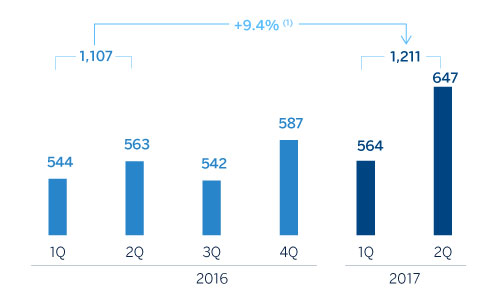
(1)At current exchange rate: +12.4%.
Net attributable profit
(Million euros at constant exchange rate)
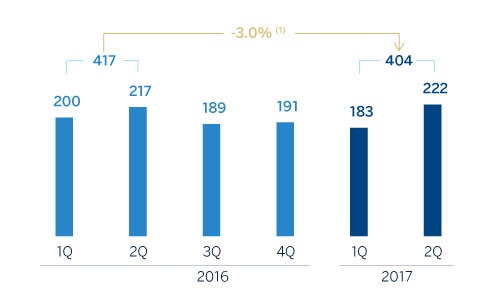
(1) At current exchange rate: +2.7%.
Breakdown of performing loans under management (1)
(30-06-2017)
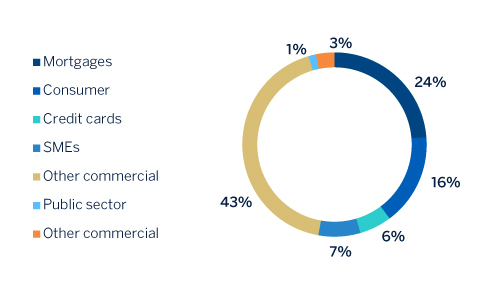
(1) Excluding repos.
Breakdown of customer funds under management (1)
(30-06-2017)
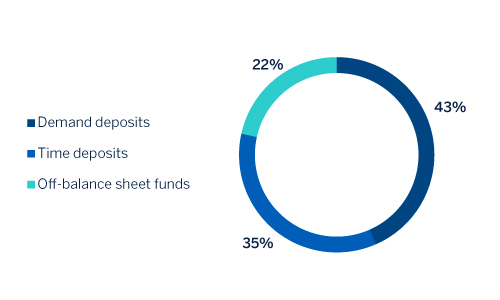
(1) Excluding repos.
Macro and industry trends
South America is emerging from a weak cyclical position. In recent years, the region has seen a contraction in activity caused mainly by declining external demand and commodity prices (the latter has a significant impact on performance) and, more recently, by factors related to political issues. There are currently some signs of a change in trend enabling the region to post modest growth this year, which should consolidate over the coming years. This recovery will be led, above all, by Argentina.
Inflation is slowing in most countries, given the modest depreciation of South American currencies against the dollar and the spare capacity built up following the decline in economic activity in recent years. Accordingly, monetary policy is shifting toward a more relaxed stance (except in Argentina), as central banks put greater emphasis on supporting the recovery, in the absence of a clear threat from inflationary pressures.
As regards the financial systems within BBVA's regional footprint, the macroeconomic backdrop and reduced levels of banking penetration in these countries in aggregate terms (with obvious differences between countries), is enabling the main indicators of profitability and solvency to remain elevated while limiting non-performing loans. In addition, there has been sustained growth in lending and deposits.
Activity
All the comments below on rates of change, for both activity and earnings, will be given at constant exchange rates, unless expressly stated otherwise. These rates, together with changes at the current exchange rates, can be seen in the attached tables of financial statements and relevant business indicators.
Lending (performing loans under management) increased slightly on the close of December 2016 (up 1.2%), still hampered by weak economic growth in the region, and changes in the portfolios denominated in U.S. dollars (impacted by the depreciation of the dollar against some local currencies). By segments, the strong performance of the individual customer segment (particularly consumer finance and mortgages) offset the moderation in the commercial and public sectors. By country, the fastest growth was in Argentina (up 15.2%), Chile (up 3.8%) and Colombia (up 2.2%). In summary, the loan book grew by 6.4% in the region in year-on-year terms, slowing relative to the end of 2016, but slightly better than growth at March 30, 2017, supported by the credit card and consumer finance portfolios, which both saw double-digit growth in year-on-year terms.
In terms of asset quality, the macroeconomic situation continues to shape the NPL and NPL coverage ratios, which closed the first half of the year at 3.5% and 94% respectively.
On the liabilities side, customer funds have continued to grow at a healthy pace, registering an increase over the first six months of 3.7% (up 10.8% in year-on-year terms). This trend in customer funds is explained by the good performance of transactional funds and off-balance sheet funds, with particularly positive trends in Argentina (up 14.4% in the half-year) and Colombia (up 6.9% over the same period).
Results
In the first half of the year, South America posted a net attributable profit of €404m, down 3.0% year-on-year on the same period in 2016 (up 2.7% at current exchange rates). The key aspects of the year-on-year changes in the income statement in the area are:
- Gross income has grown by 10.3%, thanks to the strong capacity to generate recurring revenues in the area. In this regard, net interest income is up 10.3% and net fees and commissions have grown by 15.3%. There was a lower contribution from NTI, basically due to Argentina (lower revenues from securities trading) and Colombia (in 2016 capital gains were registered from the sale of holdings).
- Operating expenses have increased by 11.4% year-on-year. However, this heading increased by less than the area's gross income, if Argentina is excluded (with its high inflation).
- Impairment losses on financial assets increased by 46.6%, reflecting the still weak economic growth in the region. Furthermore, this line item is affected by the impact of provisions associated with one particular customer. As a result, the cumulative cost of risk stood at 1.52% for the first half of the year (1.15% in 2016 and 1.49% in the first quarter of 2017).
By country, recurring revenues performed well in Argentina; net interest income grew more rapidly in the second quarter of 2017, and the figures for cumulative fees have been excellent. However, expenses continue to be affected by high inflation, which is why the country's earnings have declined by 8.2% relative to the same period of 2016. In Chile, positive developments in gross income (net interest income is growing thanks to growth in lending and effective management of spreads) and the decline in expenses comfortably offset the rise in loan-loss provisioning and the increase in the nominal tax rate. Accordingly, the country recorded a net attributable profit 63.2% up on the first half of 2016. In Colombia, gross income performed strongly, thanks to positive developments in net interest income and fees, albeit mitigated by lower NTI (the same period of 2016 included capital gains from the sale of holdings) and an increase in loan-loss provisioning. As a result, net attributable profit was 40.3% lower than the same period of 2016. In Peru, earnings are 1.1% above the figure for the first half of last year, since the good performance of NTI and the reduction in expenses have largely been mitigated by limited growth in recurring revenues and greater loan-loss provisions.
Financial statements and relevant business indicators (Million euros and percentage)
| Income statement | 1H17 | ∆% | ∆%(1) | 1H16 |
|---|---|---|---|---|
| Net interest income | 1,617 | 12.3 | 10.3 | 1,441 |
| Net fees and commissions | 352 | 17.6 | 15.3 | 299 |
| Net trading income | 247 | (22.7) | (6.0) | 319 |
| Other income/expenses | 36 | n.s. | n.s. | (59) |
| Gross income | 2,252 | 12.6 | 10.3 | 1,999 |
| Operating expenses | (1,041) | 12.9 | 11.4 | (921) |
| Personnel expenses | (538) | 12.5 | 10.4 | (479) |
| Other administrative expenses | (442) | 11.6 | 10.6 | (396) |
| Depreciation | (60) | 28.6 | 29.8 | (47) |
| Operating income | 1,211 | 12.4 | 9.4 | 1,078 |
| Impairment on financial assets (net) | (375) | 53.0 | 46.6 | (245) |
| Provisions (net) and other gains (losses) | (46) | 61.2 | 3.7 | (29) |
| Profit/(loss) before tax | 790 | (1.8) | (2.1) | 804 |
| Income tax | (229) | (15.3) | (4.5) | (271) |
| Profit/(loss) for the year | 560 | 5.1 | (1.1) | 533 |
| Non-controlling interests | (156) | 11.9 | 4.3 | (139) |
| Net attributable profit | 404 | 2.7 | (3.0) | 394 |
| Balance sheets | 30-06-17 | ∆% | ∆%(1) | 31-12-16 |
|---|---|---|---|---|
| Cash, cash balances at central banks and other demand deposits | 8,320 | (21.4) | (12.2) | 10,586 |
| Financial assets | 11,953 | 11.3 | 20.1 | 10,739 |
| Loans and receivables | 50,533 | (6.5) | 1.1 | 54,057 |
| of which loans and advances to customers | 45,791 | (6.0) | 1.7 | 48,718 |
| Tangible assets | 749 | (7.2) | 5.4 | 807 |
| Other assets | 1,768 | 2.2 | 10.9 | 1,729 |
| Total assets/liabilities and equity | 73,323 | (5.9) | 2.2 | 77,918 |
| Financial liabilities held for trading and designated at fair value through profit or loss | 2,372 | (8.3) | (1.3) | 2,585 |
| Deposits from central banks and credit institutions | 6,385 | (4.1) | 1.8 | 6,656 |
| Deposits from customers | 44,713 | (6.7) | 1.9 | 47,927 |
| Debt certificates | 7,069 | (5.1) | 1.7 | 7,447 |
| Other liabilities | 9,876 | (6.8) | 1.2 | 10,600 |
| Economic capital allocated | 2,909 | 7.6 | 18.0 | 2,703 |
| Relevant business indicators | 30-06-17 | ∆% | ∆%(1) | 31-12-16 |
|---|---|---|---|---|
| Loans and advances to customers (gross) (2) | 47,434 | (5.7) | 2.0 | 50,316 |
| Non-performing loans and guarantees given | 1,834 | 12.0 | 19.9 | 1,637 |
| Customer deposits under management (3) | 44,991 | (6.9) | 1.7 | 48,334 |
| Off-balance sheet funds (4) | 12,323 | 3.5 | 12.1 | 11,902 |
| Risk-weighted assets | 53,755 | (6.4) | 2.2 | 57,443 |
| Efficiency ratio (%) | 46.2 | 46.7 | ||
| NPL ratio (%) | 3.5 | 2.9 | ||
| NPL coverage ratio (%) | 94 | 103 | ||
| Cost of risk (%) | 1.52 | 1.15 |
- (1) Figures at constant exchange rate.
- (2) Excluding repos.
- (3) Excluding repos and including specific marketable debt securities.
- (4) Includes mutual funds, pension funds and other off-balance sheet funds.
South America. Data per country (Million euros)
| Operating income | Net attributable profit | |||||||
|---|---|---|---|---|---|---|---|---|
| Country | 1H17 | ∆% | ∆% (1) | 1H16 | 1H17 | ∆% | ∆% (1) | 1H16 |
| Argentina | 232 | (15.2) | (9.8) | 273 | 106 | (13.7) | (8.2) | 123 |
| Chile | 219 | 42.6 | 32.5 | 153 | 96 | 75.6 | 63.2 | 54 |
| Colombia | 329 | 25.4 | 13.9 | 262 | 84 | (34.2) | (40.3) | 128 |
| Peru | 365 | 11.8 | 5.1 | 326 | 85 | 76 | 1.1 | 79 |
| Other countries (1) | 67 | 7.0 | 36.4 | 62 | 33 | 253.1 | 87.5 | 9 |
| Total | 1,211 | 12.4 | 9.4 | 1,078 | 404 | 2.7 | (3.0) | 394 |
- (1) Figures at constant exchange rate.
- (2) Venezuela, Paraguay, Uruguay and Bolivia. Additionally, it includes eliminations and other charges.
South America. Relevant business indicators per country (Million euros)
| Argentina | Chile | Colombia | Peru | |||||
|---|---|---|---|---|---|---|---|---|
| 30-06-17 | 31-12-16 | 30-06-17 | 31-12-16 | 30-06-17 | 31-12-16 | 30-06-17 | 31-12-16 | |
| Loans and advances to customers (gross) (1.2) | 4,729 | 4,073 | 14,240 | 13,676 | 12,027 | 11,603 | 13,172 | 13,906 |
| Deposits from customers | 45 | 36 | 373 | 404 | 634 | 455 | 686 | 649 |
| Customer deposits under management (1.3) | 6,646 | 6,059 | 9,011 | 9,377 | 12,123 | 11,584 | 12,217 | 12,792 |
| Off-balance sheet funds (1.4) | 1,392 | 967 | 1,554 | 1,392 | 982 | 676 | 1,546 | 1,454 |
| Risk-weighted assets | 8,785 | 8,717 | 13,417 | 14,300 | 11,805 | 12,185 | 15,536 | 17,400 |
| Efficiency ratio (%) | 60.1 | 53.8 | 44.9 | 49.1 | 36.5 | 38.9 | 36.3 | 35.8 |
| NPL ratio (%) | 0.9 | 0.8 | 2.4 | 2.6 | 5.1 | 3.5 | 4.1 | 3.4 |
| NPL coverage ratio (%) | 294 | 391 | 69 | 66 | 86 | 105 | 101 | 106 |
| Cost of risk (%) | 1.13 | 1.48 | 0.84 | 0.74 | 2.83 | 1.34 | 1.43 | 1.31 |
- (1) Figures at constant exchange rates.
- (2) Excluding repos.
- (3) Excluding repos and including specific marketable debt securities.
- (4) Includes mutual funds, pension funds and other off-balance sheet funds.