Banking activity in Spain
Highlights
- Less deleveraging affecting lending, decline in time deposits and increase in more liquid customer deposits and mutual funds.
- Good performance of fees and commissions.
- Positive trend in operating expenses.
- Restructuring costs booked to improve efficiency.
- Stability of risk indicators.
Business activity (1)
(Year-on-year change. Data as of 30-06-2017)
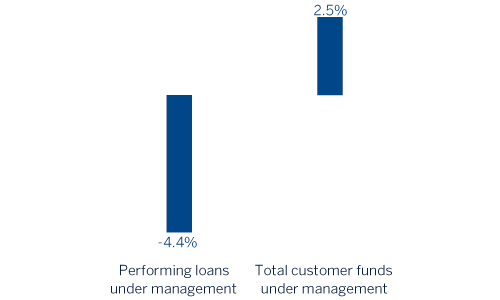
(1) Excluding repos.
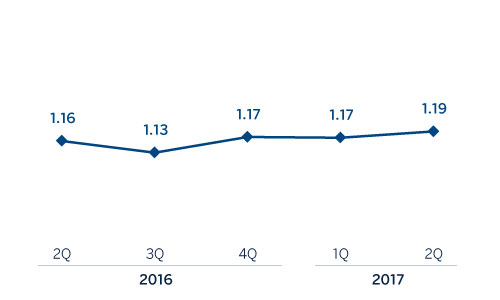
Net interest income/ATA
(Percentage)
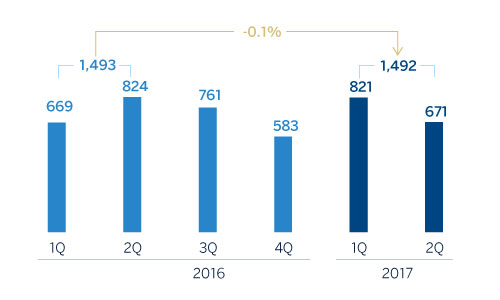
Operating income (Million euros)
Net attributable profit (Million euros)

Breakdown of performing loans under management (1)
(30-06-2017)

Breakdown of customer funds under management (1)
(30-06-2017)
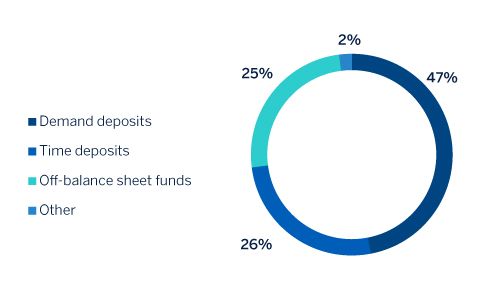
(1) Excluding repos.
(1) Excluding repos.
Macro and industry trends
According to the latest data from the National Institute for Statistics (INE), the Spanish economy picked up again in the first quarter of 2017, with quarterly GDP growth of 0.8%. In addition, the data available to date suggest that it could have continued to gain some traction in the second quarter. This performance is supported by the improvement in investment and exports, despite the uncertainty generated by Brexit, while a lower contribution is expected from household consumption and tighter control of spending by public administrations. As a result, GDP growth could be more than 3% in 2017, according to estimates by BBVA Research.
In the Spanish financial system, the private residential sector continues its deleveraging, but the rate is slowing. Total domestic private-sector lending fell by 2.1% in year-on-year terms according to Bank of Spain data through March 2017, even though new lending to households and SMEs, has risen for 41 consecutive months (from January 2014 to May 2017). New lending to the retail sector increased by 3.5% in year-on-year terms, with cumulative figures through May 2017. Total new lending has grown by 1.3% in the same period, despite the decline in new lending to large companies (down 2.4%) and the fall in mortgage loans (down 9.4%). Asset quality indicators in the system continue to improve. The sector NPL ratio stood at 8.8% in March, 116 basis points below the previous year, on the back of a significant reduction in non-performing loans (down 13.5% year-on-year and 43% down on the high of December 2013). The system's profitability began to recover to more positive levels in the first quarter of 2017, after the decline in the last quarter of last year, due partly to the increase in provisions linked to the Court of Justice of the European Union ruling on floor clauses. As a result, the sector ROE closed March 2017 at 6.2%. The liquidity position of Spanish institutions is good. The funding gap (difference between loans and deposits) is currently at an all-time low, at under 4.5% of the total balance. Finally, May 2017 data show that banks increased their recourse to ECB liquidity by 36% over the last twelve months, taking advantage of the final TLTRO (targeted longer-term refinancing operations) auctions.
Activity
Lending (performing loans under management) closed the first half year at €168,450m. This represents an increase of 0.7% on the figure for the close of March 2017, although it is a fall of 0.4% on the close of 2016. There has been a notable performance of commercial loans and consumer finance (up 2.7% and 12.9%, respectively over the last six months), which continue to perform well in terms of new production, with year-on-year growth of 12.8% in commercial and 24.0% in consumer finance. This contrasts with a decline in the residential mortgage and public-sector portfolios (down 3.3% and 1.6%, respectively during this period).
As regards asset quality, there has been another decline in net additions to NPL, and together with the trend in lending mentioned above, has left the NPL ratio as of 30-Jun-2017 at 5.7%. The NPL coverage ratio remains at 53%.
Customer deposits under management have performed favorably in the last three months (up 1.4%). In the first half, they have maintained similar levels to the close of December 2016. By product, there has been a decrease of 14.7% in time deposits and an increase of 10.5% in current and savings accounts.
Finally, off-balance-sheet funds have performed well, with growth of 4.9% over the half-year and 2.4% over the quarter. This performance is largely driven by the progress made by mutual funds (up 8.2% over the half-year and 3.8% over the quarter).
Results
The key highlights of the income statement in the area in the first half of 2017 are as follows:
- 3.9% year-on-year decline in cumulative net interest income through June of 2017 as a result of a lower loan volumes and sales of wholesale portfolios, and despite the good management of customer spread.
- Positive performance of net fees and commissions, thanks to the positive contribution from the wholesale businesses. They have increased by 3.0% compared with the same period of 2016.
- Contribution from NTI is lower than in the first half of the previous year, strongly influenced by the gains from the VISA deal in the second quarter of 2016.
- The other income/expenses heading registered an increase of 23.3% year-on-year. A highlight in this category is insurance activity, which has grown by 8.5% thanks to the good performance of earnings from the insurance underwriting margins, strongly linked to the increase in new policies in the period and the low claims ratio. This line also includes the annual contribution of €98m in the second quarter to the Single Resolution Fund (€117m in the same period in 2016).
- Thus the area's gross income has declined (down 2.5%), affected mainly by sales of portfolios and the NTI generated in the VISA deal in 2016.
- Operating expenses continue to perform well, with a decline of 4.4% compared with the first half of 2016. This reduction is still linked to the synergies related to the integration of Catalunya Banc and the continued implementation of efficiency plans (in May 59 branches were closed in addition to the 129 closed in February).
- As a result, the efficiency ratio closed the half year at 53.4% and operating income stands at very similar levels to the first six months of 2016.
- Impairment losses on financial assets declined by 40.6% year-on-year as a result of reduced provisioning requirements. The cost of risk closed the half-year at 0.34%.
- Finally, the provisions (net) and other gains (losses) heading increased significantly, mainly due to higher restructuring costs.
As a result, the net attributable profit generated by Banking activity in Spain in the first half of 2017 stands at €670m, a year-on-year increase of 8.0%, strongly influenced by the positive performance of operating expenses and loan-loss provisions.
Financial statements and relevant business indicators (Million euros and percentage)
| Income statement | 1H17 | ∆% | 1H16 |
|---|---|---|---|
| Net interest income | 1,865 | (3.9) | 1,941 |
| Net fees and commissions | 783 | 3.0 | 760 |
| Net trading income | 318 | (18.5) | 390 |
| Other income/expenses | 235 | 23.3 | 191 |
| of which insurance activities (1) | 227 | 8.5 | 209 |
| Gross income | 3,201 | (2.5) | 3,282 |
| Operating expenses | (1,709) | (4.4) | (1,789) |
| Personnel expenses | (964) | (3.9) | (1,003) |
| Other administrative expenses | (585) | (6.4) | (625) |
| Depreciation | (161) | (0.3) | (161) |
| Operating income | 1,492 | (0.1) | 1,493 |
| Impairment on financial assets (net) | (302) | (40.6) | (509) |
| Provisions (net) and other gains (losses) | (247) | 185.5 | (86) |
| Profit/(loss) before tax | 943 | 5.0 | 898 |
| Income tax | (271) | (1.7) | (276) |
| Profit/(loss) for the year | 672 | 7.9 | 622 |
| Non-controlling interests | (1) | (28.1) | (2) |
| Net attributable profit | 670 | 8.0 | 621 |
- (1) Includes premiums received net of estimated technical insurance reserves.
| Balance sheets | 30-06-17 | ∆% | 31-12-16 |
|---|---|---|---|
| Cash, cash balances at central banks and other demand deposits | 11,315 | (7.5) | 12,230 |
| Financial assets | 88,223 | (12.1) | 100,394 |
| Loans and receivables | 208,151 | (3.0) | 214,497 |
| of which loans and advances to customers | 179,920 | (0.7) | 181,137 |
| Inter-area positions | 5,025 | 7.9 | 4,658 |
| Tangible assets | 1,007 | (29.9) | 1,435 |
| Other assets | 2,283 | (13.3) | 2,632 |
| Total assets/liabilities and equity | 316,003 | (5.9) | 335,847 |
| Financial liabilities held for trading and designated at fair value through profit or loss | 36,244 | (10.5) | 40,490 |
| Deposits from central banks and credit institutions | 55,919 | (15.3) | 66,029 |
| Deposits from customers | 181,812 | 0.7 | 180,544 |
| Debt certificates | 32,437 | (15.4) | 38,322 |
| Inter-area positions | - | - | - |
| Other liabilities | 580 | (52.5) | 1,220 |
| Economic capital allocated | 9,013 | (2.5) | 9,242 |
| Relevant business indicators | 30-06-17 | ∆% | 31-12-16 |
|---|---|---|---|
| Loans and advances to customers (gross) (1) | 179,649 | (0.5) | 180,595 |
| Non-performing loans and guarantees given | 11,536 | (2.4) | 11,819 |
| Customer deposits under management (2) | 174,782 | (0.0) | 174,809 |
| Off-balance sheet funds (3) | 58,891 | 4.9 | 56,147 |
| Risk-weighted assets | 107,754 | (4.8) | 113,194 |
| Efficiency ratio (%) | 53.4 | 55.8 | |
| NPL ratio (%) | 5.7 | 5.8 | |
| NPL coverage ratio (%) | 53 | 53 | |
| Cost of risk (%) | 0.34 | 0.32 |
- (1) Figures at constant exchange rate.
- (2) Excluding repos.
- (3) Includes mutual funds, pension funds and other off-balance sheet funds.