The most relevant aspects
-

FEBRUARY
BBVA concludes the sale of its stake in CNCB
Read more
-
FEBRUARY
BBVA raises stake in Garanti to 49.85%
Read more
-

MAY
BBVA launches its Open Banking business
Read more
-
JULY
BBVA, the best mobile banking service in the world
Read more
-

SEPTEMBER
BBVA launches BBVA Bconomy
Read more
-

SEPTEMBER
BBVA adopts recommendations on climate change
Read more
-

OCTOBER
BBVA launches Tuyyo
Read more
-
NOVEMBER
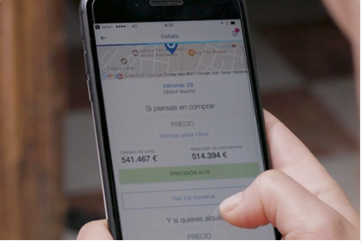
BBVA reduces its real estate exposure almost entirely
Read more
-

DECEMBER
Agreement with Scotiabank to sell Chile
Read more