
Mexico
Highlights
- Favorable performance of the portfolio, with greater dynamism of the retail segment
- Increase in net interest income as a result of effective spread management
- Outstanding evolution of the efficiency ratio
- Significant growth in net attributable profit
Business activity (1)
(VARIATION AT CONSTANT EXCHANGE RATE COMPARED TO
31-12-22)
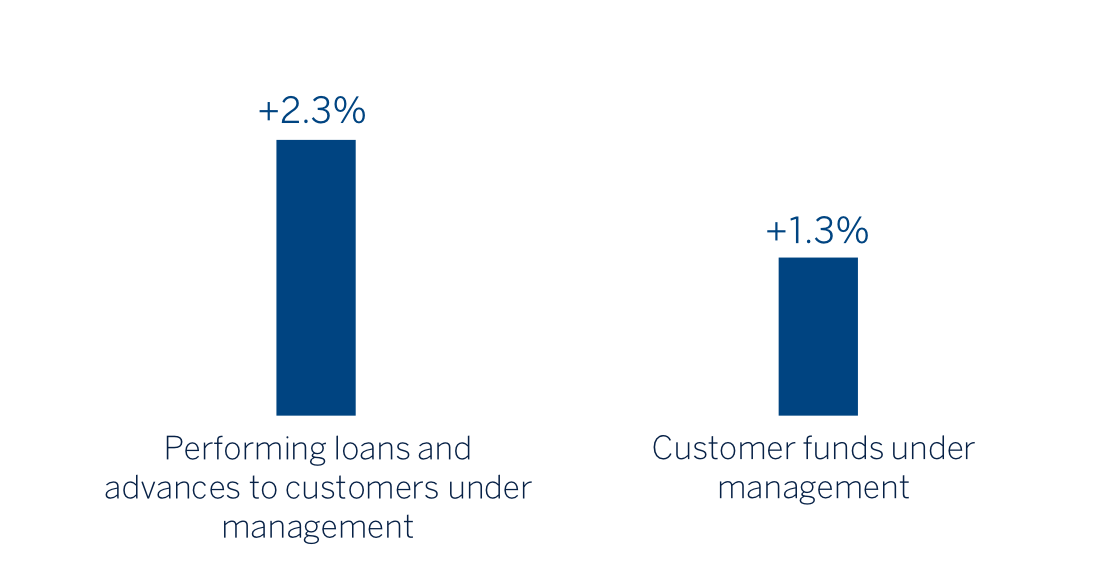
(1) Excluding repos.
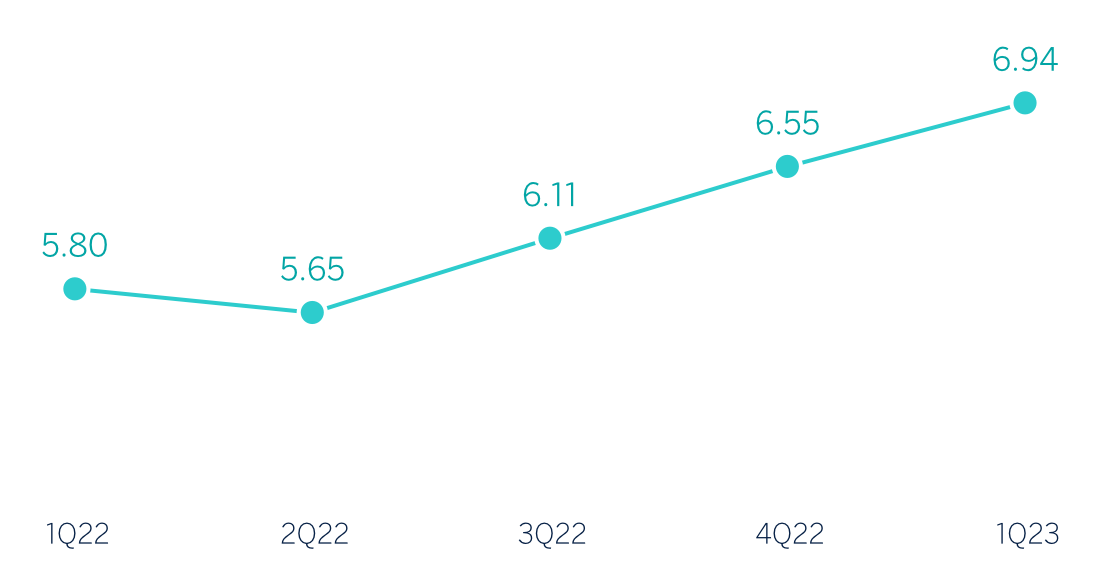
Net interest income/ AVERAGE TOTAL ASSETS
(PERCENTAGE AT CONSTANT EXCHANGE RATE)
Operating income
(Millions of euros at constant exchange rate)
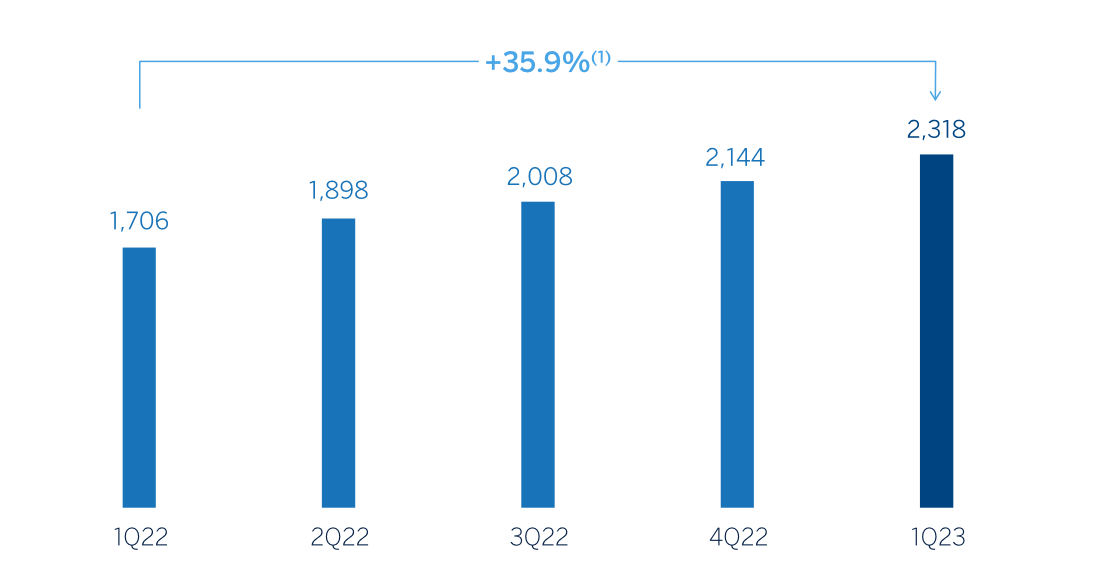
(1) At current exchange rate: +55.9%.
Net attributable profit (LOSS)
(Millions of euros at constant exchange rate)
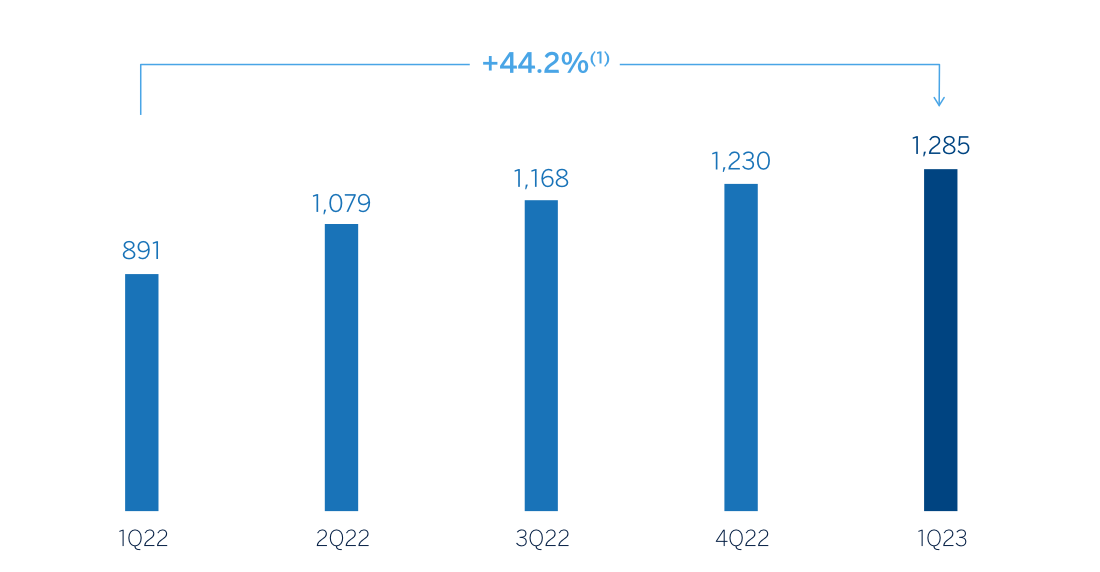
(1) At current exchange rate: +65.4%.
Financial statements and relevant business indicators (Millions of euros and percentage)
| Income statement | 1Q23 | ∆% | ∆% (1) | 1Q22 (2) |
|---|---|---|---|---|
| Net interest income | 2,589 | 48.2 | 29.2 | 1,748 |
| Net fees and commissions | 483 | 40.4 | 22.4 | 344 |
| Net trading income | 149 | 61.9 | 41.1 | 92 |
| Other operating income and expenses | 86 | 77.2 | 54.5 | 48 |
| Gross income | 3,306 | 48.2 | 29.2 | 2,232 |
| Operating expenses | (988) | 32.8 | 15.7 | (744) |
| Personnel expenses | (455) | 37.3 | 19.7 | (332) |
| Other administrative expenses | (424) | 31.6 | 14.8 | (322) |
| Depreciation | (109) | 20.0 | 4.6 | (90) |
| Operating income | 2,318 | 55.9 | 35.9 | 1,487 |
| Impairment on financial assets not measured at fair value through profit or loss | (549) | 31.2 | 14.4 | (419) |
| Provisions or reversal of provisions and other results | (1) | (38.7) | (46.5) | (1) |
| Profit (loss) before tax | 1,768 | 65.6 | 44.4 | 1,067 |
| Income tax | (483) | 66.2 | 44.9 | (291) |
| Profit (loss) for the period | 1,285 | 65.4 | 44.2 | 777 |
| Non-controlling interests | (0) | 69.6 | 47.8 | (0) |
| Net attributable profit (loss) | 1,285 | 65.4 | 44.2 | 777 |
| Balance sheets | 31-03-23 | ∆% | ∆% (1) | 31-12-22 (2) |
|---|---|---|---|---|
| Cash, cash balances at central banks and other demand deposits | 12,726 | (3.8) | (9.4) | 13,228 |
| Financial assets designated at fair value | 48,366 | 3.8 | (2.2) | 46,575 |
| Of which: Loans and advances | 1,386 | (8.0) | (13.4) | 1,507 |
| Financial assets at amortized cost | 84,617 | 9.6 | 3.2 | 77,191 |
| Of which: Loans and advances to customers | 77,277 | 8.5 | 2.2 | 71,231 |
| Tangible assets | 2,098 | 6.5 | 0.3 | 1,969 |
| Other assets | 4,148 | 15.4 | 8.7 | 3,593 |
| Total assets/liabilities and equity | 151,955 | 6.6 | 0.4 | 142,557 |
| Financial liabilities held for trading and designated at fair value through profit or loss | 28,035 | 8.5 | 2.2 | 25,840 |
| Deposits from central banks and credit institutions | 6,862 | 55.9 | 46.8 | 4,402 |
| Deposits from customers | 80,172 | 3.1 | (2.9) | 77,750 |
| Debt certificates | 8,317 | 7.2 | 1.0 | 7,758 |
| Other liabilities | 19,224 | 13.2 | 6.6 | 16,976 |
| Regulatory capital allocated | 9,344 | (4.9) | (10.5) | 9,831 |
| Relevant business indicators | 31-03-23 | ∆% | ∆% (1) | 31-12-22 |
|---|---|---|---|---|
| Performing loans and advances to customers under management (3) | 77,997 | 8.6 | 2.3 | 71,788 |
| Non-performing loans | 1,951 | 0.6 | (5.3) | 1,939 |
| Customer deposits under management (3) | 79,665 | 3.3 | (2.7) | 77,117 |
| Off-balance sheet funds (4) | 44,408 | 16.3 | 9.5 | 38,196 |
| Risk-weighted assets | 78,316 | 9.2 | 2.8 | 71,738 |
| Efficiency ratio (%) | 29.9 | 31.7 | ||
| NPL ratio (%) | 2.3 | 2.5 | ||
| NPL coverage ratio (%) | 137 | 129 | ||
| Cost of risk (%) | 2.88 | 2.49 |
- (1) At constant exchange rate.
- (2) Restated balances according to IFRS17 - Insurance contracts.
- (3) Excluding repos.
- (4) Includes mutual funds, customer portfolios and other off-balance sheet funds
Macro and industry trends
Economic activity is likely to lose some of the dynamism it showed in 2022, when GDP grew by 3.1%, slightly above BBVA Research's forecast. However, the moderation this year will be less accentuated than previously expected: GDP will grow by 1.4%, eight tenths of a percentage point more than the forecast of three months ago, supported mainly by private consumption. Inflation, which closed 2022 at 7.8%, reached 6.9% in March and could average around 5.7% in 2023, well above the inflation target. Price pressures, as well as the monetary policy stance in the United States, are likely to contribute to Banxico maintaining official interest rates at current levels of 11.25%, or even slightly higher, until the end of the year.
As for the banking system, with data as of the end of February 2023, the volume of outstanding credit to the non-financial private sector increased by 12.8% year-on-year, with a greater boost from the consumer portfolio (+18.0%) in relation to mortgages and companies (+11.8% and +11.2%, respectively). Total deposits growth moderated slightly to 6.1% year-on-year in February 2023, highlighting the incipient shift towards time deposits (+13.1% year-on-year). The system's NPL ratio remains stable at around 2.35% in February 2023 and capital indicators are at comfortable levels.
Unless expressly stated otherwise, all the comments below on rates of change, for both activity and results, will be given at constant exchange rate. These rates, together with changes at current exchange rates, can be found in the attached tables of financial statements and relevant business indicators.
Activity
The most relevant aspects related to the area's activity in the first quarter of 2023 were:
- Lending activity (performing loans under management) grew by 2.3% between January and March 2023, with a more dynamic growth in the retail portfolio. The wholesale portfolio, which includes larger companies and the public sector, recorded a growth of 1.2%, highlighting the dynamism of the corporate banking segment, partially explained by fewer corporate bond issuances due to the high cost of accessing wholesale financing markets. For its part, the retail portfolio grew at a rate of 3.2%. Within this segment, loans to SMEs grew by 6.7%, consumer loans by 4.4%, mortgage loans by 2.1%, and credit cards surprised positively with an increase of 1.7% in the quarter which is usually affected by the seasonal effect of the year-end campaigns. The aforementioned has supported a stable composition in lending activity, with a balanced distribution in lending between wholesale and retail portfolio.
- With regard to the asset quality indicators, the NPL ratio decreased to 2.3% at the end of March 2023, which represents a reduction of 18 basis points compared to the previous year-end, with lower non-performing loans volume, mainly due to the management of write-offs and a good level of recoveries, as well as to the effect of the increase in activity. For its part, the NPL coverage ratio stood at 137% at the end of March 2023, showing an increase in the quarter as a result of the decrease of the non-performing loans volume, excluding the impact of changes in the exchange rate.
- Customer deposits under management decreased between January and March 2023 (-2.7%), as retail customer balances at the end of the previous year recorded extraordinary remunerations, which are typically used during the first quarter. For its part, thanks to the commercial effort and the strategy to promote the growth of investment funds, with lower commissions in a highly competitive environment, off-balance sheet funds grew at a rate of 9.5% between January and March 2023.
Results
In Mexico, BBVA achieved a net attributable profit of €1,285m by the end of the first quarter of 2023, representing an increase of 44.2% compared to the same period in 2022, mainly as a result of the boost in lending activity and improvement in the customer spread, which translated into significant growth in net interest income and, to a lesser extent, fee and commission income.
The most relevant aspects of the year-on-year changes in the income statement at the end of March 2023 are summarized below:
- Net interest income grew by a remarkable 29.2%, as a result of strong lending and effective price management, in a context of rising interest rates, with an improvement in customer spreads.
- Net fees and commissions increased by 22.4% thanks to a higher volume of customer transactions, especially in credit cards, as well as to the income derived from mutual funds management.
- The contribution from NTI increased (+41.1%), due to the good management of Global Markets and, to a lesser extent, foreign exchange trading.
- Other operating income and expenses grew by 54.5% due to the good performance of the insurance business.
- Operating expenses increased (+15.7%), mainly due to higher personnel expenses for salary adjustment and increase in workforce in a context of strong momentum in activity and the increase of general expenses linked to inflation, particularly marketing and technology. Despite the above, the efficiency ratio continued to evolve favorably, with a significant improvement of 346 basis points compared to twelve months earlier.
- Loan-loss provisions increased (+14.4%), mainly due to the higher provisioning needs of the retail portfolio. As a result, the cumulative cost of risk at the end of March 2023 stood at 2.88%, in line with the one registered at the end of March 2022.