The United States highlights in the fourth quarter
- Positive trend in activity, strongly supported by local businesses.
- Cost control.
- Superior asset quality.
- Technological platform implemented in all branches.
Industry Trends
In the United States, the health of the banking system is continuing to recover, and there are now fewer institutions facing problems. Most banks are increasing earnings, asset quality, capital and liquidity.
The main reason for better earnings is the improvement in asset quality, which has had a positive impact on loan-loss provisions, as it has freed up loan-loss reserves. However, revenue growth has been limited due to the current environment of low interest rates and a relatively flat curve. This has put strong pressure on net interest income in the sector.
In lending, the commercial and industrial sectors continued to perform well, despite the uncertainty regarding fiscal policy. In the fourth quarter, this growth is even clearer in commercial real estate (companies with collateral) and in credit card balances (due to the Christmas holiday season). Lending conditions are likely to remain strict in 2013, particularly for residential loans, in light of the high financial burden of households.
The main indicators of asset quality continue to show a positive trend. This marks the 11th consecutive quarter of improvement. In spite of this, the NPA ratio in the residential portfolio rose slightly in the third quarter of 2012.
Deposit growth remained robust throughout the year, as a lack of high-yielding investment alternatives and fiscal cliff uncertainties likely aided balances.
Income statement
(Million euros)
Download table in Excel
|
|
Units: |
|
The United States |
BBVA Compass |
|
2012 |
Δ% |
Δ% (1) |
2011 |
2012 |
Δ% |
Δ% (1) |
2011 |
| Net interest income |
1,682 |
2.8 |
(4.7) |
1,635 |
1,467 |
4.3 |
(3.2) |
1,400 |
| Net fees and commissions |
603 |
(4.8) |
(11.1) |
633 |
511 |
(2.3) |
(10.0) |
525 |
| Net trading income |
160 |
14.5 |
7.5 |
140 |
120 |
24.9 |
17.9 |
94 |
| Other income/expenses |
(49) |
(41.8) |
(46.3) |
(84) |
(44) |
(41.5) |
(50.2) |
(83) |
| Gross income |
2,395 |
3.1 |
(4.2) |
2,324 |
2,054 |
5.5 |
(2.0) |
1,936 |
| Operating costs |
(1,583) |
5.8 |
(1.7) |
(1,497) |
(1,394) |
6.5 |
(1.0) |
(1,300) |
| Personnel expenses |
(875) |
6.7 |
(0.8) |
(820) |
(770) |
7.0 |
(0.5) |
(715) |
| General and administrative expenses |
(521) |
2.8 |
(4.5) |
(507) |
(442) |
4.6 |
(2.9) |
(420) |
| Deprecation and amortization |
(188) |
10.4 |
2.0 |
(170) |
(182) |
9.5 |
2.1 |
(165) |
| Operating income |
812 |
(1.8) |
(8.6) |
827 |
659 |
3.3 |
(4.2) |
636 |
| Impairment on financial assets (net) |
(90) |
(73.8) |
(75.9) |
(346) |
(53) |
(75.5) |
(85.1) |
(332) |
| Provisions (net) and other gains (losses) |
(54) |
(96.4) |
(96.7) |
(1,501) |
(45) |
(87.3) |
(97.2) |
(1,480) |
| Income before tax |
667 |
n.s. |
n.s. |
(1,020) |
561 |
n.s. |
n.s. |
(1,175) |
| Income tax |
(192) |
n.s. |
n.s. |
329 |
(174) |
n.s. |
n.s. |
362 |
| Net income |
475 |
n.s. |
n.s. |
(691) |
387 |
n.s. |
n.s. |
(814) |
| Non-controlling interests |
0 |
n.s. |
n.s. |
(0) |
- |
- |
- |
- |
| Net attributable profit |
475 |
n.s. |
n.s. |
(691) |
387 |
n.s. |
n.s. |
(814) |
| Net one-offs (2) |
0 |
(100.0) |
(100.0) |
(1,011) |
0 |
(100.0) |
- |
(1,011) |
| Net attributable profit (excluding one-offs) (2) |
475 |
48.4 |
39.6 |
320 |
387 |
96.1 |
81.1 |
197 |
(1) At constant exchange rate.
(2) In 2011, during the fourth quarter, US goodwill impairment charge.
Balance sheet
(Million euros)
Download table in Excel
|
|
Units: |
|
The United States |
BBVA Compass |
|
31-12-12 |
Δ% |
Δ% (1) |
31-12-11 |
31-12-12 |
Δ% |
Δ% (1) |
31-12-11 |
| Cash and balances with central banks |
5,384 |
59.3 |
62.4 |
3,380 |
4,339 |
95.7 |
110.4 |
2,103 |
| Financial assets |
7,584 |
(9.9) |
(8.1) |
8,418 |
7,508 |
0.3 |
2.3 |
7,486 |
| Loans and receivables |
38,311 |
(9.6) |
(7.9) |
42,397 |
34,945 |
4.7 |
7.2 |
33,228 |
| Loans and advances to customers |
36,068 |
(11.3) |
(9.6) |
40,677 |
33,018 |
2.5 |
4.8 |
32,118 |
| Loans and advances to credit institutions and other |
2,243 |
30.4 |
33.0 |
1,720 |
1,927 |
66.2 |
77.0 |
1,110 |
| Inter-area positions |
- |
- |
- |
- |
416 |
n.s. |
n.s. |
0 |
| Tangible assets |
745 |
(10.5) |
(8.8) |
833 |
729 |
(7.3) |
(6.4) |
794 |
| Other assets |
1,825 |
(16.2) |
(14.6) |
2,179 |
1,704 |
(10.4) |
(9.8) |
1,927 |
| Total assets/Liabilities and equity |
53,850 |
(5.9) |
(4.0) |
57,207 |
49,641 |
8.1 |
11.2 |
45,538 |
| Deposits from central banks and credit institutions |
6,652 |
(8.6) |
(6.8) |
7,278 |
3,901 |
(4.6) |
(3.3) |
4,112 |
| Deposits from customers |
39,132 |
1.9 |
4.0 |
38,384 |
38,378 |
9.7 |
12.9 |
34,659 |
| Debt certificates |
- |
(100.0) |
(100.0) |
363 |
- |
- |
- |
- |
| Subordinated liabilities |
848 |
(30.0) |
(28.6) |
1,211 |
800 |
(15.2) |
(15.3) |
963 |
| Inter-area positions |
203 |
(91.8) |
(91.6) |
2,466 |
- |
- |
- |
- |
| Financial liabilities held for trading |
352 |
(22.6) |
(21.0) |
454 |
351 |
(18.2) |
(18.6) |
440 |
| Other liabilities |
4,025 |
9.6 |
11.7 |
3,673 |
3,837 |
32.7 |
39.0 |
2,814 |
| Economic capital allocated |
2,638 |
(21.9) |
(20.4) |
3,379 |
2,374 |
(6.2) |
(5.0) |
2,549 |
(1) At constant exchange rate
Significant ratios
(Percentage)
Download table in Excel
|
The United States |
|
31-12-12 |
30-09-12 |
31-12-11 |
| Efficiency ratio |
66.1 |
65.2 |
64.4 |
| NPA ratio |
2.4 |
2.4 |
3.5 |
| NPA coverage ratio |
90 |
94 |
73 |
| Risk premium |
0.23 |
0.30 |
0.89 |
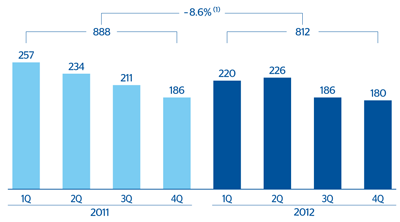
The United States. Operating income
(Million euros at constant exchange rate)
(1) At current exchange rate: –1.8%.
The United States. Net attributable profit (adjusted)
(Million euros at constant exchange rate)
(1) At current exchange rate: +48.4%.