
As explained in section 2.3 of this Document, BBVA Group has a General Risk Management and Control model that is adapted to its business model, organization and the geographical areas in which it operates.
This Model is applied comprehensively in the Group and is made up of the basic elements set out below:
The Group promotes the development of a risk culture that ensures the consistent application of the Risk Management and Control Model within the Group and guarantees that the risk function is understood and permeates throughout all the levels of the organization.
The risk governance model in BBVA is characterized by the strong involvement of its corporate bodies, both in establishing the risk strategy and in the continuous monitoring and supervising of its implementation.
Thus, as explained below, it is the corporate bodies that approve the risk strategy and the corporate policies for the different types of risks. The risk function is responsible within the scope of its management for implementing and developing the risk strategy, being answerable for it to the corporate bodies.
The responsibility for the day-to-day management of risks corresponds to the businesses, which engage in their business following the policies, rules, procedures, infrastructures and controls that are based on the framework set by the company bodies and defined by the risk function.
To carry out this work adequately, the risk function in the BBVA Group has been set up as a single, global function that is independent of the commercial areas.
The Board of Directors (hereinafter “the Board”) approves the risk strategy and supervises the internal control and management systems. Specifically, in relation to the risk strategy, the Board approves the Group’s Risk Appetite statement, the core metrics and the main metrics by type of risk, as well as the General Risk Management and Control Model.
The Board of Directors is also responsible for approving and monitoring the strategic and business plan, the annual budgets and management goals, as well as the investment and funding policy, in a consistent way and in line with the approved Risk Appetite Framework. For this reason, the processes for defining the Risk Appetite Framework proposals and strategic and budgetary planning at Group level are coordinated by the executive area for submission to the Board.
To ensure the integration of the Risk Appetite Framework into management, on the basis established by the Board of Directors, the Executive Committee (EC) approves the metrics by type of risk in relation to concentration, profitability and reputational and the Group’s basic structure of limits at geographical area, risk type, asset type and portfolio level. This Committee also approves specific corporate policies for each type of risk.
Lastly, the Board of Directors comprises a committee specializing in risks, the Risks Committee (RC), that assists the Board and the Executive Committee in determining the Group’s risk strategy and the risk limits and policies, respectively, analyzing and assessing beforehand the proposals submitted to those bodies. In 2016, the Risks Committee held 38 meetings.
The amendment of the Group’s risk strategy and of its elements is the exclusive power of the BBVA Board of Directors, while the Executive Committee is responsible for amending the metrics by type of risk within its scope of decision and the Group’s basic structure of limits, when applicable. In both cases, the amendments follow the same decision-making process described above, so the proposals for amendment are submitted by the executive area (CRO) and later analyzed, first by the Risks Committee, for later submission to the Board of Directors or to the Executive Committee, as appropriate.
Moreover, the Risks Committee, the Executive Committee and the Board itself conduct proper monitoring of the risk strategy implementation and of the Group’s risk profile. The risks function regularly reports on the development of the Group’s Risk Appetite Framework metrics to the Board and to the Executive Committee, after their analysis by the Risks Committee, whose role in this monitoring and control work is particularly relevant. In addition to ongoing supervision and control which performs the risk function and reports to the governing bodies, in the event of deviation from the maximum appetite levels (or maximum capacity) set for the core metrics or by type of risk, or in the event of an overlimit in the basic structure, as approved by the governing bodies, the Risks Committee is informed of the situation, following analysis by the executive areas in the relevant top-level committees. Following the Risks Committee report, the situation is reported to the governing bodies that approved the exceeded metric. Whatever the case, reports will be given on the pertinent corrective measures, as appropriate, and which must be agreed by the governing bodies and, in the executive sphere, by the corresponding area.
The head of the risk function in the executive line, the Corporate Risk Officer (CRO) carries out his work with the independence, authority, rank, experience, knowledge and resources required. He is appointed by the Bank’s Board of Directors, as a member of its senior management, and has direct access to its corporate bodies (the Board of Directors, the Executive Committee and the Risks Committee), to which he reports regularly on the risk situation in the Group.
To perform his functions better, the CRO is supported by a structure made up of crosscutting risk units in the corporate area and specific risk units in the Group’s geographical and/or business areas. Each of these units, within their field of competence, carries out risk management and control functions and ensures the implementation of the corporate policies and rules approved at the Group level in a consistent manner, adapting them if necessary to the local requirements and reporting to the local governing bodies.
The Risk Managers of these geographical and/or business areas answer to both the Group Risk Director and the head of the geographical and/or business area. This system of co-dependence aims to ensure the interdependence of the local risk function from the operational functions, and allows them to be aligned with the Group’s corporate policies and objectives with respect to risks.
As mentioned above, the risk function comprises the corporate area risk units, which carry out cross-cutting functions, and the risk units of the geographical and/or business areas.
The corporate area risk units develop and submit to the Corporate Risk Officer (CRO) the proposal for the Group’s Risk Appetite Framework, the corporate policies, rules, procedures and global infrastructures within the framework of action approved by the corporate bodies; they ensure their correct application and report directly or through the CRO to the Bank’s corporate bodies. Among their functions are:
Management of the different types of risks at Group level, in accordance with the strategy defined by the corporate bodies.
Planning of risks in line with the Risk Appetite Framework principles defined by the Group.
Monitoring and control of the Group’s risk profile in relation to the Risk Appetite Framework approved by the Bank’s corporate bodies, providing precise and reliable information with the frequency and in the format required.
Carrying out prospective analyses that can evaluate compliance with the Risk Appetite Framework in stress scenarios and analyze the mechanisms for mitigating the effect.
Management of the technological and methodological developments required for development of the Model in the Group.
Articulating Group’s Internal Risk Control model and defining the methodology, corporate criteria and procedures to identify and prioritize the risk inherent to each unit’s activities and processes.
Validation of the models used and the results obtained by them to verify whether they are appropriate to the different uses to which they are applied.
The risk units in the business units develop and submit to the Chief Risk Officer of the geographical and/or business area the Risk Appetite Framework proposal applicable in each geographical and/or business area, independently and always within the Group’s strategy/Risk Appetite Framework.
Moreover, they ensure that the approved corporate policies and rules are applied consistently at Group level, adapting them where appropriate to local requirements; they are provided with the adequate infrastructures for the management and control of their risks, within the global risk infrastructure framework defined by the corporate areas, and report, where appropriate, to the corporate bodies and senior management.
Thus the local risk units work with the corporate risk units with the aim of adapting to the risk strategy at Group level and pooling all the information necessary to monitor changes in risks.
The risk function’s decision-making process is based on a committee structure. The Global Risk Management Committee (GRMC) is the main committee in the risk function. It proposes, checks, and approves, where appropriate, items such as the internal regulatory framework for risks, the procedures and infrastructures needed to identify, evaluate, measure and manage the risks faced by the Group in carrying out its business, approves the risk limits by portfolio or counterparty, and the admission of the operations with the most relevant risks.
The members of this Committee are the CRO and the heads of the risk units of the corporate area and the most representative geographical and/or business areas.
The GRMC operates through various support committees, including the following:
Global Technical Operations Committee: Its aim is to take decisions related to wholesale credit risk admission from certain customer segments.
Information, Monitoring & Reporting Committee: Guarantees the existence and proper development of the aspects relating to information management, risk tracking and reporting with a comprehensive and cross-cutting approach.
Asset Allocation Committee: An executive body for analysis and decision-making on all those issues related to credit risks that are linked to the processes designed to obtain a balance between risk and profitability in accordance with the Group’s Risk Appetite Framework.
Technology and Methodologies Committee: Its aim is to determine the need for new models and infrastructures, and to guarantee decision-making related to the development and implementation of the tools required to manage all the risks to which the Group is exposed.
Corporate Technological Risks and Operational Control Committee: The aim is to approve the Technological Risk Management and Operational Control Frameworks, in accordance with the General Risk Model, and monitor the metrics, risk profiles and operational loss events.
Global Markets Risk Unit Committee: The aim is to formalize, supervise and communicate the monitoring of trading risk in all the Global Markets business units.
Corporate Operational Risk Admission and Outsourcing Committee: its purpose entails the identification, evaluation and analysis of the operational risks of new businesses, new products and services and outsourcing initiatives.
Each geographical and/or business area has its own risk management committee (or committees), with objectives and content similar to those of the corporate area, which develop their functions consistently and in line with the corporate policies and regulations on risks.
Under this organizational scheme, the risks function ensures the integration and application throughout the Group of the risk strategy, the regulatory framework, the infrastructures and standardized risk and controls. It also benefits from the knowledge and proximity to customers in each geographical and/or business area, and conveys the corporate risk culture to the Group’s different levels. Moreover, this organization enables the risks function to conduct and report to the corporate bodies integrated monitoring and control of the entire Group’s risks.
The Group has a specific Internal Risk Control unit. Its main function is to ensure there is a sufficient internal regulatory framework, a process and measures defined for each type of risk identified in the Group (and for those other types of risk for which the Group may be potentially affected). It controls their application and operation, as well as ensuring the integration of the risk strategy into the Group’s management.
The Internal Risk Control unit checks the functional operation of the units that develop the risk models, manage processes and execute controls. Its scope of action is global, from the geographical point of view and the type of risks.
The Group’s Internal Risk Control Director is responsible for the function; he reports its activities and informs the CRO and the Board’s Risks Committee of its work plans, as well as assisting the Board on such matters as it requires.
For this purpose, Internal Risk Control includes a Technical Secretary to provide the necessary technical support for the Committee to improve its performance.
The unit has a structure of teams at both corporate level and in the most relevant geographical areas in which the Group operates.
As in the case of the Corporate Area, local units are independent of the business areas that execute the processes, and of the units that execute the controls, and report functionally to the Internal Risk Control unit. This unit’s lines of action are established at Group level, and it is responsible for adapting and executing them locally, as well as for reporting the most relevant aspects.
In addition, the Group has an Internal Validation unit, which checks the functional development of the units that develop the risk models and of those that use them in management. Its functions include revision and independent validation at internal level of the models used for the control and management of risks in the Group.
The Group’s Risk Appetite Framework as approved by the Board of Directors determines the risks and their level that the Group is prepared to assume to achieve its business objectives, taking into account the organic business performance. These are expressed in terms of solvency, profitability, liquidity and funding, or other metrics, which are reviewed periodically or if there are any substantial changes in the entity’s business or relevant corporate operations. The determination of the Risk Appetite Framework has the following objectives:
Make explicit the Group’s risk strategy and the maximum levels of risk that the Group is prepared to assume, both at Group level and at geographical and/or business level.
Establish guidelines for action and a management framework for the medium-long term that prevents actions (both at Group and geographical and/or business level) that may compromise the Group’s future viability.
Establish a framework for relating with the geographical and/or business areas, that preserves their decision-making autonomy while ensuring their consistent performance and preventing divergent behavior.
Establish a common language across the whole organization and develop a risk culture geared toward compliance with it.
Alignment with the new regulatory requirements, making communication with regulators, investors and other stakeholders easier, thanks to an integrated and stable risk management framework.
The Risk Appetite Framework is expressed through the following elements:
Risk Appetite Statement: it includes the general principles of the Group’s risk strategy and the target risk profile. The Group’s Risk Appetite Statement is:
BBVA Group’s risk policy is designed to achieve a moderate risk profile for the Bank through: prudent management and a universal responsible banking business model aimed at generating value, return adjusted to principles and recurring earnings, diversified by geographical area, class of assets, portfolios and customers, with a presence in emerging and developed countries, keeping a medium/low risk profile in each country and supported by long-term relationships with customers.
Core metrics: based on the Risk Appetite Statement, statements are made that specify the general principles of risk management in terms of solvency, liquidity, funding, recurring revenue and profitability.
Moreover, the core metrics reflect, in quantitative terms, the principles and the target risk profile set out in the Risk Appetite statement and are aligned with the Group’s strategy. Each core metric has three thresholds (the traffic-light approach), ranging from usual management of the businesses to higher levels of impairment: Management reference, maximum appetite and maximum capacity. BBVA Group’s core metrics are those specified in the following chart:

Metrics by type of risk: based on the core metrics for each type of risk, statements are made that set out the general management principles for the risk and a number of metrics are calibrated, whose observance enables compliance with the core metrics and the Group’s statement. The metrics by type of risk define the strategic positioning by type of risk and have a maximum appetite level.
Basic limits structure (core limits): they shape the Risk Appetite Framework at geographical area, risk type, asset type and portfolio level, ensuring that management is within the metrics by type of risk.
In addition to this Framework, there is a level of management limits that is defined and managed by the risks area when developing the core limits, with the aim of ensuring that proactive management of risks by risk subcategory within each type or by subportfolio respects these core limits, and in general the established Risk Appetite Framework.
The basic scheme of BBVA’s Risk Appetite Framework is outlined in the following chart:

The corporate risks area works together with the various geographical and/or business areas to define their Risk Appetite Framework, so that it is coordinated with, and integrated into the Group’s Risk Appetite Framework, making sure that its profile is in line with the one defined.
The Risk Appetite Framework defined by BBVA expresses the levels and types of risk that the Bank is prepared to assume to carry out its strategic plan without significant deviations, even in situations of tension. The Risk Appetite Framework is integrated into management and determines the basic lines of the Group’s activity, as it establishes the framework within which the budgeting process is developed.
During 2016, Risk Appetite metrics trended consistently with the profile established according to the operating limits set or marked by the different areas in the organization.
The transfer of the Risk Appetite Framework to ordinary management is underpinned by three basic aspects:
The corporate GRM area is responsible for defining and developing corporate policies, specific regulations, procedures and schemes for delegation according to which the risk decisions have to be adopted within the Group.
This process aims for the following objectives:
The approval of corporate policies for all kinds of risks corresponds to the Bank’s corporate bodies, while the corporate risk area approves the rest of the regulations.
The risk units of the geographical and/or business areas comply with this body of regulations and, where necessary, adapt it to local requirements, in order to have a decision-making process that is appropriate to the local level and in line with the Group’s policies.
If such adaptation is necessary, the local risks area must inform the corporate GRM area, which has to ensure consistency in the body of regulations at Group level. Where appropriate, it must thus give its prior approval to the modifications proposed by the local risk areas.
Risk planning ensures integration in the Risk Appetite Framework through a cascade process of establishing limits and return adjusted to the target risk, where the function of the corporate area and of the geographical and/or business area risk units is to guarantee that this process is aligned with the Group’s Risk Appetite Framework in terms of solvency, profitability, liquidity and funding.
This process is equipped with tools for aligning and tracking the Risk Appetite Framework defined at the aggregated level by business areas, legal entities, risk types, concentrations and any other level considered necessary.
The process of risk planning is present within the rest of the Group’s planning framework to ensure the coherence of all the other processes.
All risks must be managed in an integrated fashion during their life cycle, based on differentiated treatment according to their type.
The risk management cycle is made up of 5 elements:
Evaluation, monitoring and reporting is a cross-cutting element that has to ensure that the Model has a dynamic and anticipatory vision, making possible compliance with the Risk Appetite Framework approved by the corporate bodies, even under unfavorable scenarios. This process is carried out with the following aims:
To carry out this process, which is integrated into the activity of the corporate and geographical and/or business risk units, the following phases must be developed:
Infrastructure constitutes the element that must ensure that the Group has the human and technological resources required for effective management and supervision of risks, performance of the functions included in the Group’s risk model, and achievement of its objectives.
With respect to human resources, the Group’s risk function has an adequate workforce in terms of number, skills, knowledge and experience.
With respect to technology, the Group ensures the integrity of the management information systems and the provision of the infrastructure required to support risk management, including the tools appropriate to the needs derived from the different types of risks in their admission, management, valuation and monitoring.
The principles according to which the Group’s risk technology is governed are:
Through the Risk Analytics function, the Group has a corporate framework that develops measurement techniques and models, covering all the types of risk and the different purposes, and involves a uniform language for all the activities and geographical/business areas.
The execution is decentralized, allowing the Group’s global scope to be used to the full. The idea is to develop the existing risk models continuously and generate others that cover the new range of businesses that are being deployed, with the aim of strengthening anticipation and proactiveness that characterize the risk function in the Group.
Equally, the risk units of the geographical and/or business areas must ensure they have sufficient means from the point of view of resources, structures and tools to develop risk management in accordance with the corporate model.
BBVA considers risk culture as an essential element for the consolidation and integration of the other components of the Model.
The culture transfers to all the levels of the organization the implications involved in the Group’s activities and businesses from the perspective of risk. The risk culture is based on a number of levers, including:
Communication: Promotes the spread of the Model, and particularly the principles that should govern risk management in the Group consistently and comprehensively across the organization, through the most appropriate channels.
GRM has a variety of channels for communication that facilitate the transfer of information and knowledge between the different teams in the function and the Group, adapting the frequency, formats and recipients according to the objective set, making it easier to establish the basic principles of the risk function. Thus the culture of risks and the prudent management model begin with the corporate bodies and the Group’s management and are transmitted across the whole organization.
Training: The main aim is to spread and consolidate the prudent risk management model across the organization, ensuring standards in skills and knowledge in those involved in the risk management processes.
A well-defined and implemented system of training ensures the continuous improvement of the skills and knowledge of the Group’s professionals, and in particular those in the GRM area. It is organized into four vectors that aim to develop each of the requirements of the GRM group by providing in-depth knowledge and skills in various subjects, such as: finance and risks, tools and technology, management and expertise, and languages.
Motivation: An area where the aim is for the incentives of the teams in the risk function to support the risk management strategy, values and culture of the function at all levels. It includes remuneration and all the other elements associated with motivation, such as the working environment, etc. that contribute to achieving the Model’s objectives.
Credit risk arises from the probability that one party to a financial instrument will fail to meet its contractual obligations for reasons of insolvency or inability to pay and cause a financial loss for the other party.
It is the most important risk for the Group and includes counterparty credit risk, issuer risk, settlement risk and country risk management.
For managing risks and capital, BBVA quantifies its credit risk using two main metrics: expected loss (“EL”) and economic capital (“EC”). The expected loss reflects the average value of losses and is considered a business cost; economic capital is the amount of capital necessary to cover unexpected losses that arise if actual losses are higher than expected losses, which could even endanger the continuity of the entity’s activity.
These risk metrics are combined with information on profitability in value-based management, thus building the profitability-risk binomial into decision-making, from the definition of business strategy to approval of individual loans, price setting, assessment of non-performing portfolios, incentives to areas in the Group, etc.
There are three essential parameters in the process of calculating the EL and EC measurements: the probability of default (“PD”), loss given default (“LGD”) and exposure at default (“EAD”), mainly based on the estimate of credit conversion factors (“CCF”). They are generally estimated using the available historical information and are assigned to operations and customers according to their particular characteristics.
In this context, the credit rating tools (ratings and scorings) assess the risk in each customer/transaction according to their credit quality by assigning them a score, which is used to assign risk metrics together with other additional information: transaction seasoning, loan to value ratio, customer segment, etc.
Section 3.2.5.1 of this document details the definitions, methods and data used by the Group to determine the capital requirements for estimating and validating the parameters of probability of default (PD), loss given default (LGD) and exposure at default (EAD).
The credit risk for BBVA Group’s global portfolio is measured through a Portfolio Model that includes the effects of concentration and diversification. The aim is to study the loan portfolio as a whole, and to analyze and capture the effect of the interrelations between the different portfolios.
In addition to enabling a more comprehensive calculation of economic capital needs, this model is a key tool for credit risk management, as it establishes loan limits based on the contribution of each unit to the total risk in a global, diversified setting.
The Portfolio Model considers that risk comes from various sources (it is a multi-factor model). This feature implies that economic capital is sensitive to geographic diversification, a crucial aspect in a global entity like BBVA.
These effects have been made more apparent against the current backdrop in which, despite the stress undergone by some economies, BBVA Group’s presence in different geographical areas, subject to different shocks and different moments in the cycle, have contributed to bolster the bank’s solvency. In addition, the tool is sensitive to concentration in certain credit exposures of the entity’s large clients.
Lastly, the results of the Portfolio Model are integrated into management within the framework of the Asset Allocation project, where business concentrations are analyzed in order to establish the entity’s risk appetite profile.
A financial asset is considered impaired for accounting purposes when there is objective evidence that events have occurred which have a negative impact on the future cash flows that were estimated at the time the transaction was arranged.
Objective evidence of impairment of a financial asset or group of financial assets includes observable data about the following aspects:
Significant financial difficulties on the part of the obligor.
Continued delays in payment of interest or principal.
Refinancing or restructuring of debt caused by the financial difficulties of the counterparty.
Bankruptcy and other types of reorganization/winding-up are considered likely.
Disappearance of a financial asset from an active market due to financial difficulties.
Observable data that indicate a reduction in future flows from initial recognition such as adverse changes in the status of counterparty payments (payment delays, drawing credit on cards up to the limit, etc.).
Domestic or local economic conditions are correlated with default in financial assets (increase in the unemployment rate, fall in property prices, etc.).
The classification of financial assets impaired for reasons of customer default is done in an objective way and on an individual basis according to the following criterion:
The total amount of debt instruments, irrespective of the holder and the guarantee involved, with an amount past due for more than ninety days for principal, interest or contractually agreed expenses, unless they should be classified directly as write-offs.
Contingent liabilities in which the guaranteed party has incurred default.
Debt instruments classified as impaired through the accumulation of balances in default for an amount exceeding 20% of the overall amounts pending collection will also be included.
Financial assets impaired for reasons other than customer default, which are those for which there is a reasonable doubt about their total reimbursement under the terms and conditions agreed by contract, are classified individually for all risks whose individual amount is significant.
Write-off risks are those debt instruments whose recovery is deemed remote and should be classified as final write-offs.
The impairment on financial assets is calculated by type of instrument and other circumstances that may affect them, taking into account the guarantees received by the holders of the instruments to assure (fully or partially) the performance of the transactions. BBVA Group recognizes impairment charges directly against the impaired asset when the likelihood of recovery is deemed remote, and uses an offsetting or allowance account when it records provisions made to cover estimated losses on their full value.
The amount of the deterioration of debt instruments valued at their amortized cost is determined differently according to whether the impairment losses are calculated individually or collectively. First, it is determined whether there is objective evidence of individual impairment of individually significant assets, and as a group for financial assets that are not individually significant. If there is no objective evidence of deterioration in a financial asset evaluated individually, the asset will be included in a group of financial assets with similar credit risk characteristics and its deterioration will be evaluated as a group.
The amount of impairment losses recorded by these instruments coincides with the positive difference between their respective book values and the present values of future cash flows. These cash flows are discounted at the instrument’s original effective interest rate. If a financial instrument has a variable interest rate, the discount rate for measuring any impairment loss is the current effective rate determined under the contract.
As an exception to the rule described above, the market value of quoted debt instruments is deemed to be a fair estimate of the present value of their future cash flows.
The estimation of future cash flows for debt instruments considers the following:
All sums expected to be recovered during the remaining life of the instrument, including those that may arise from collateral and credit enhancements, if any (once deduction has been made of the costs required for their foreclosure and subsequent sale). Impairment losses include an estimate of the possibility of collecting of the accrued, past-due and uncollected interest.
The various types of risk to which each instrument is subject.
The circumstances under which the collections will foreseeably take place
For group analysis of impairment, the financial assets are grouped by similar risk characteristics indicating the debtor’s ability to make its payments under the contractual terms. Based on this analysis the impairment of loans not individually significant are estimated, distinguishing between those that present objective evidence of impairment from those that do not present objective evidence of impairment, as well as the impairment of significant loans for which the Group has determined that there is no objective evidence of impairment.
With respect to financial assets that do not show any objective evidence of impairment, the Group applies statistical procedures using its historical experience and other specific information to estimate incurred losses incurred by the Group resulting from events that have occurred as of the date of preparation of the consolidated financial statements, but that are not known and are only identified individually after the presentation of the statements. This calculation is a temporary step until the losses are identified specifically at individual level, when these financial instruments will be separated from the group of financial assets without objective evidence of impairment.
Quantification of losses incurred takes into account three basic factors: exposure at default, probability of default and loss given default.
Exposure at default (EAD) is the amount of risk exposure at the date of default by the counterparty.
Probability of default (PD)1 is the probability of the counterparty failing to meet its principal and/or interest payment obligations. This probability reflects the current conditions of the portfolio at each date of preparation of the financial statements and is estimated taking into account the main characteristics of the credit quality of the counterparty/transaction.
Loss given default (LGD3 is the estimate of the loss arising in the event of default. It depends mainly on the characteristics of the transaction and the valuation of the related guarantees or collateral.
The calculation of LGD at each date of the balance sheet estimates the current value of the cash flows expected to be obtained during the remaining life of the financial asset. The recoverable amount of effective collateral will be estimated based on the valuation of the property, discounting the adjustments needed to capture adequately the uncertainty the potential fall in value up to the time of foreclosure and sale, plus foreclosure costs, maintenance costs and sale costs.
1 The PD and LGD is calculated from a Point-in-time (“PIT”) focus for solvency purposes
Non-performing contingent exposures and commitments, except for letters of credit and other guarantees, are to be provisioned for an amount equal to the estimation of the sums expected to be disbursed that are deemed to be non-recoverable, applying criteria of valuation prudence. When calculating the provisions, criteria similar to those established for non-performing assets for reasons other than customer default are applied.
In any event, letters of credit and other guarantees provided which are classified as non-performing will be covered by applying similar criteria to those set out in the preceding section on value adjustments for impairment of assets.
Likewise, the inherent loss associated with letters of credit and other guarantees provided that are in force and not impaired is covered by applying similar criteria to those set out in the preceding section on impairment losses determined collectively.
As set out in the Group’s Annual Consolidated Financial Statements (Note 7.3.6), a restructured transaction is understood to be one that for economic or legal reasons related to the holder’s (or holders’) current or foreseeable financial difficulties, the financial conditions are modified to facilitate payment of the debt (principal and interest) because the holder cannot, or is considered will not be able to, comply with these conditions on time and in full, even when such modification is included in the contract.
In any event, restructured transactions are considered to be those where a haircut is applied or assets are received to reduce the debt, or whose conditions are modified to extend its maturity, change the repayment schedule to reduce the amount of payments in the short term or their frequency, or establish or extend the initial grace period of the principal, interest or both; except where it can be provide that the conditions are modified for reasons other than the financial difficulties of the holder and are similar to those applied in the market at the time of modification to transactions granted to customers with a similar risk profile.
Pursuant to article 5 of the CRR, with respect to the bank capital requirements for credit risk, exposure is understood to be any asset item and all items included in the Group’s memorandum accounts involving credit risk and not deducted from the Group’s bank capital. Accordingly, mainly customer lending items are included, with their corresponding undrawn balances, letters of credit and guarantees, debt securities and capital instruments, cash and deposits in central banks and credit institutions, assets purchased or sold under a repurchase agreement (asset and liability repos), financial derivatives (nominal) and fixed assets.
The credit risk exposure specified in the following sections of this document is broken down into the standardized credit risk approach (section 3.2.4), advanced credit risk approach (section 3.2.5) and counterparty credit risk (section 3.2.6) and securitization credit risk (section 3.2.7).
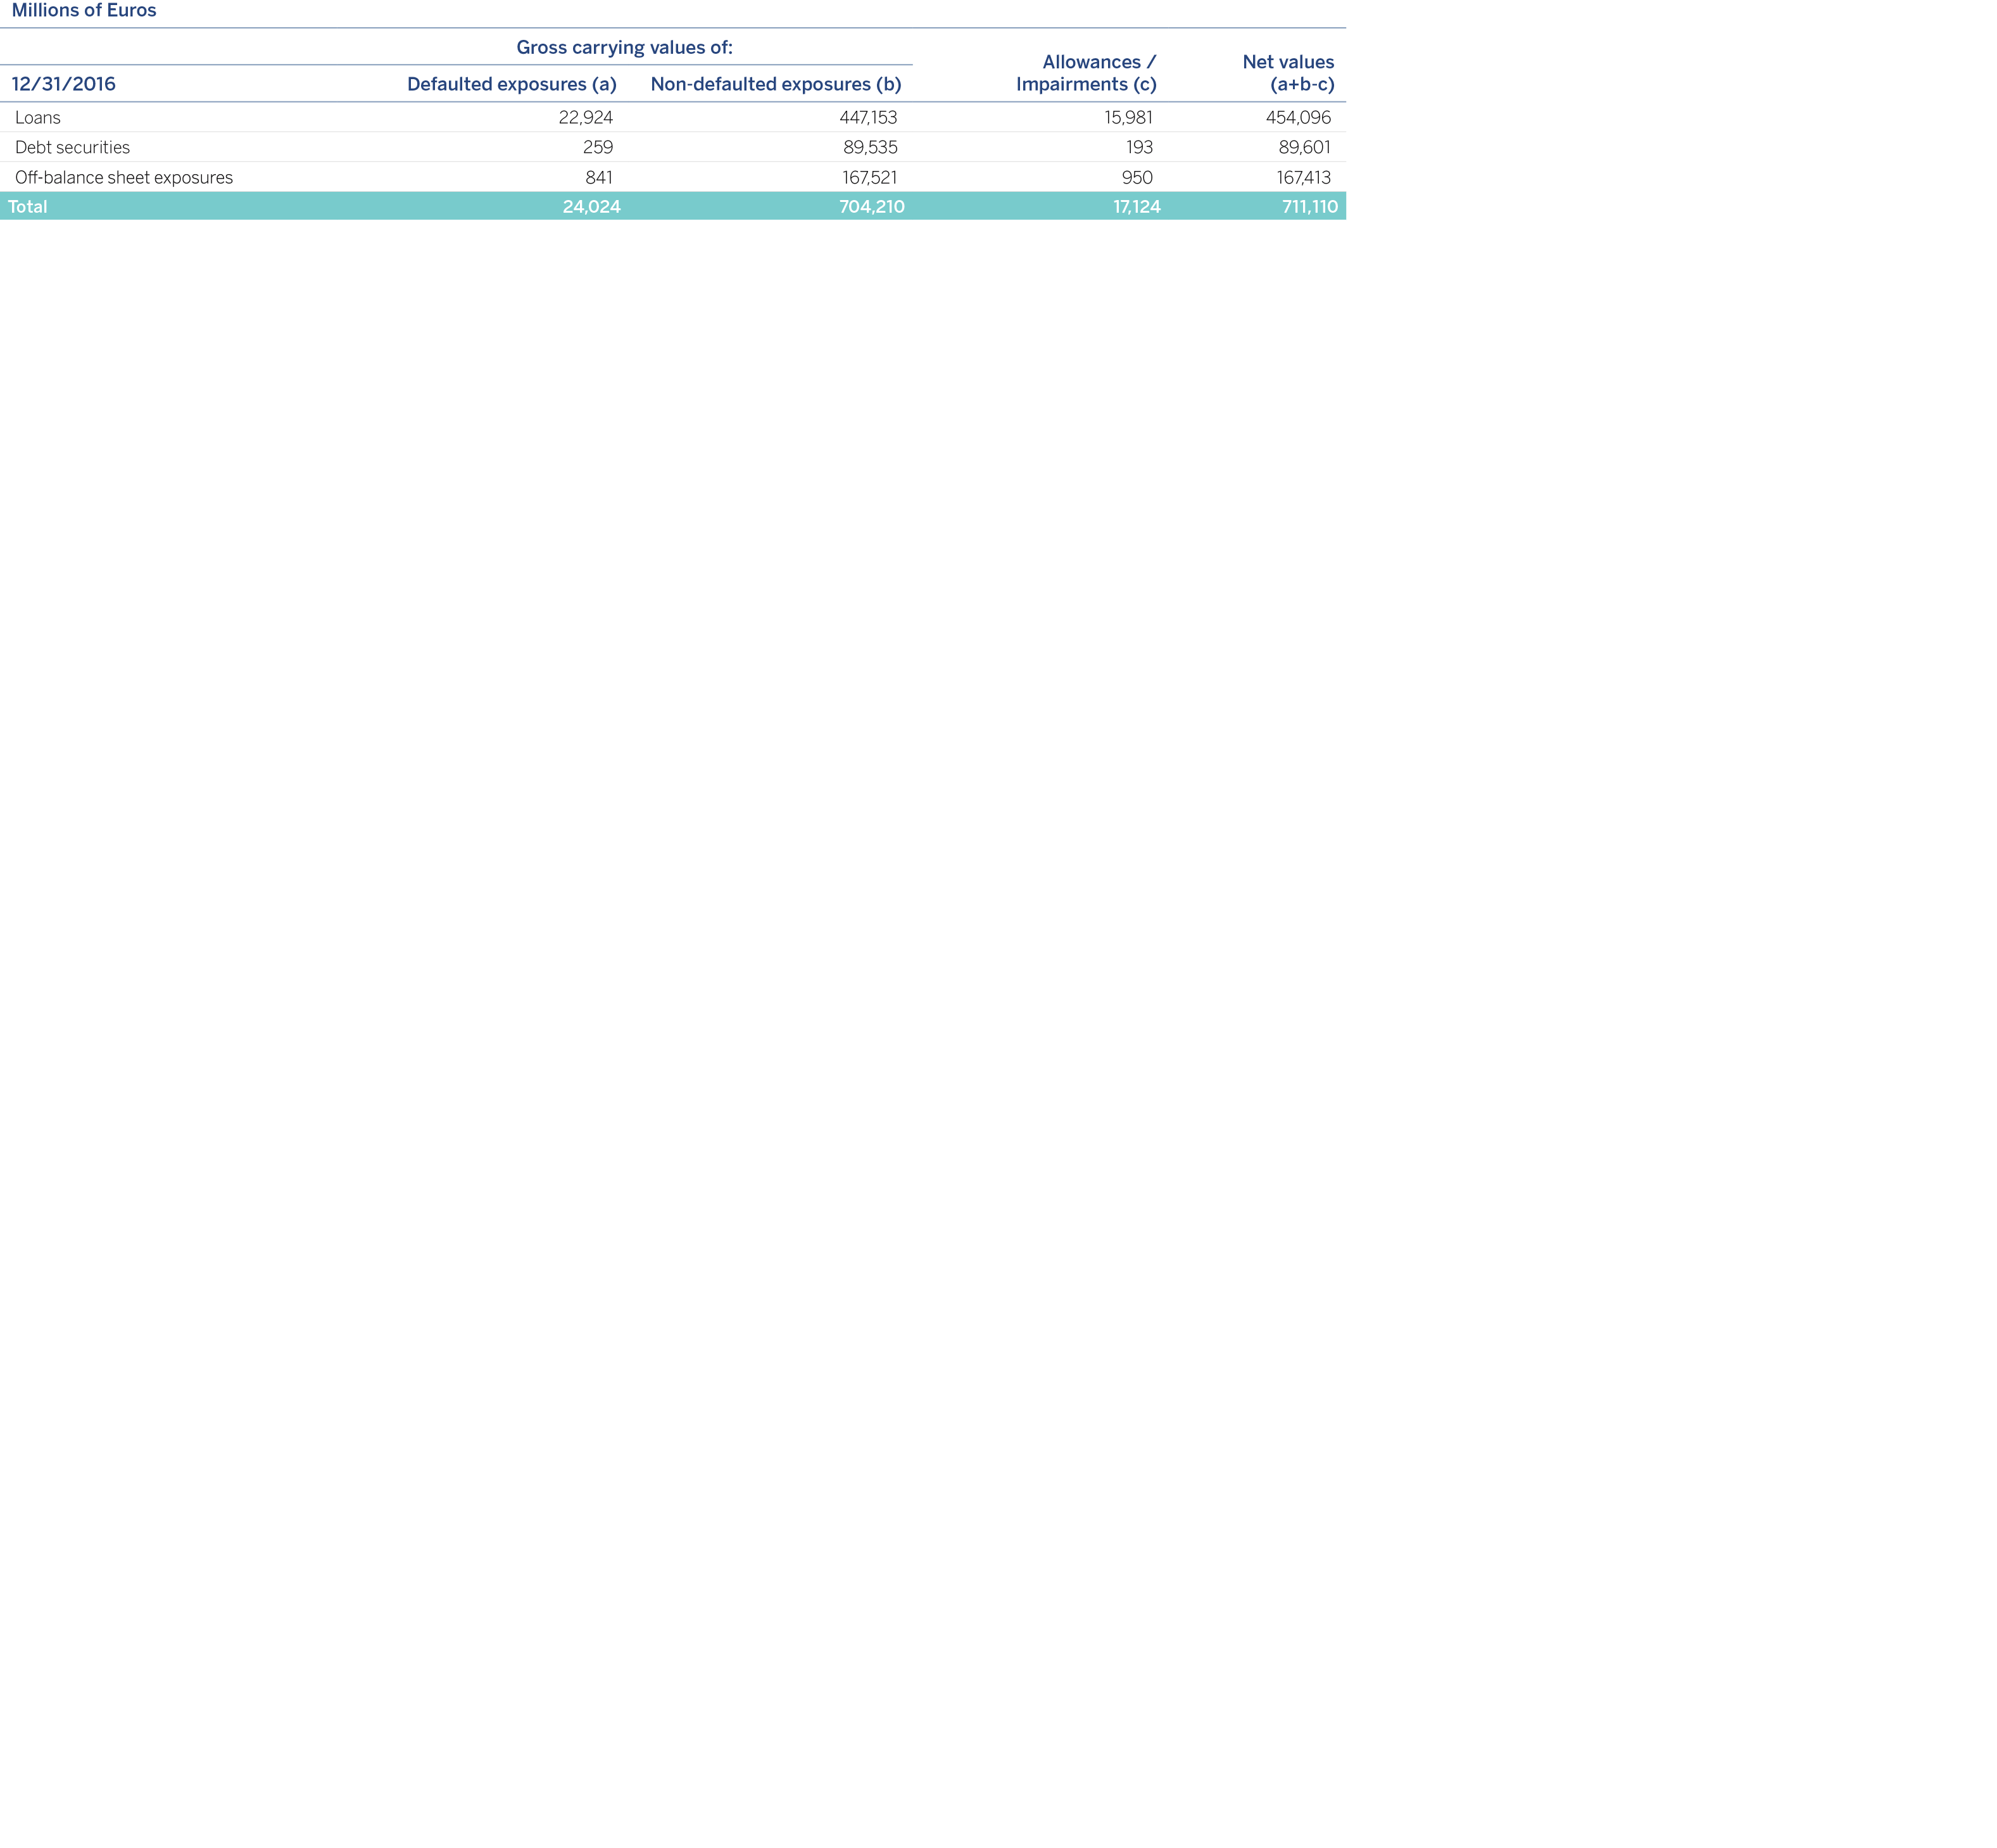
The book value of loans, debt securities and off-balance sheet exposures, broken down into defaulted and non-defaulted exposures, as well as the provisions and value adjustments linked to the defaulted exposures, are shown below. This breakdown provides a comprehensive picture of the credit quality of the Group’s on and off balance sheet assets as of December 31, 2016:
The table below shows the average value of exposure to credit risk (including counterparty credit risk) in 2016 and 2015, for both the advanced measurement and standardized approaches by exposure categories:

The following chart presents the distribution by geographic areas of the original exposure gross of provisions by obligor’s country. The distribution includes exposure under the standardized and advanced measurement approaches, as well as counterparty credit risk, but not including equity exposures.
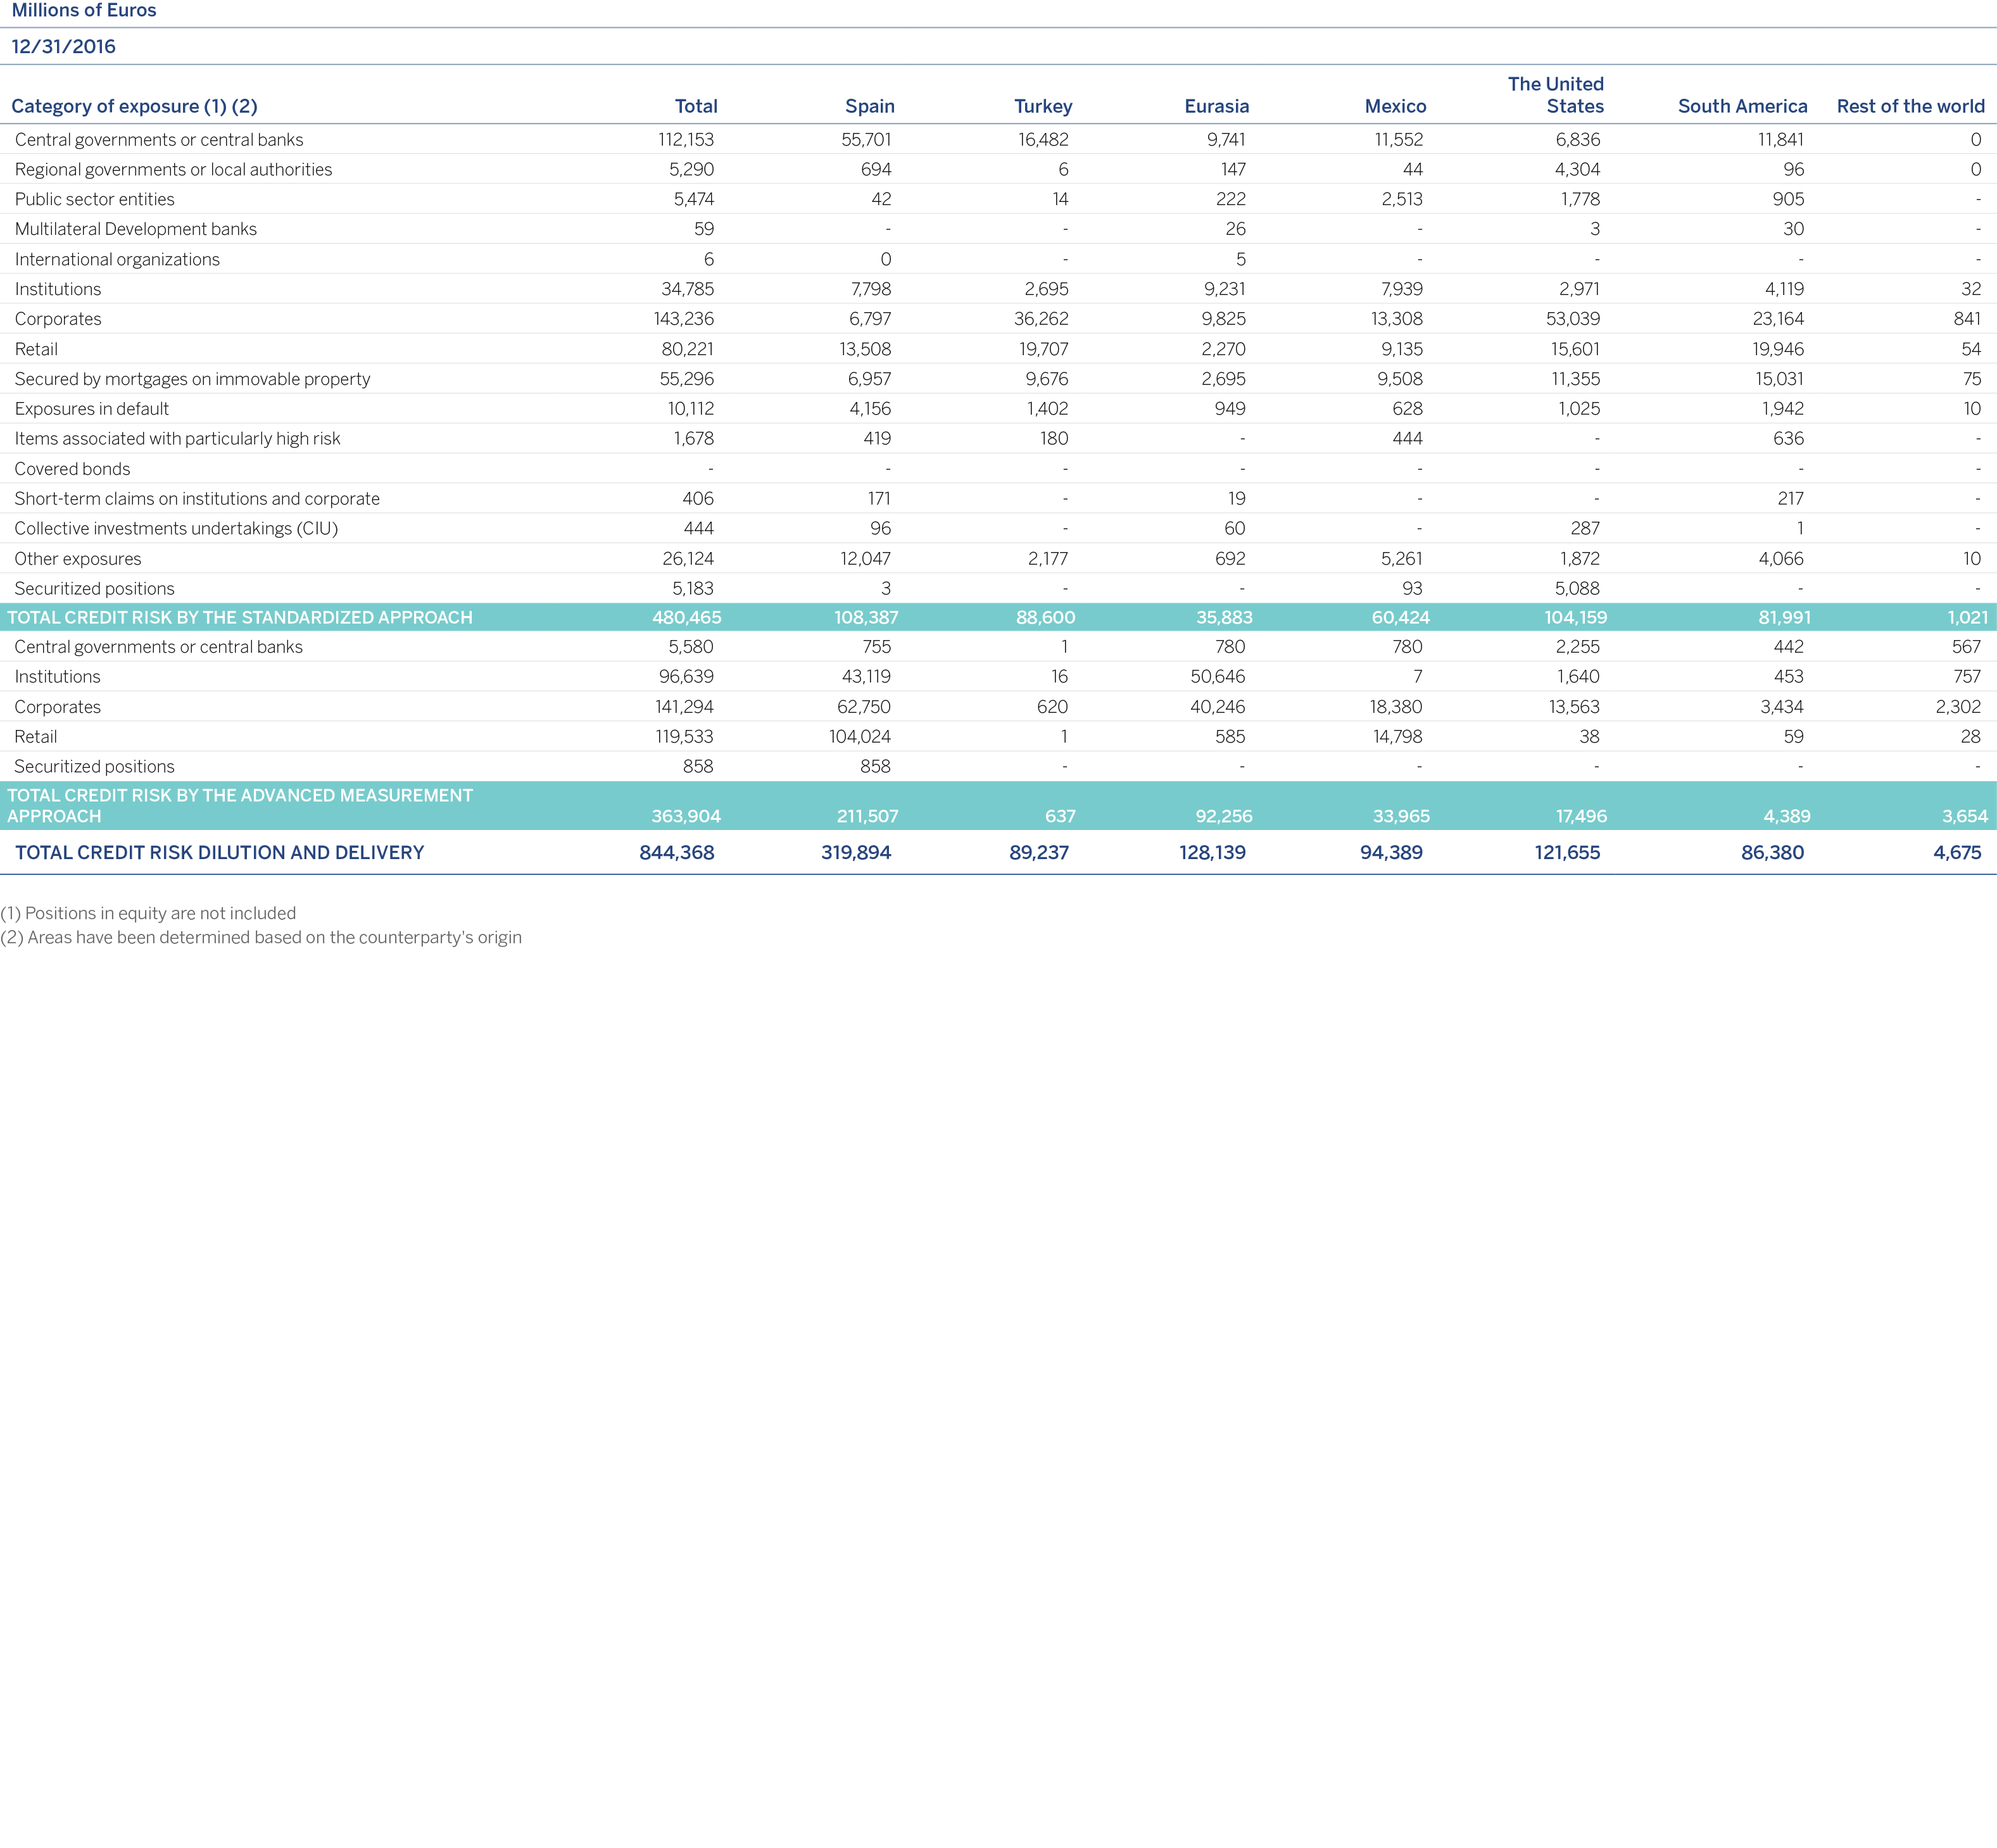
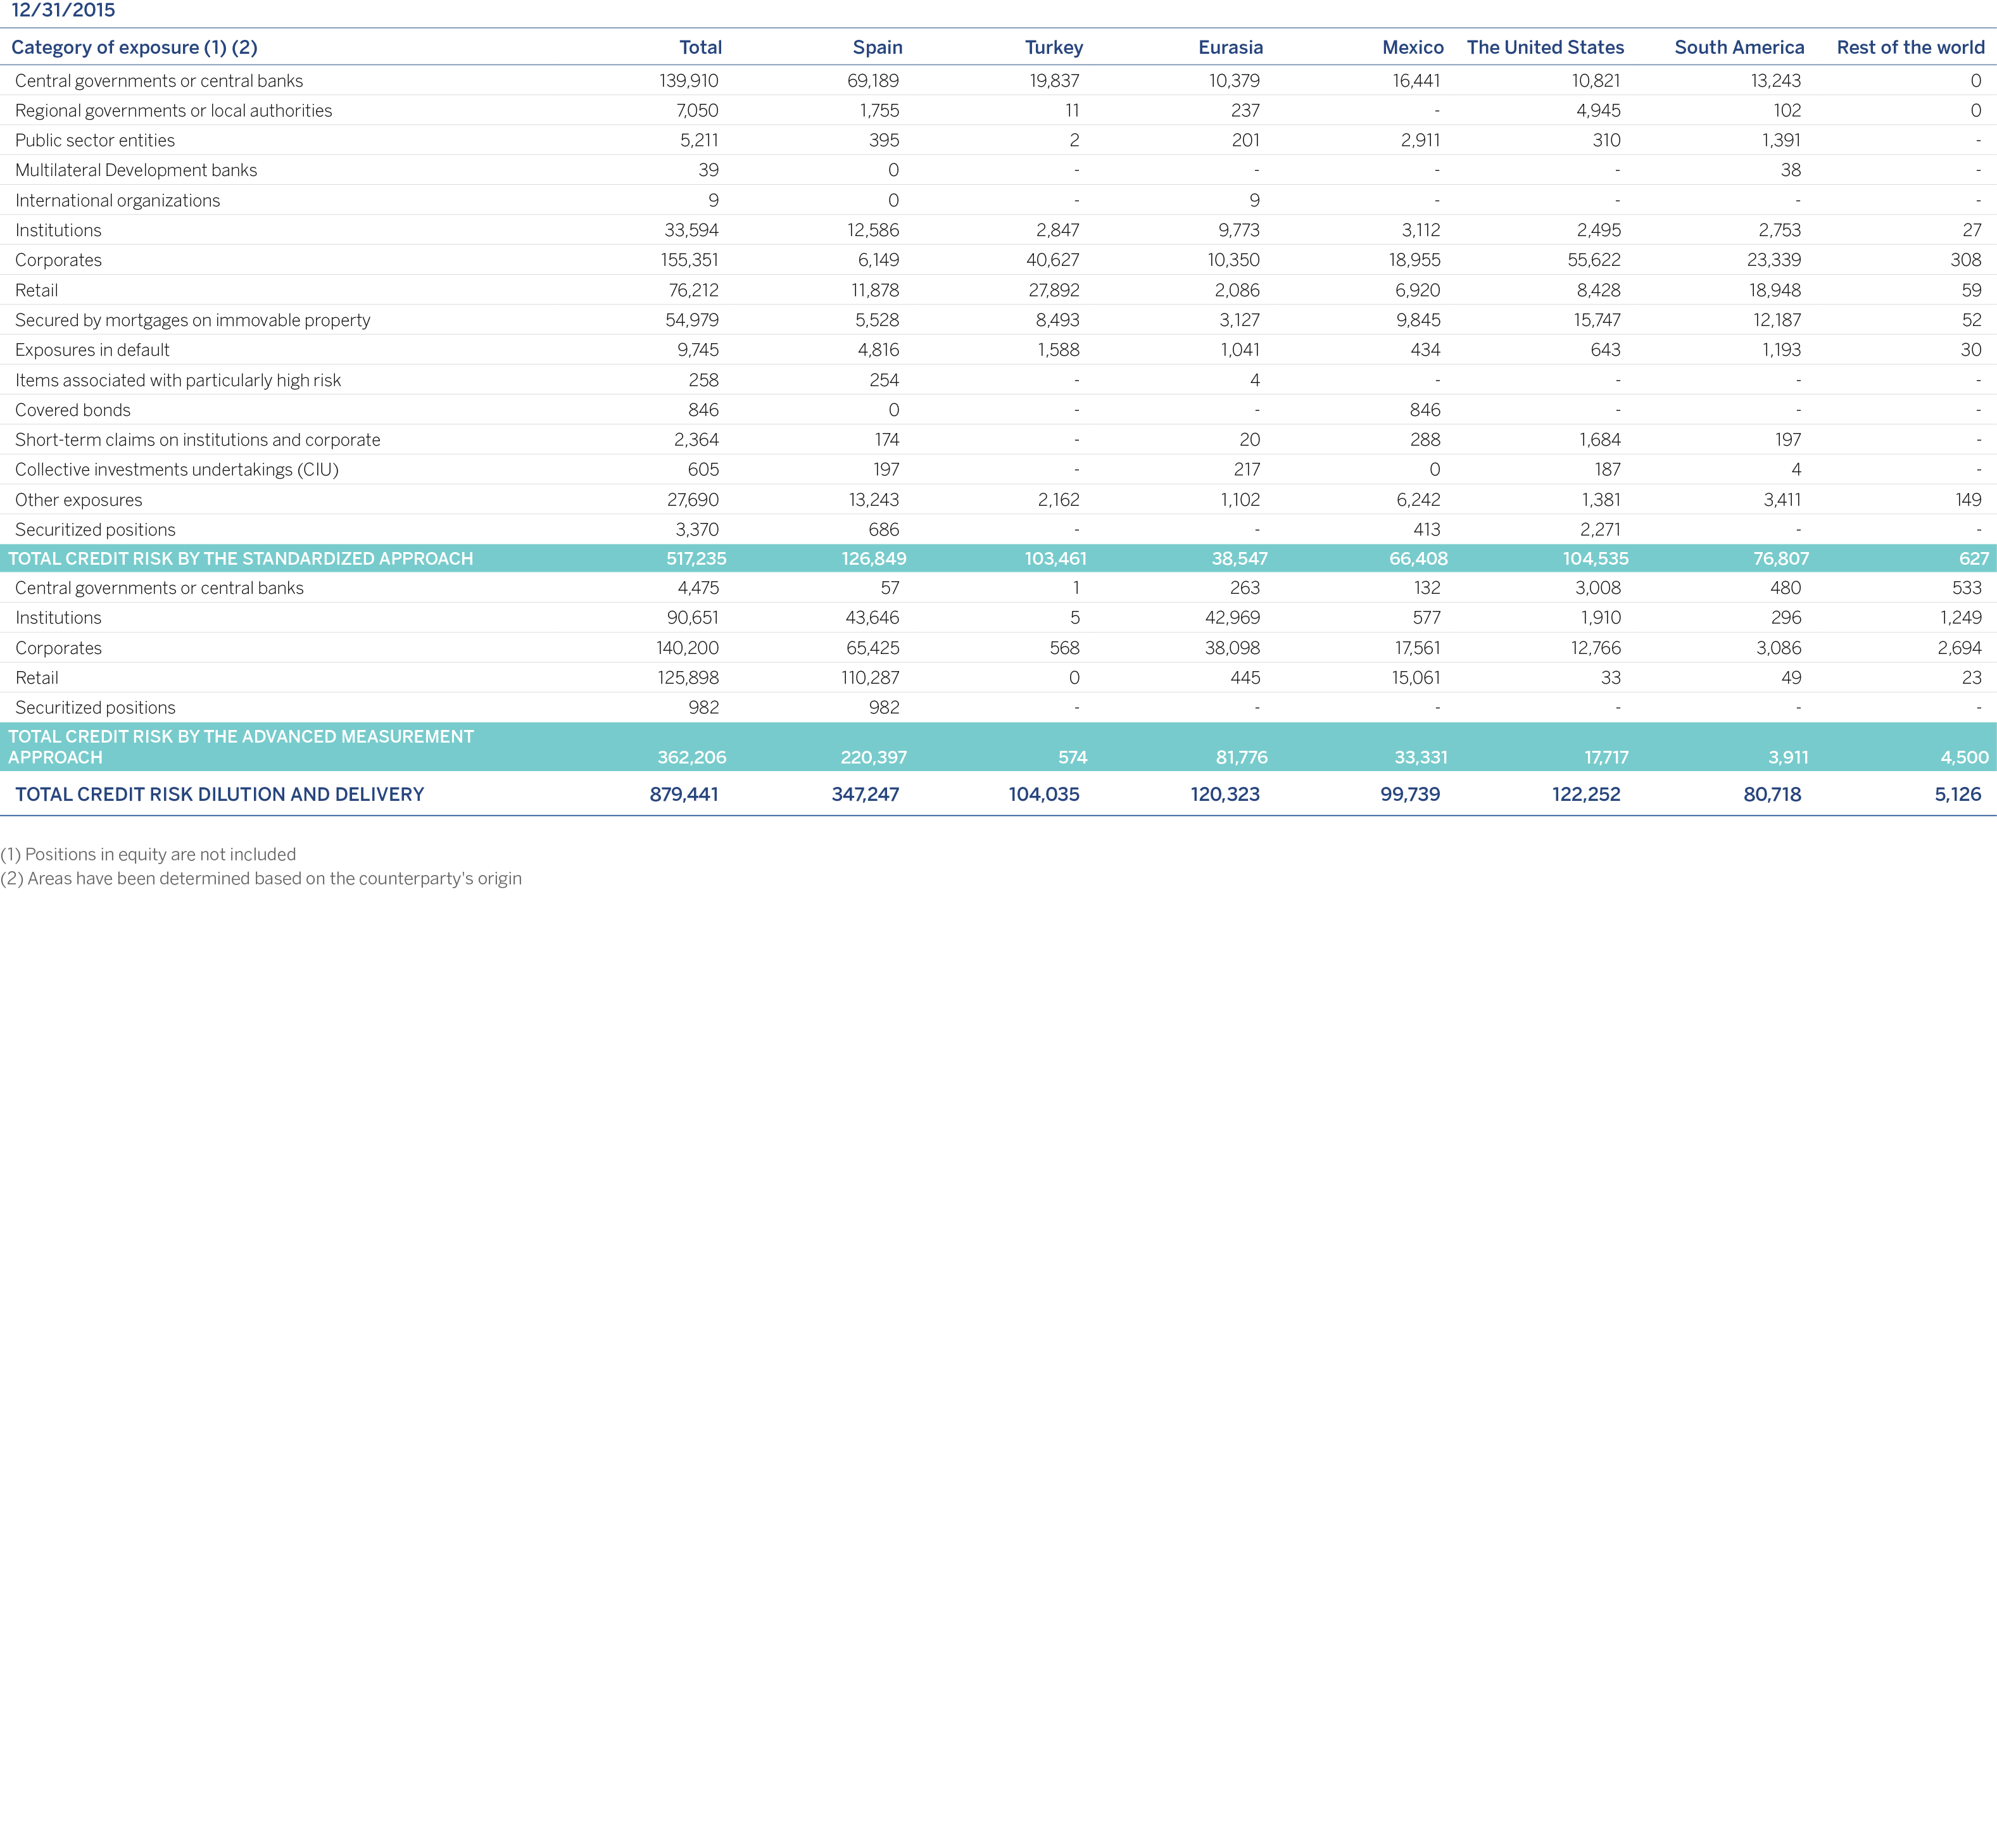
It also shows graphically the distribution of original exposure by geographical area, revealing the Group’s high level of geographical diversification, which constitutes one of the key levers for its strategic growth.

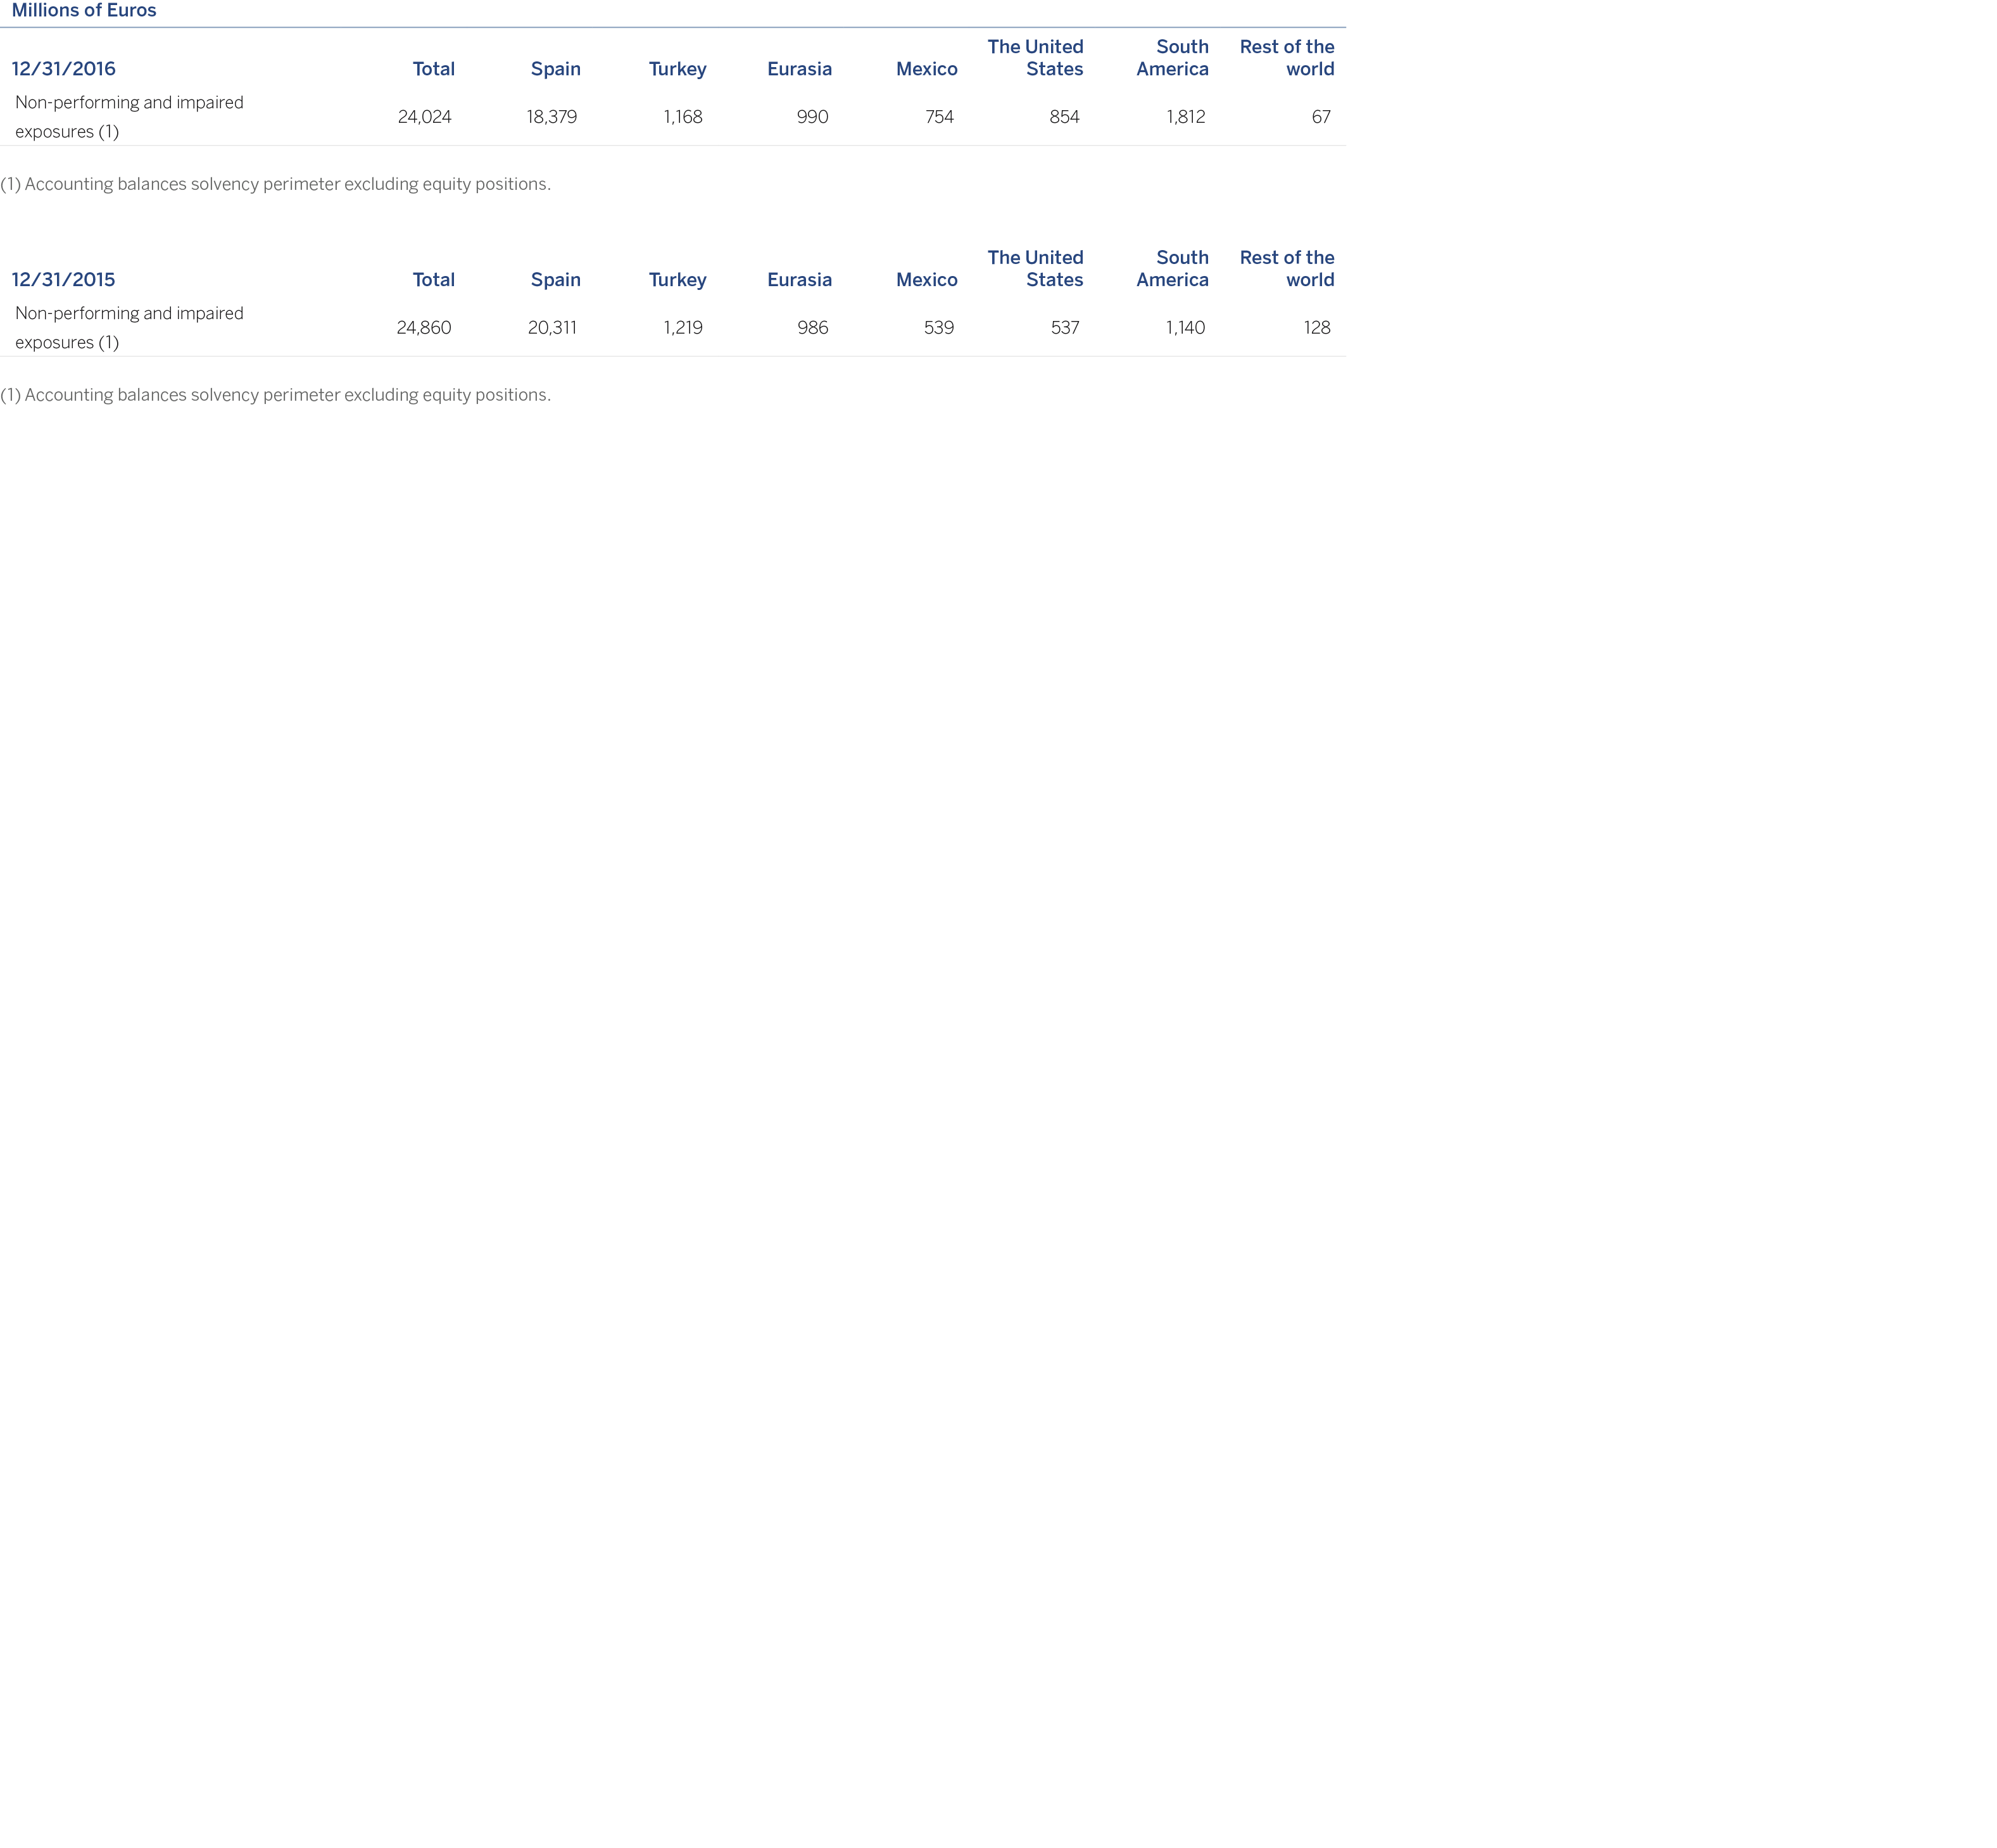
Below is the distribution by geographical area of the accounting balances of defaulted and impaired exposure of the financial assets and contingent risks, taking into account that the impaired and defaulted exposures referred to have been determined based on the accounting definition but with a prudential perimeter:
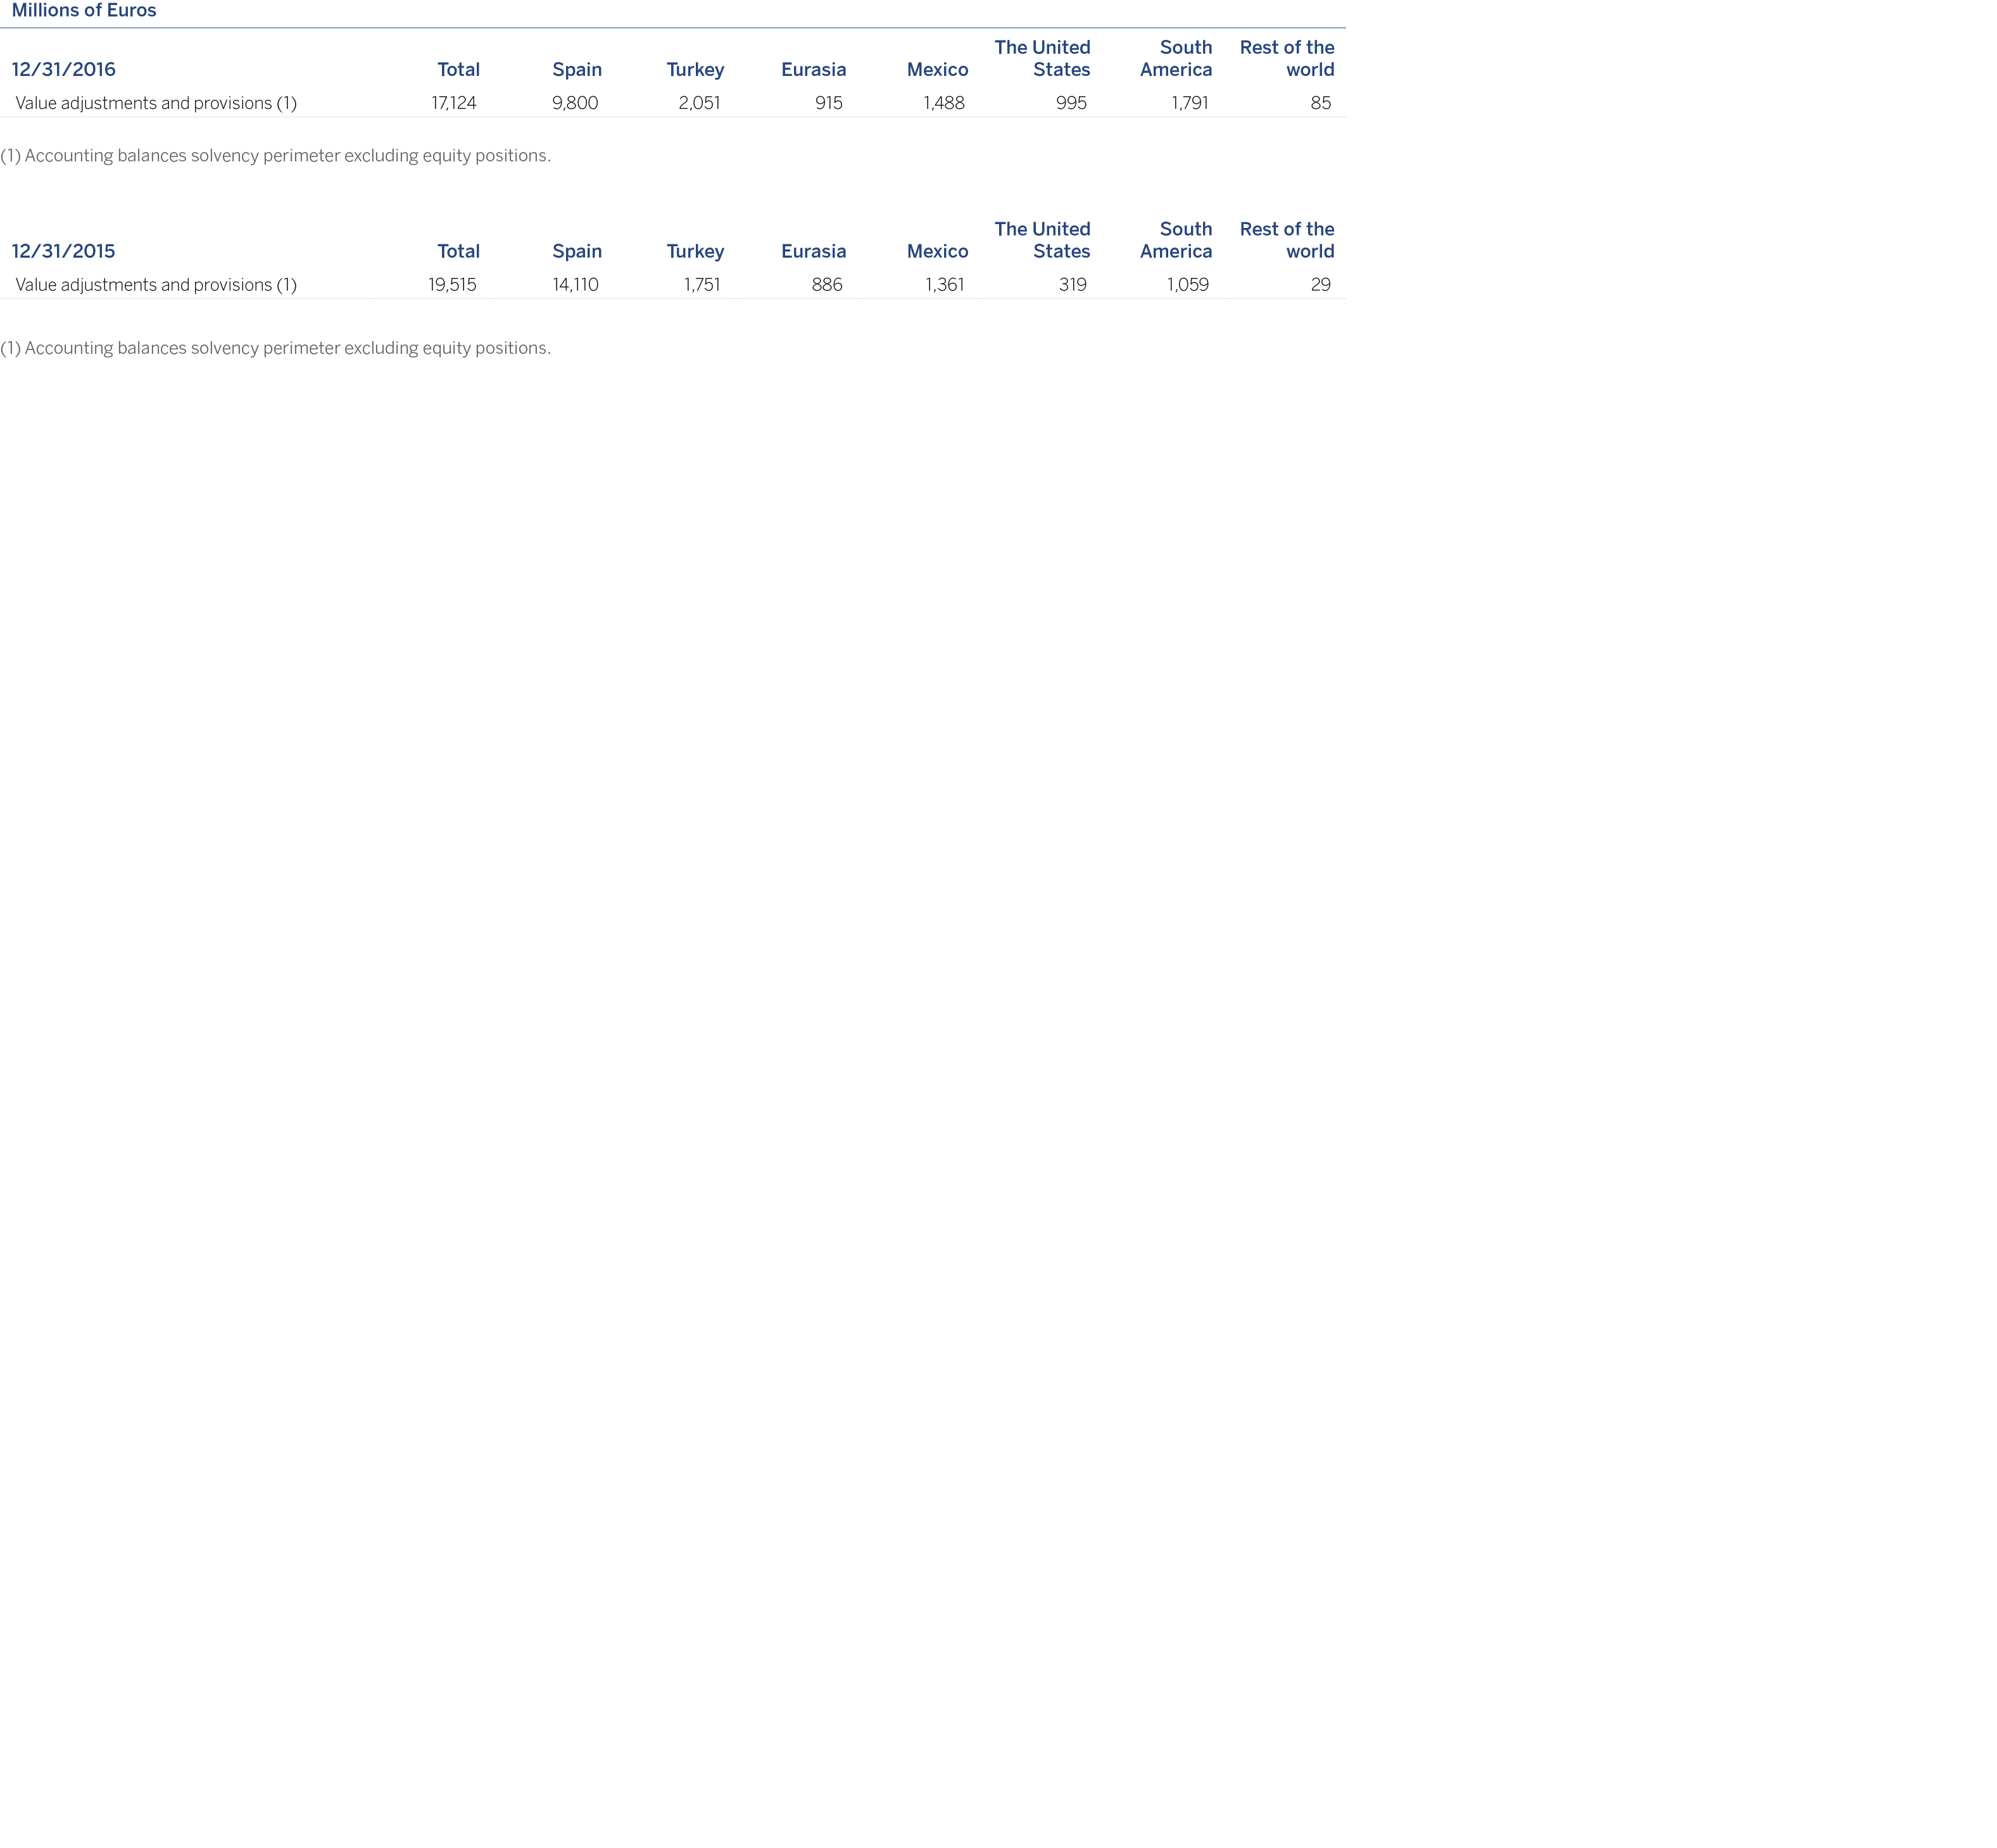
The next table shows the distribution by geographical area of the account balances of the allowances for financial asset losses and for contingent liabilities.
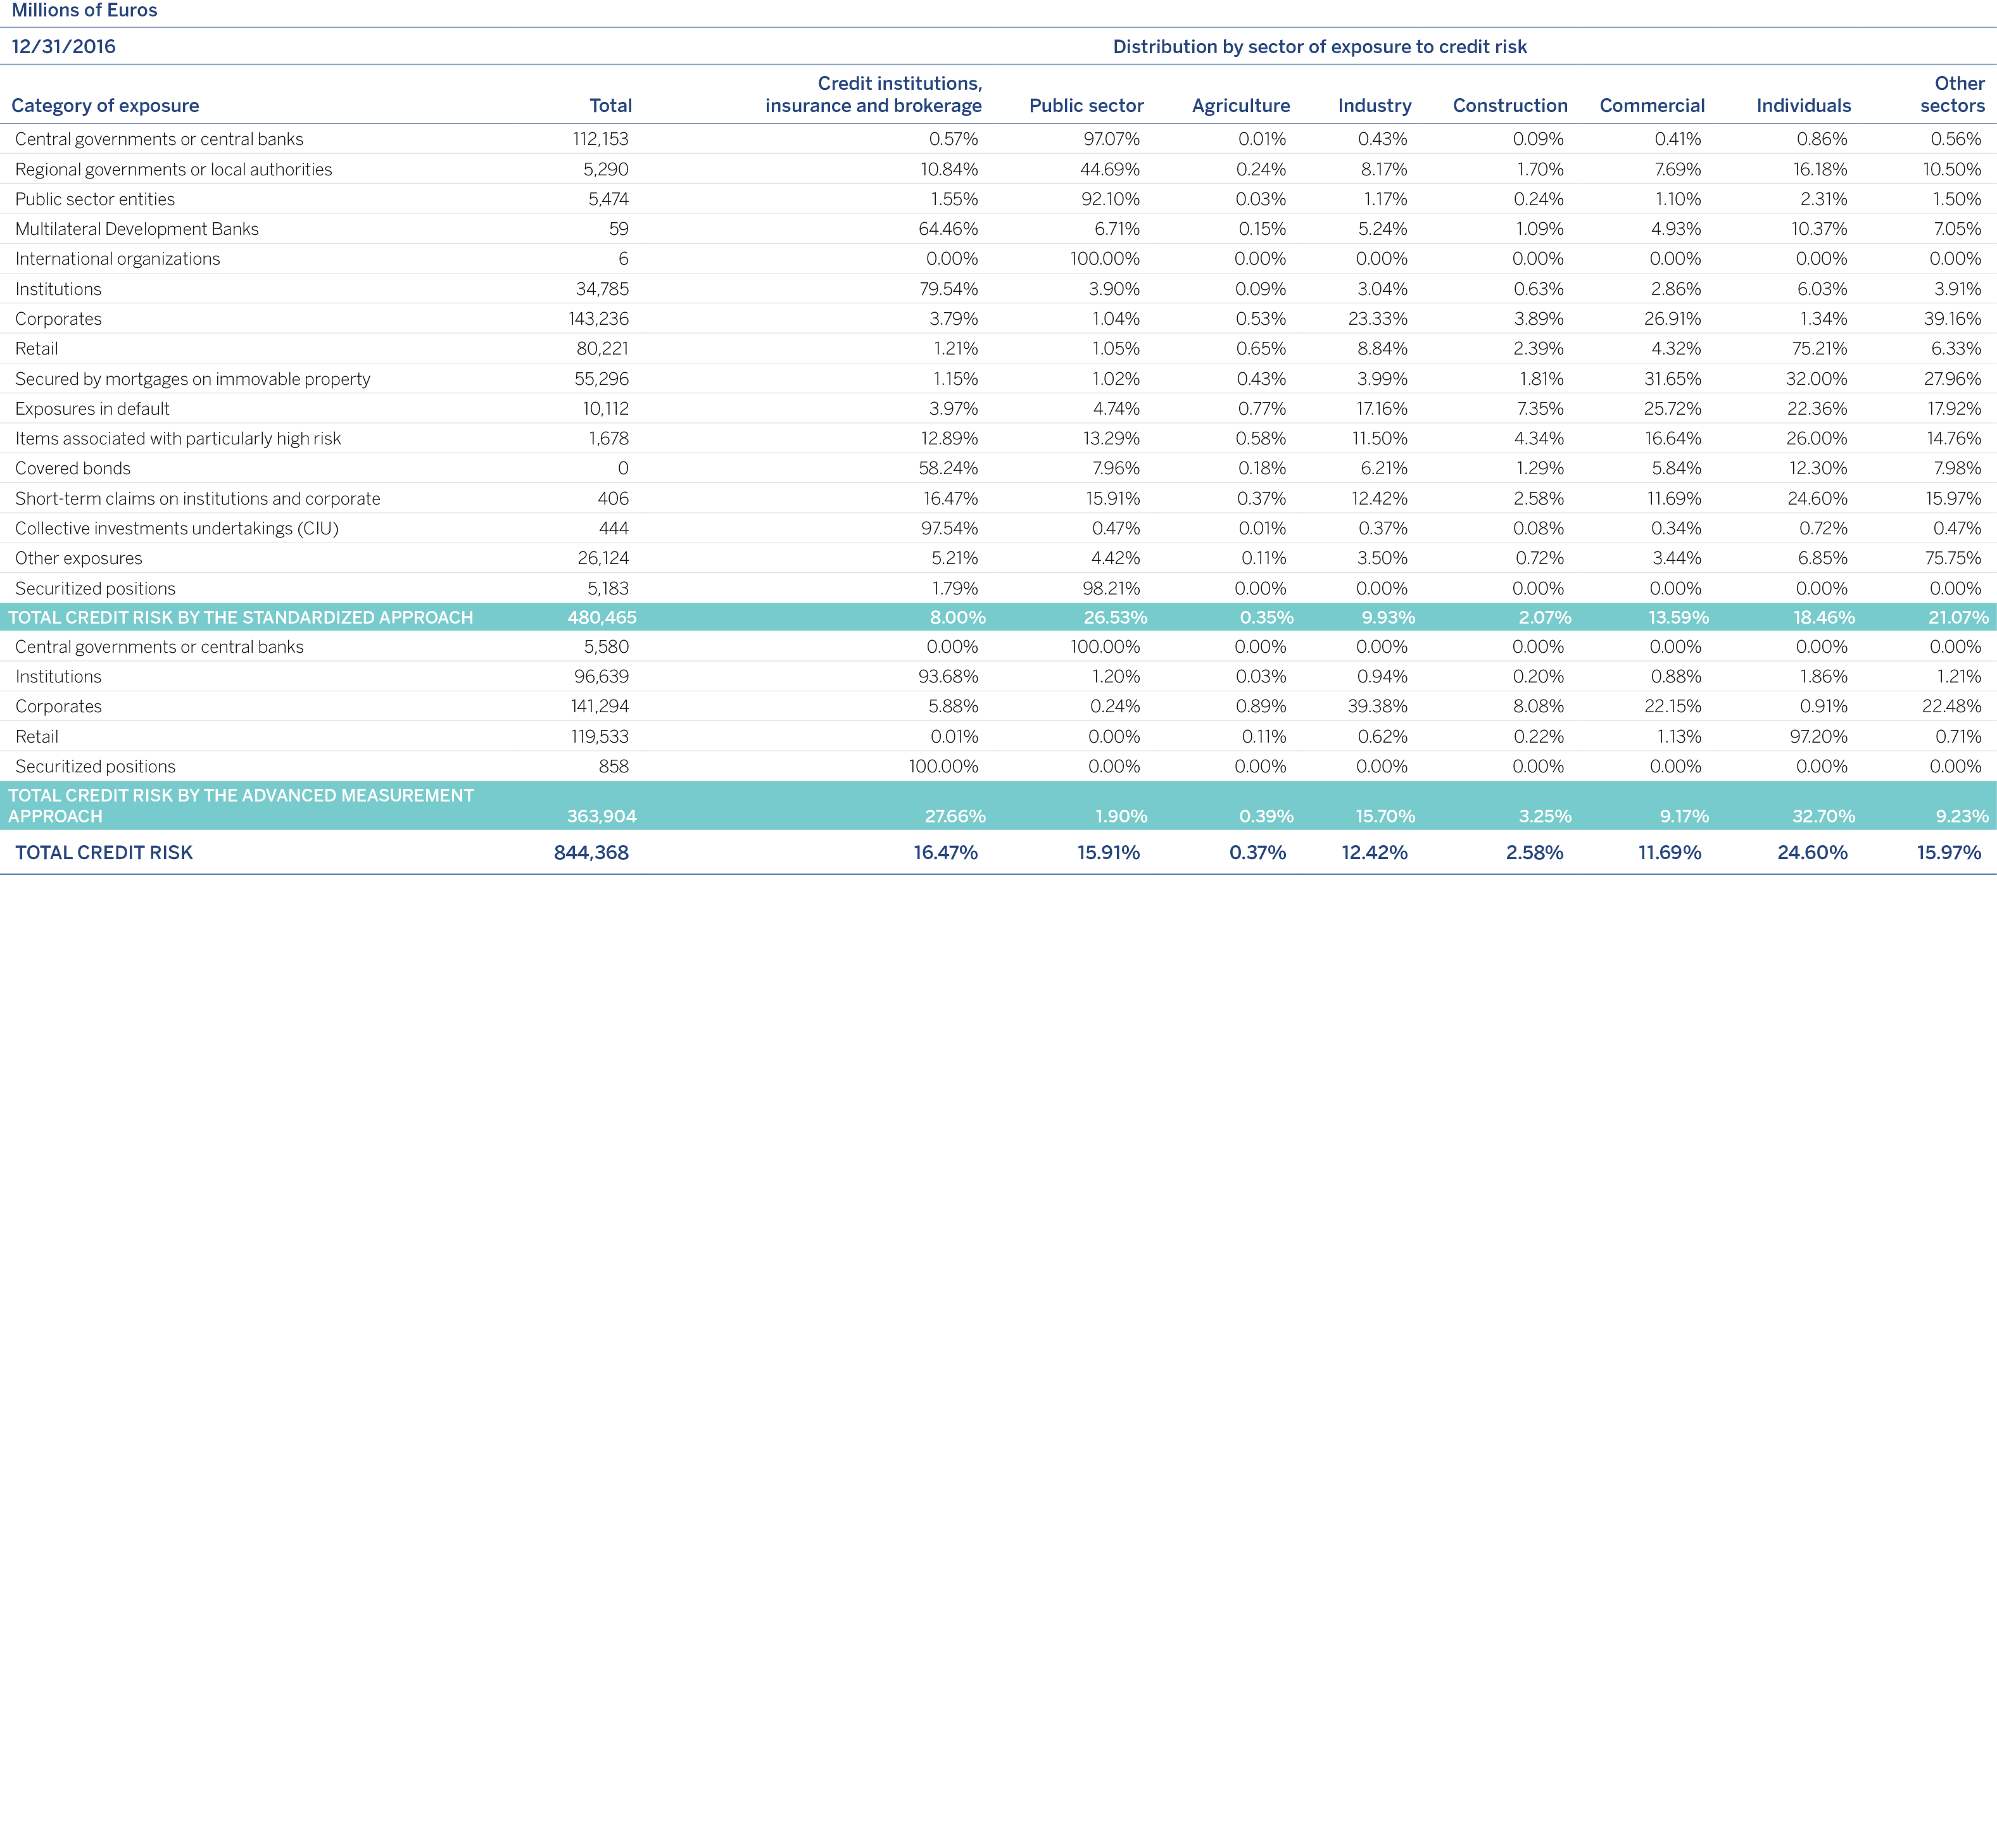
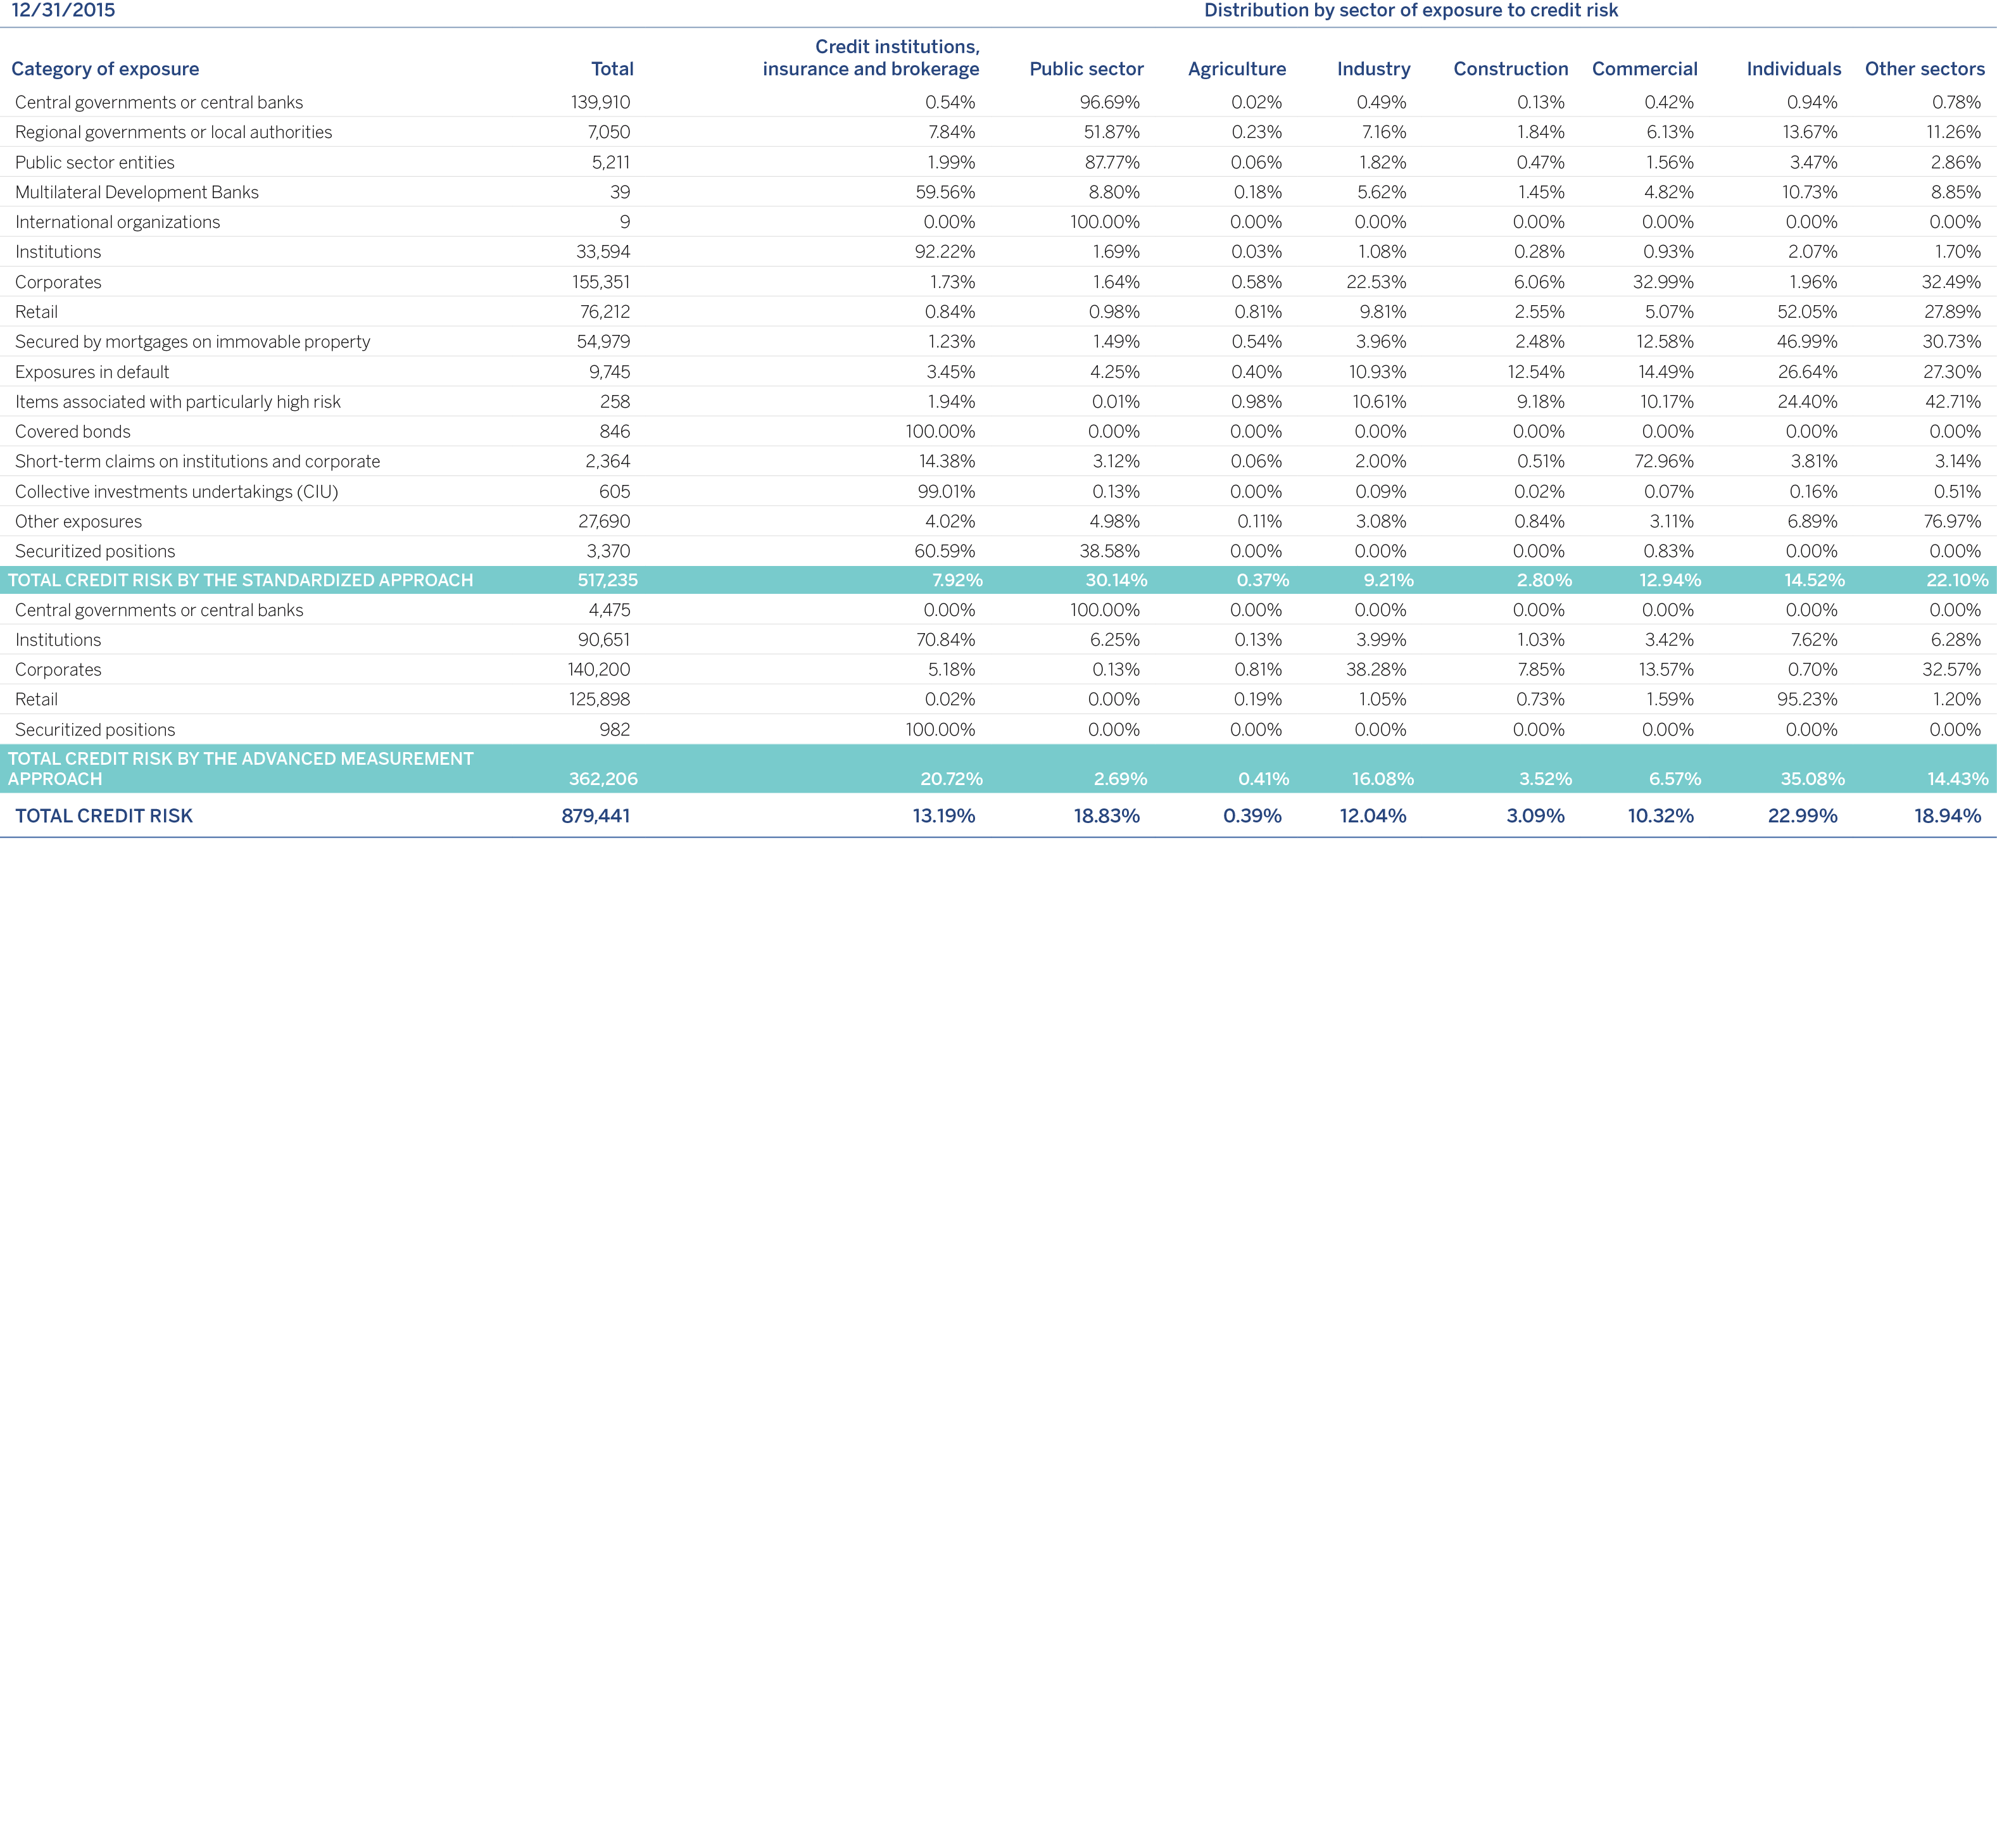
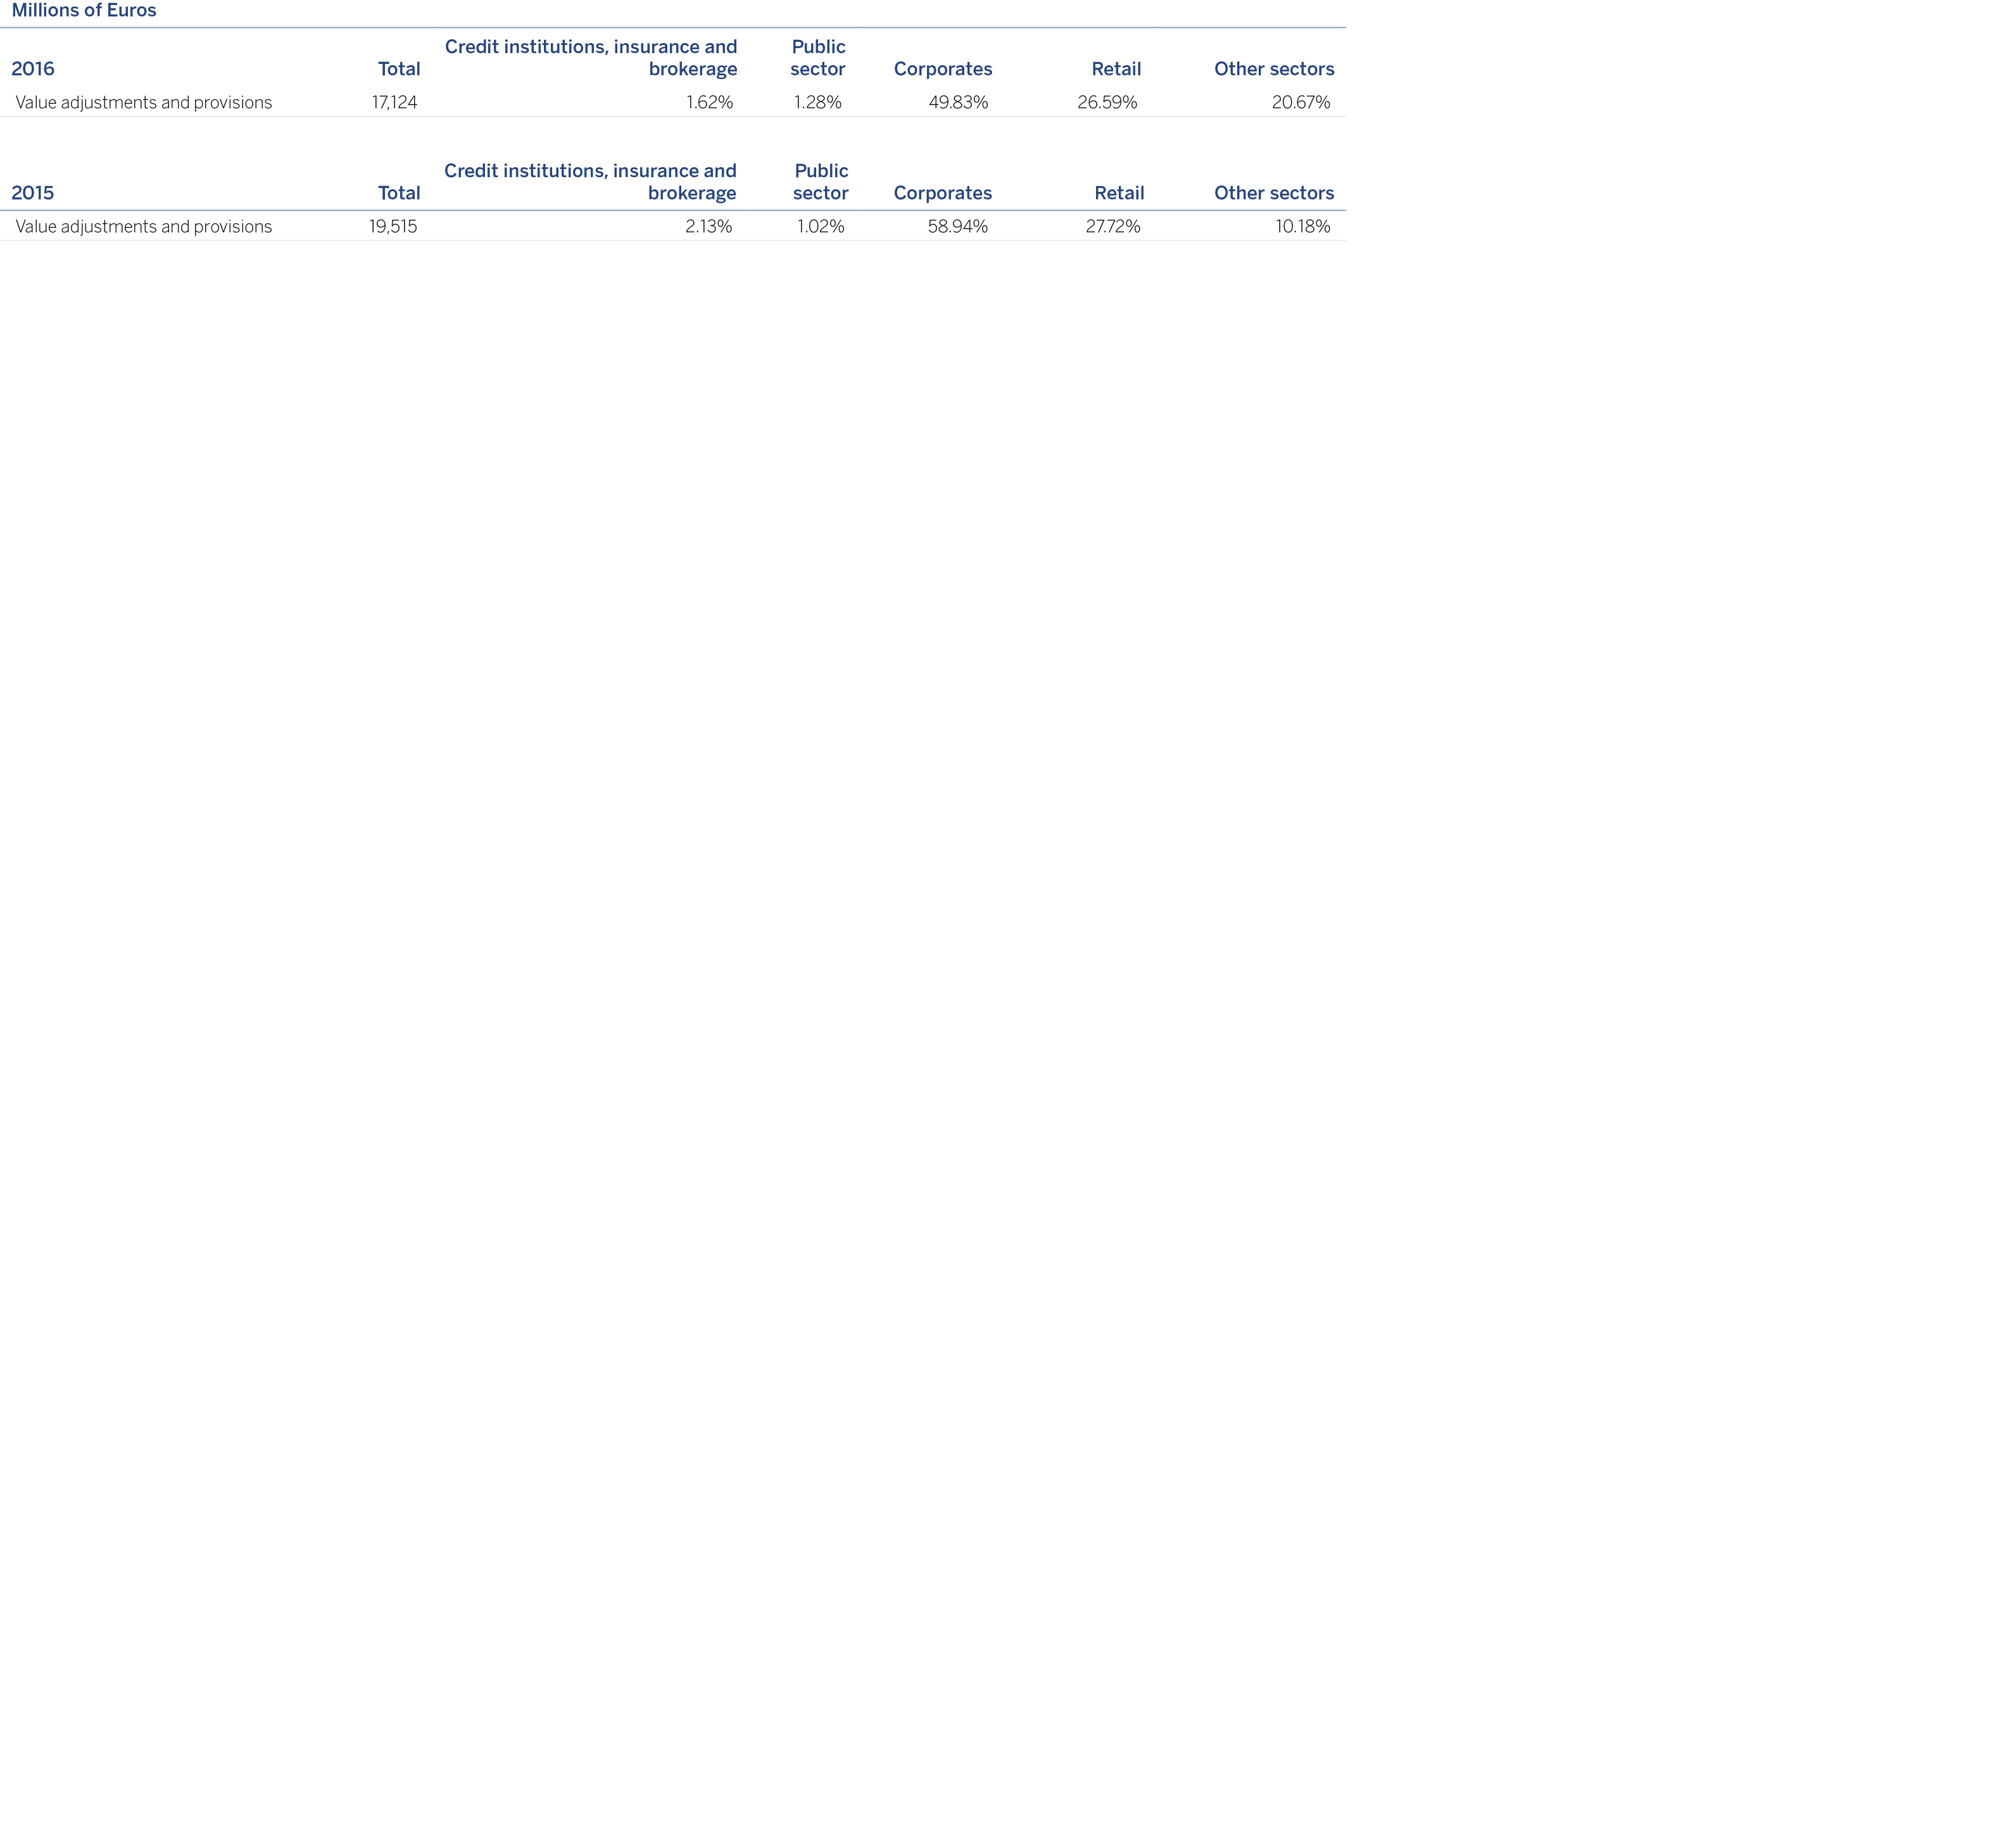
Below is the distribution by economic sector (standardized and advanced measurement approaches and counterparty credit risk) of the original exposure, excluding holding in equities:
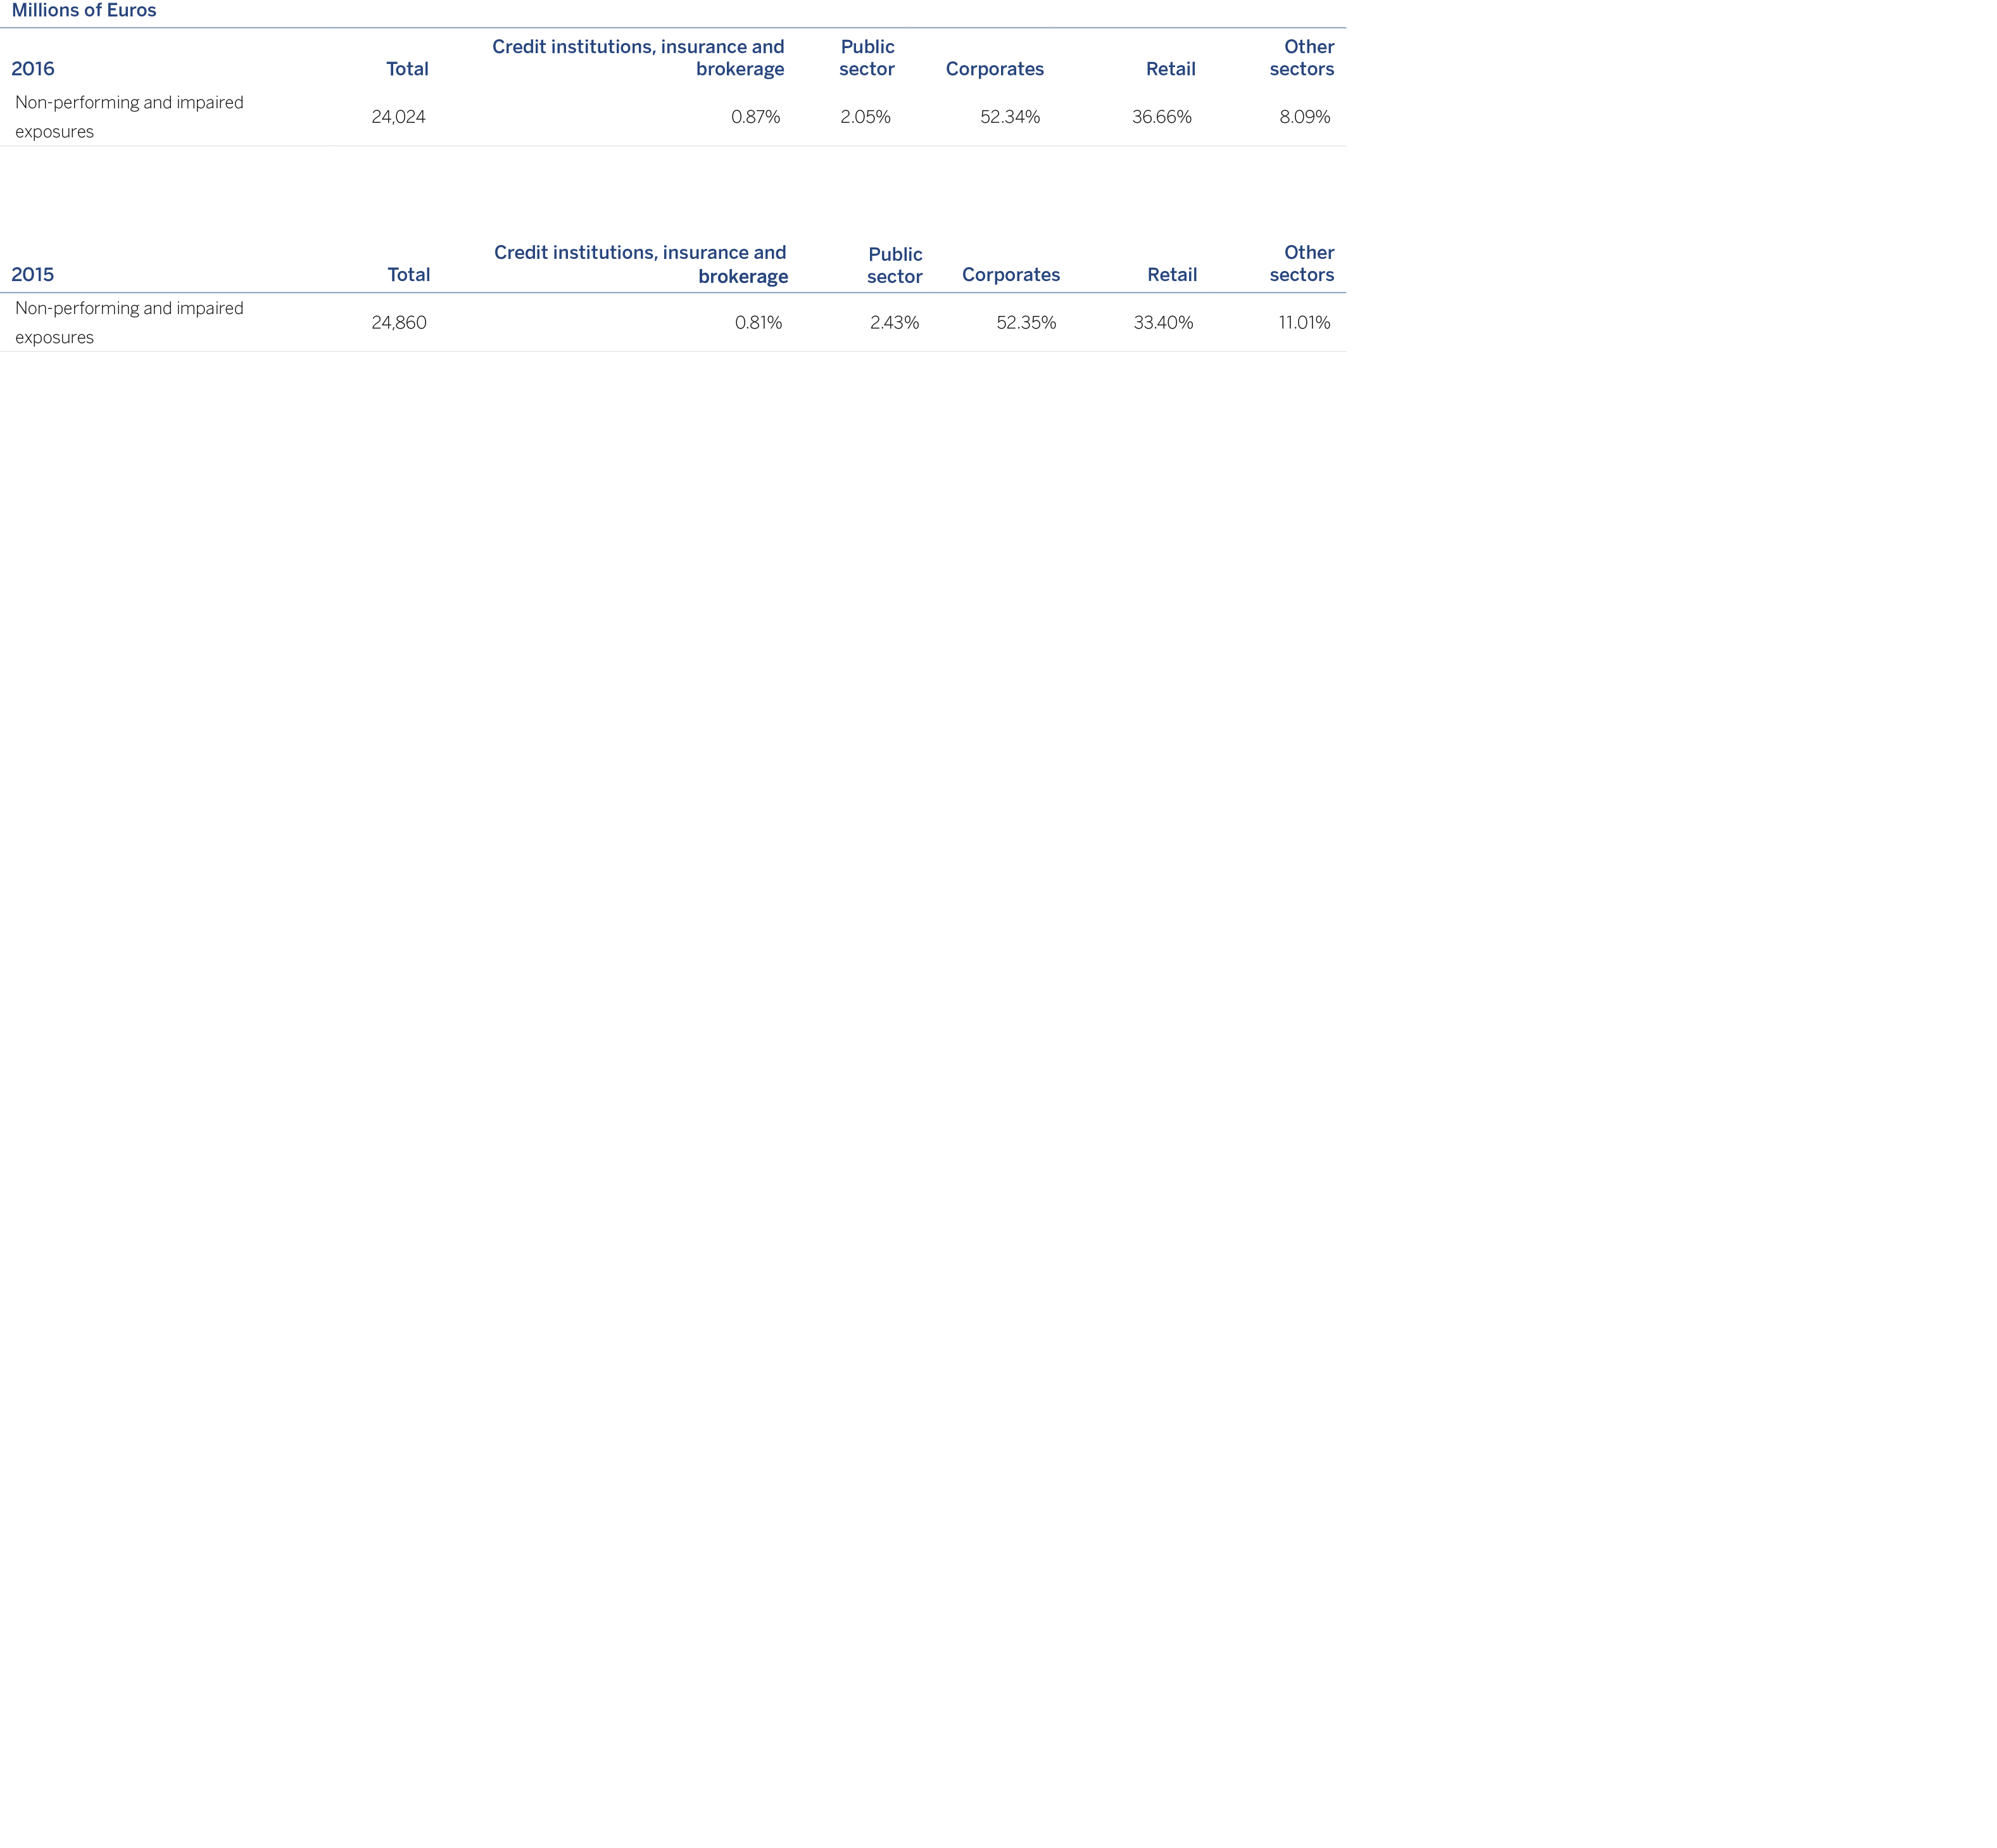
The following table shows the distribution by counterparty of the account balances of the non-performing and impaired exposures of financial assets and contingent liabilities:
The next table shows the distribution by counterparty of the account balances of allowances for financial asset losses and for contingent exposures:
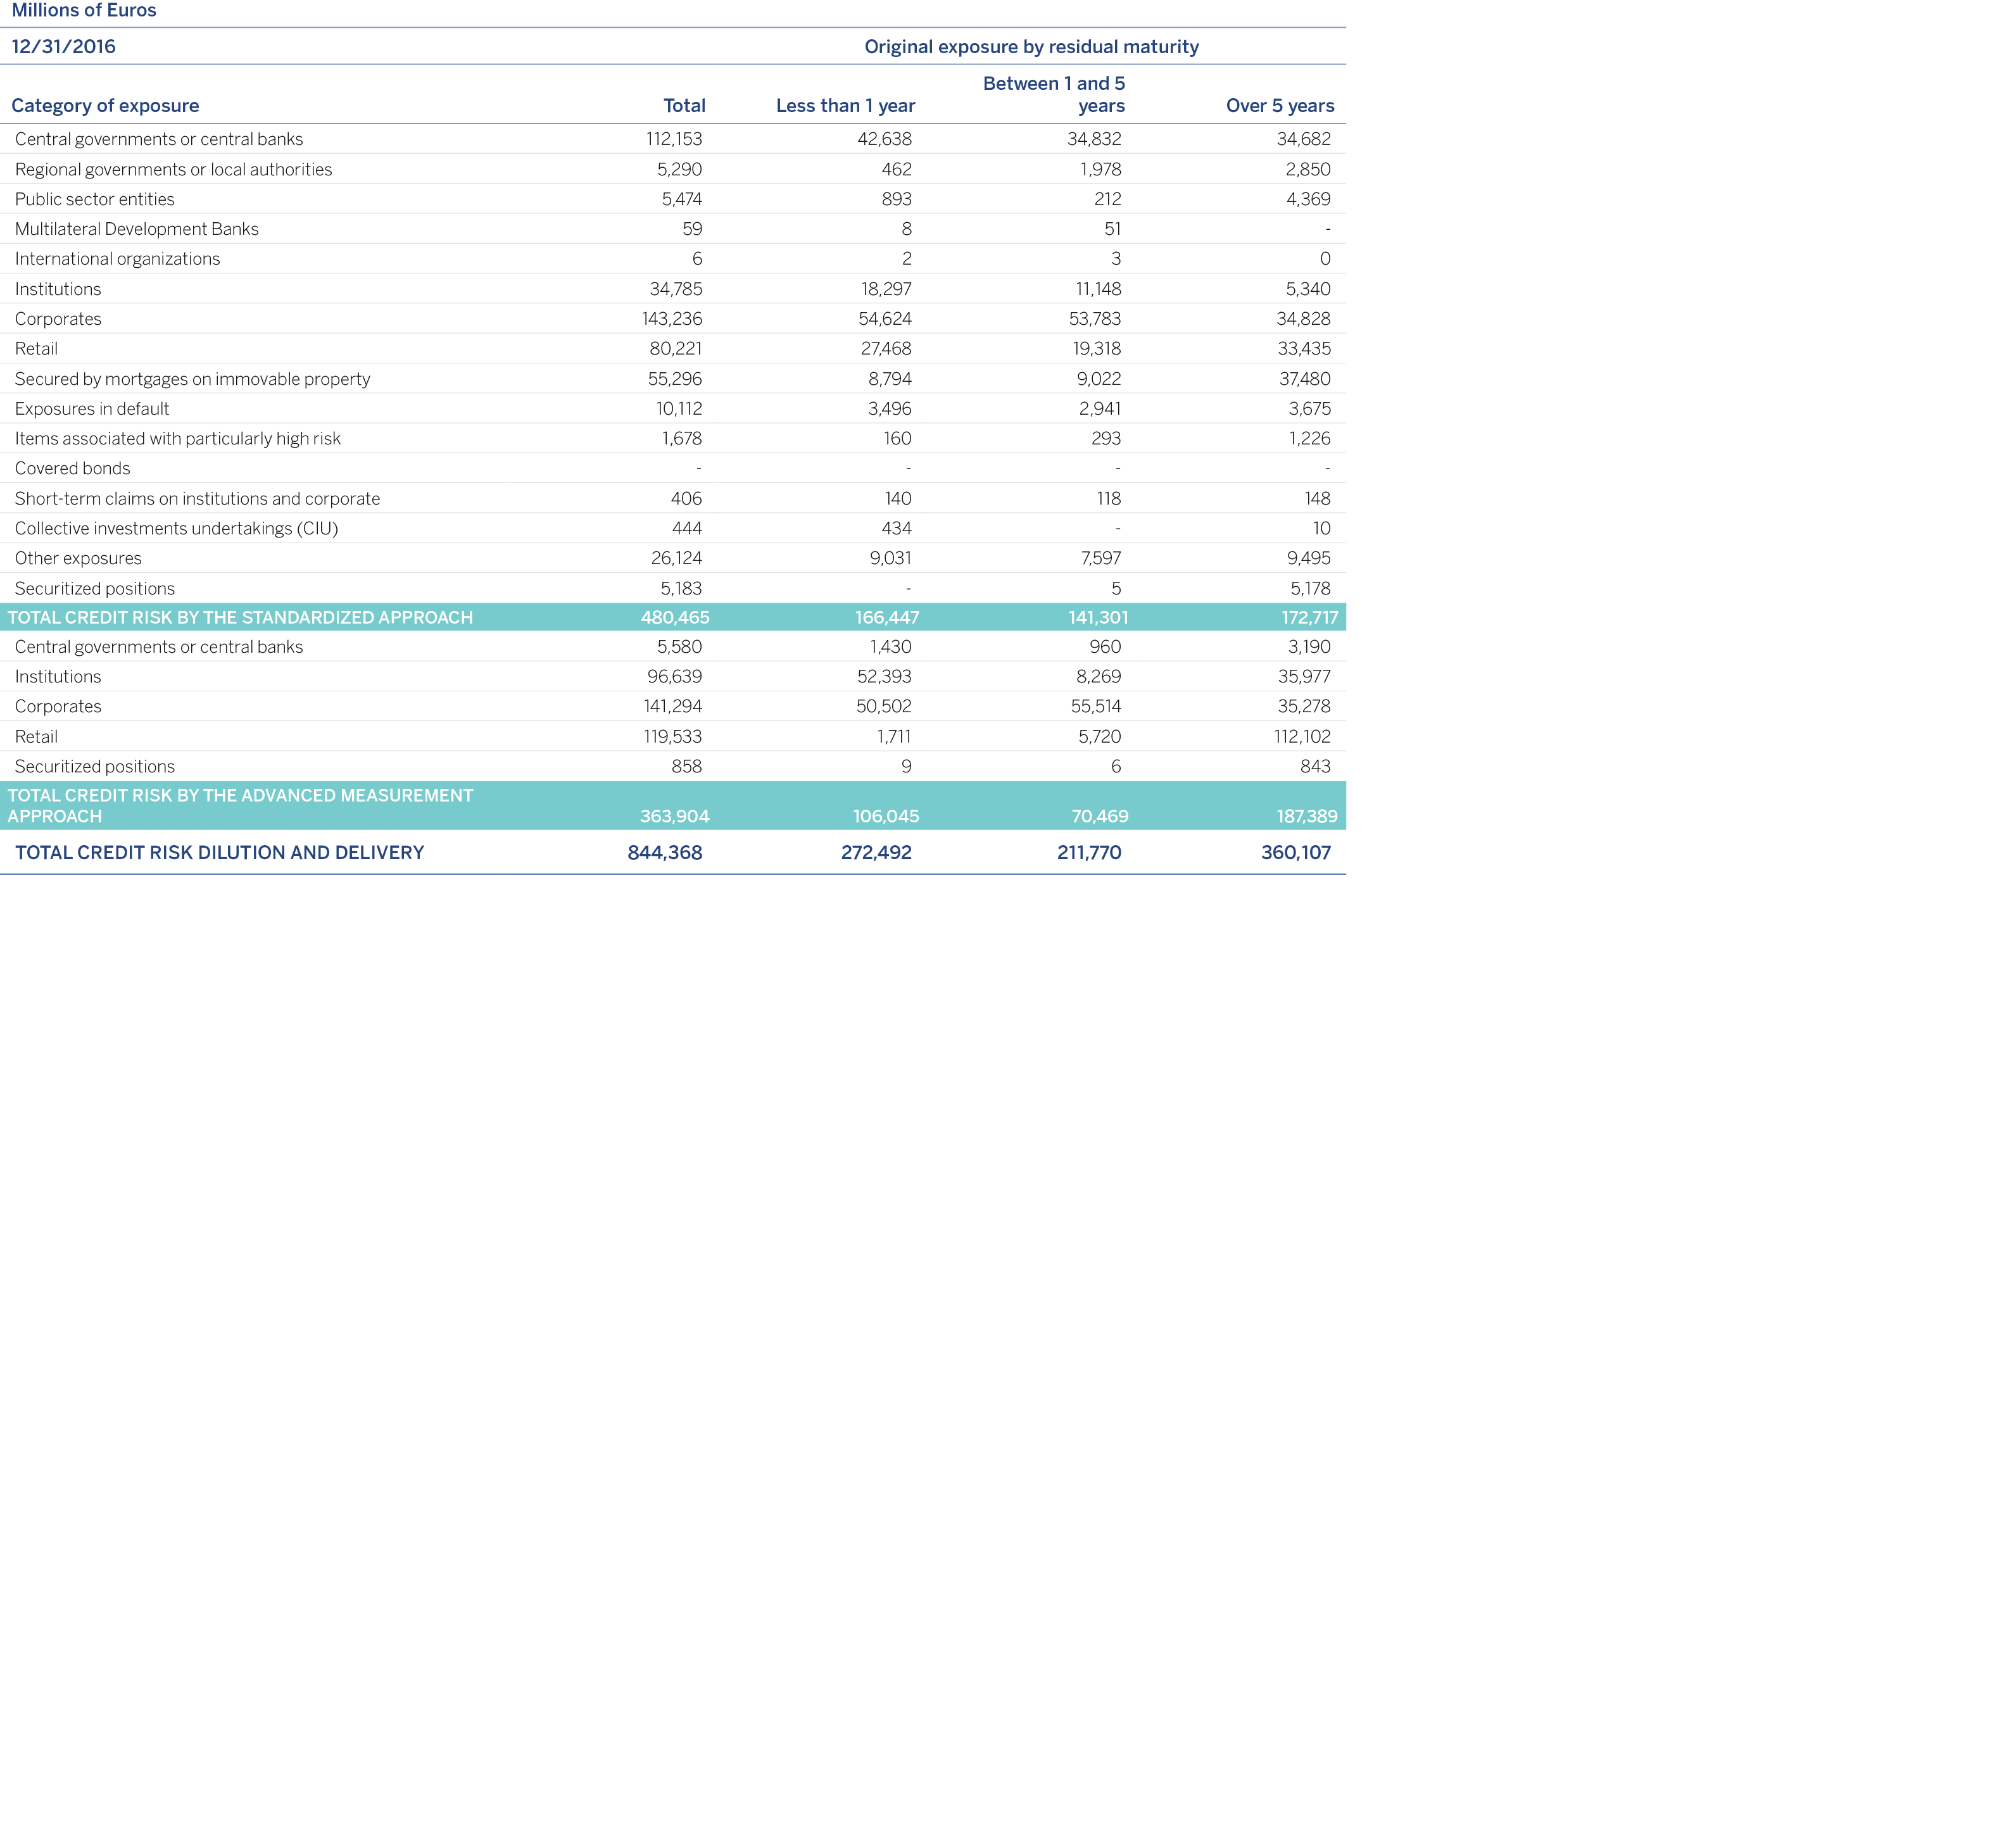
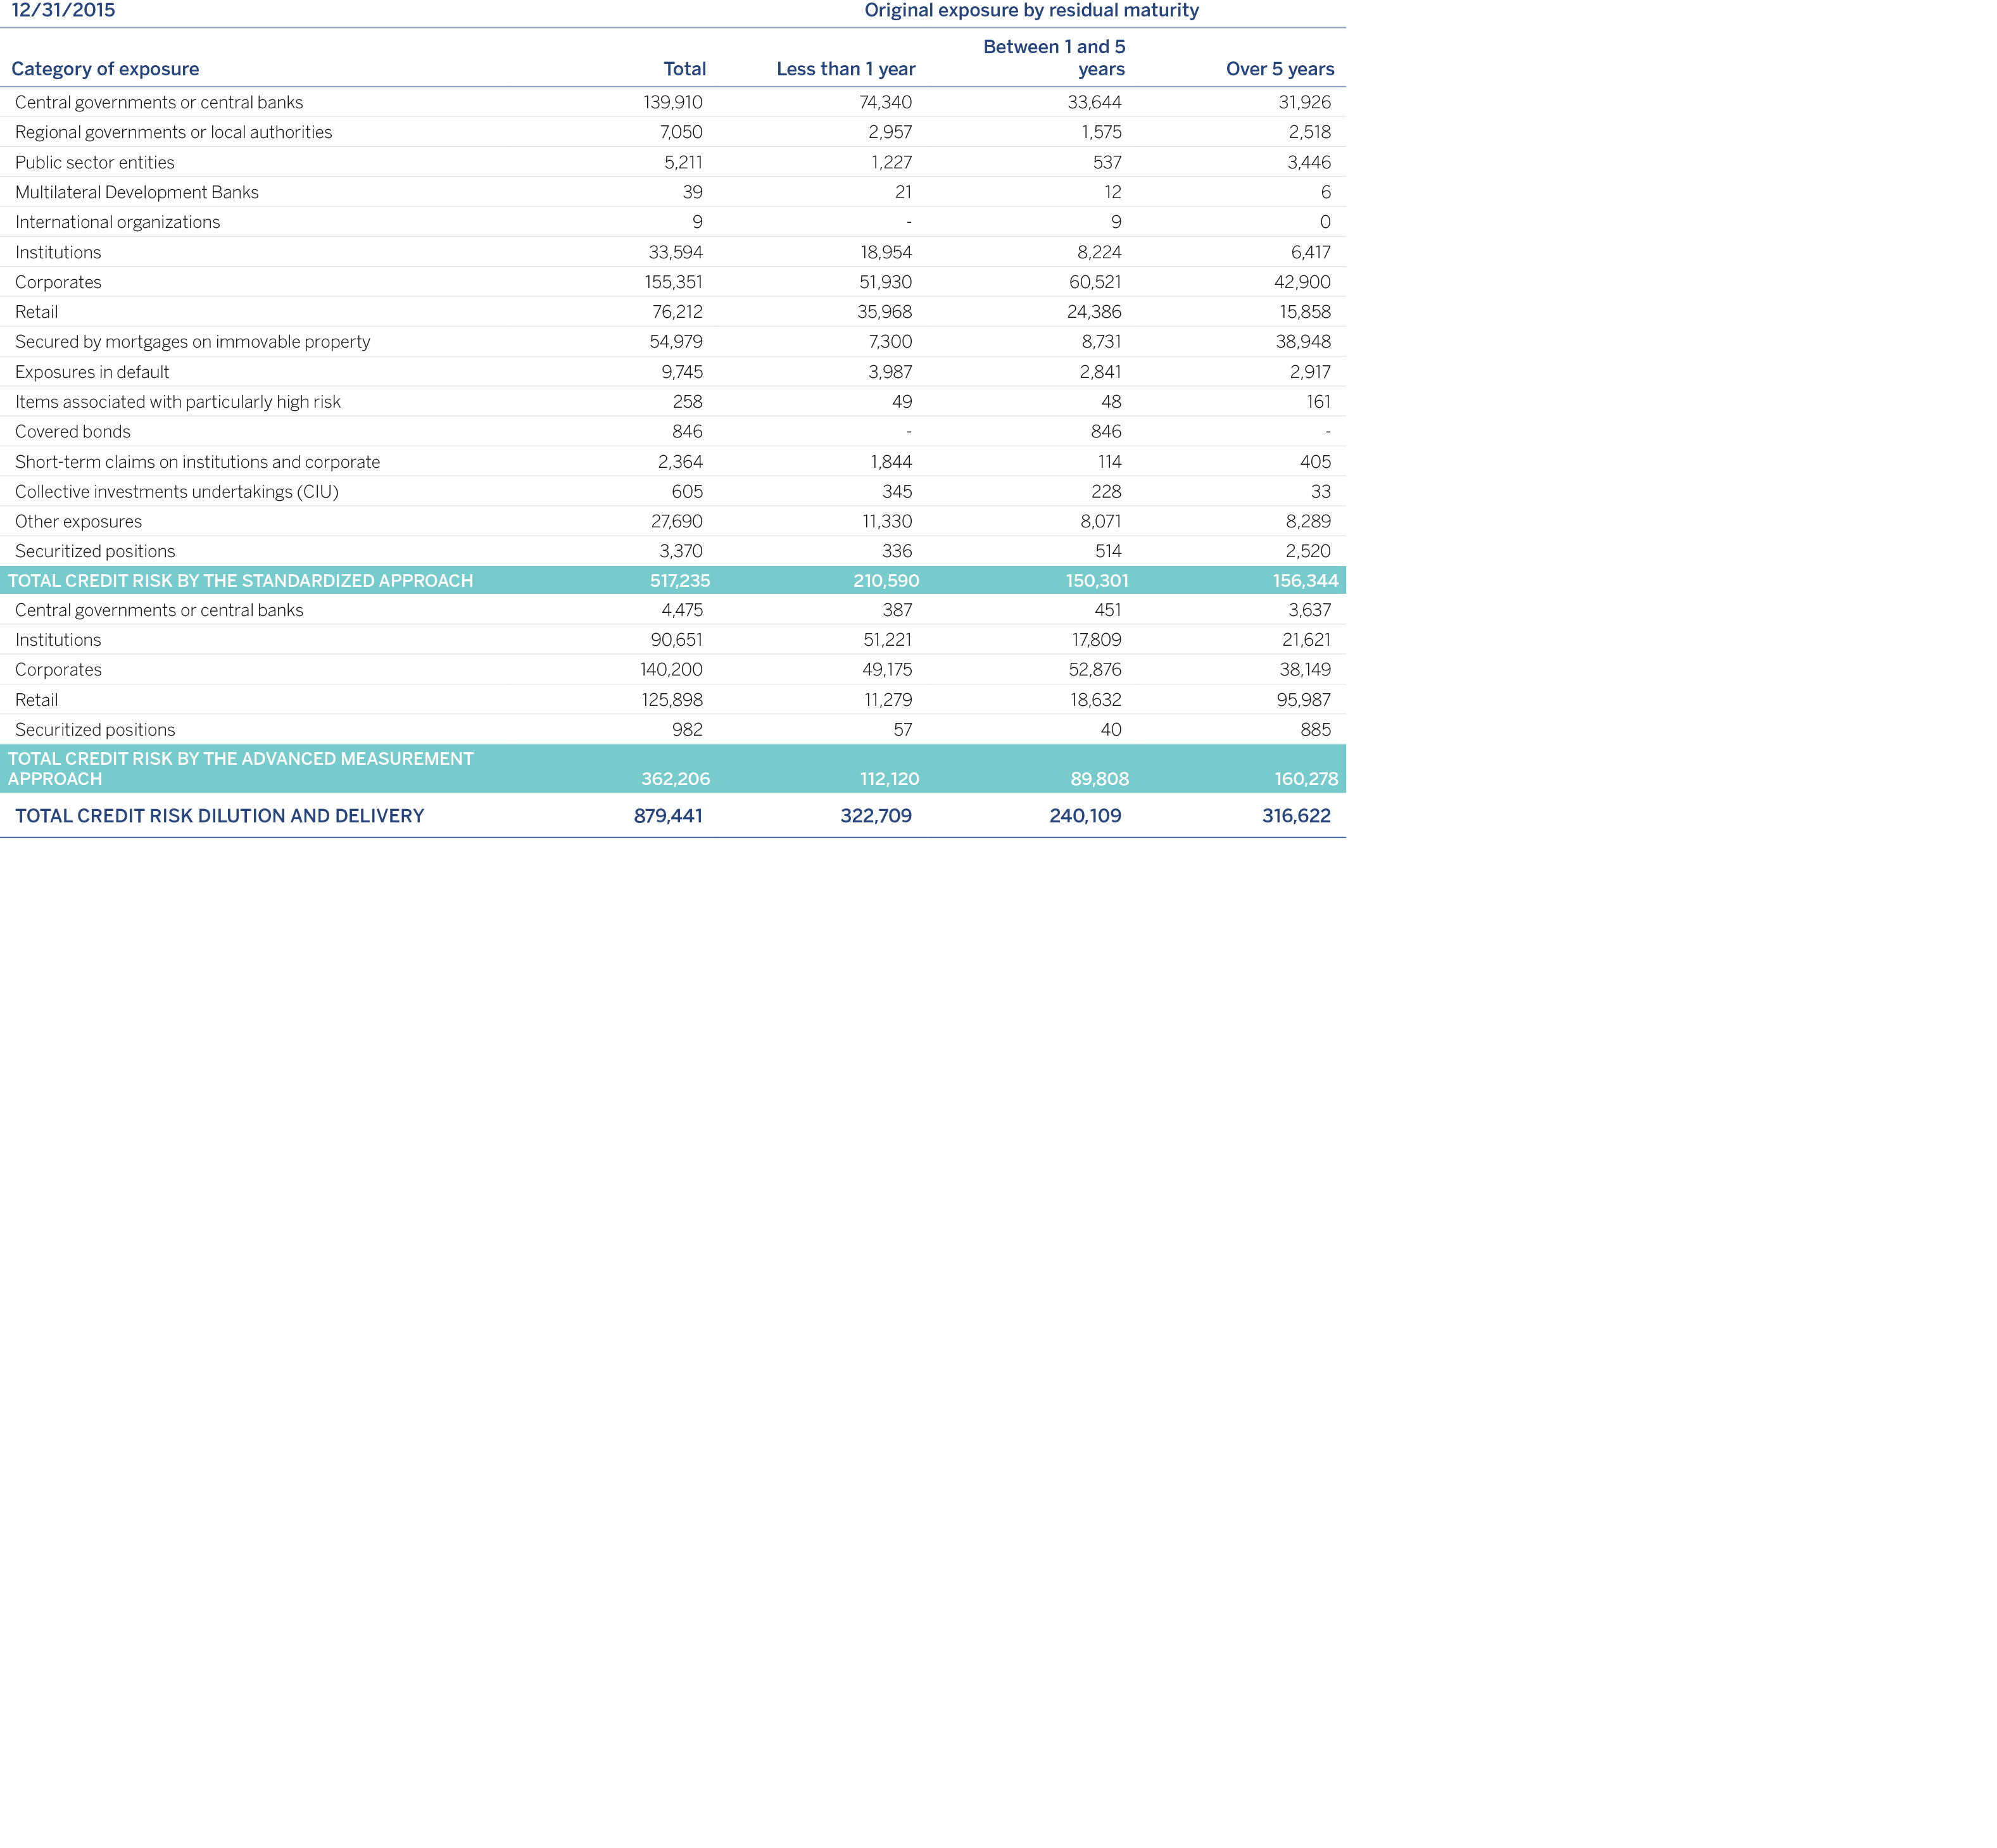
The following table shows the distribution of original exposure by residual maturity, broken down by category of exposure under the standardized and advanced measurement approaches and counterparty credit risk, excluding equity exposures:
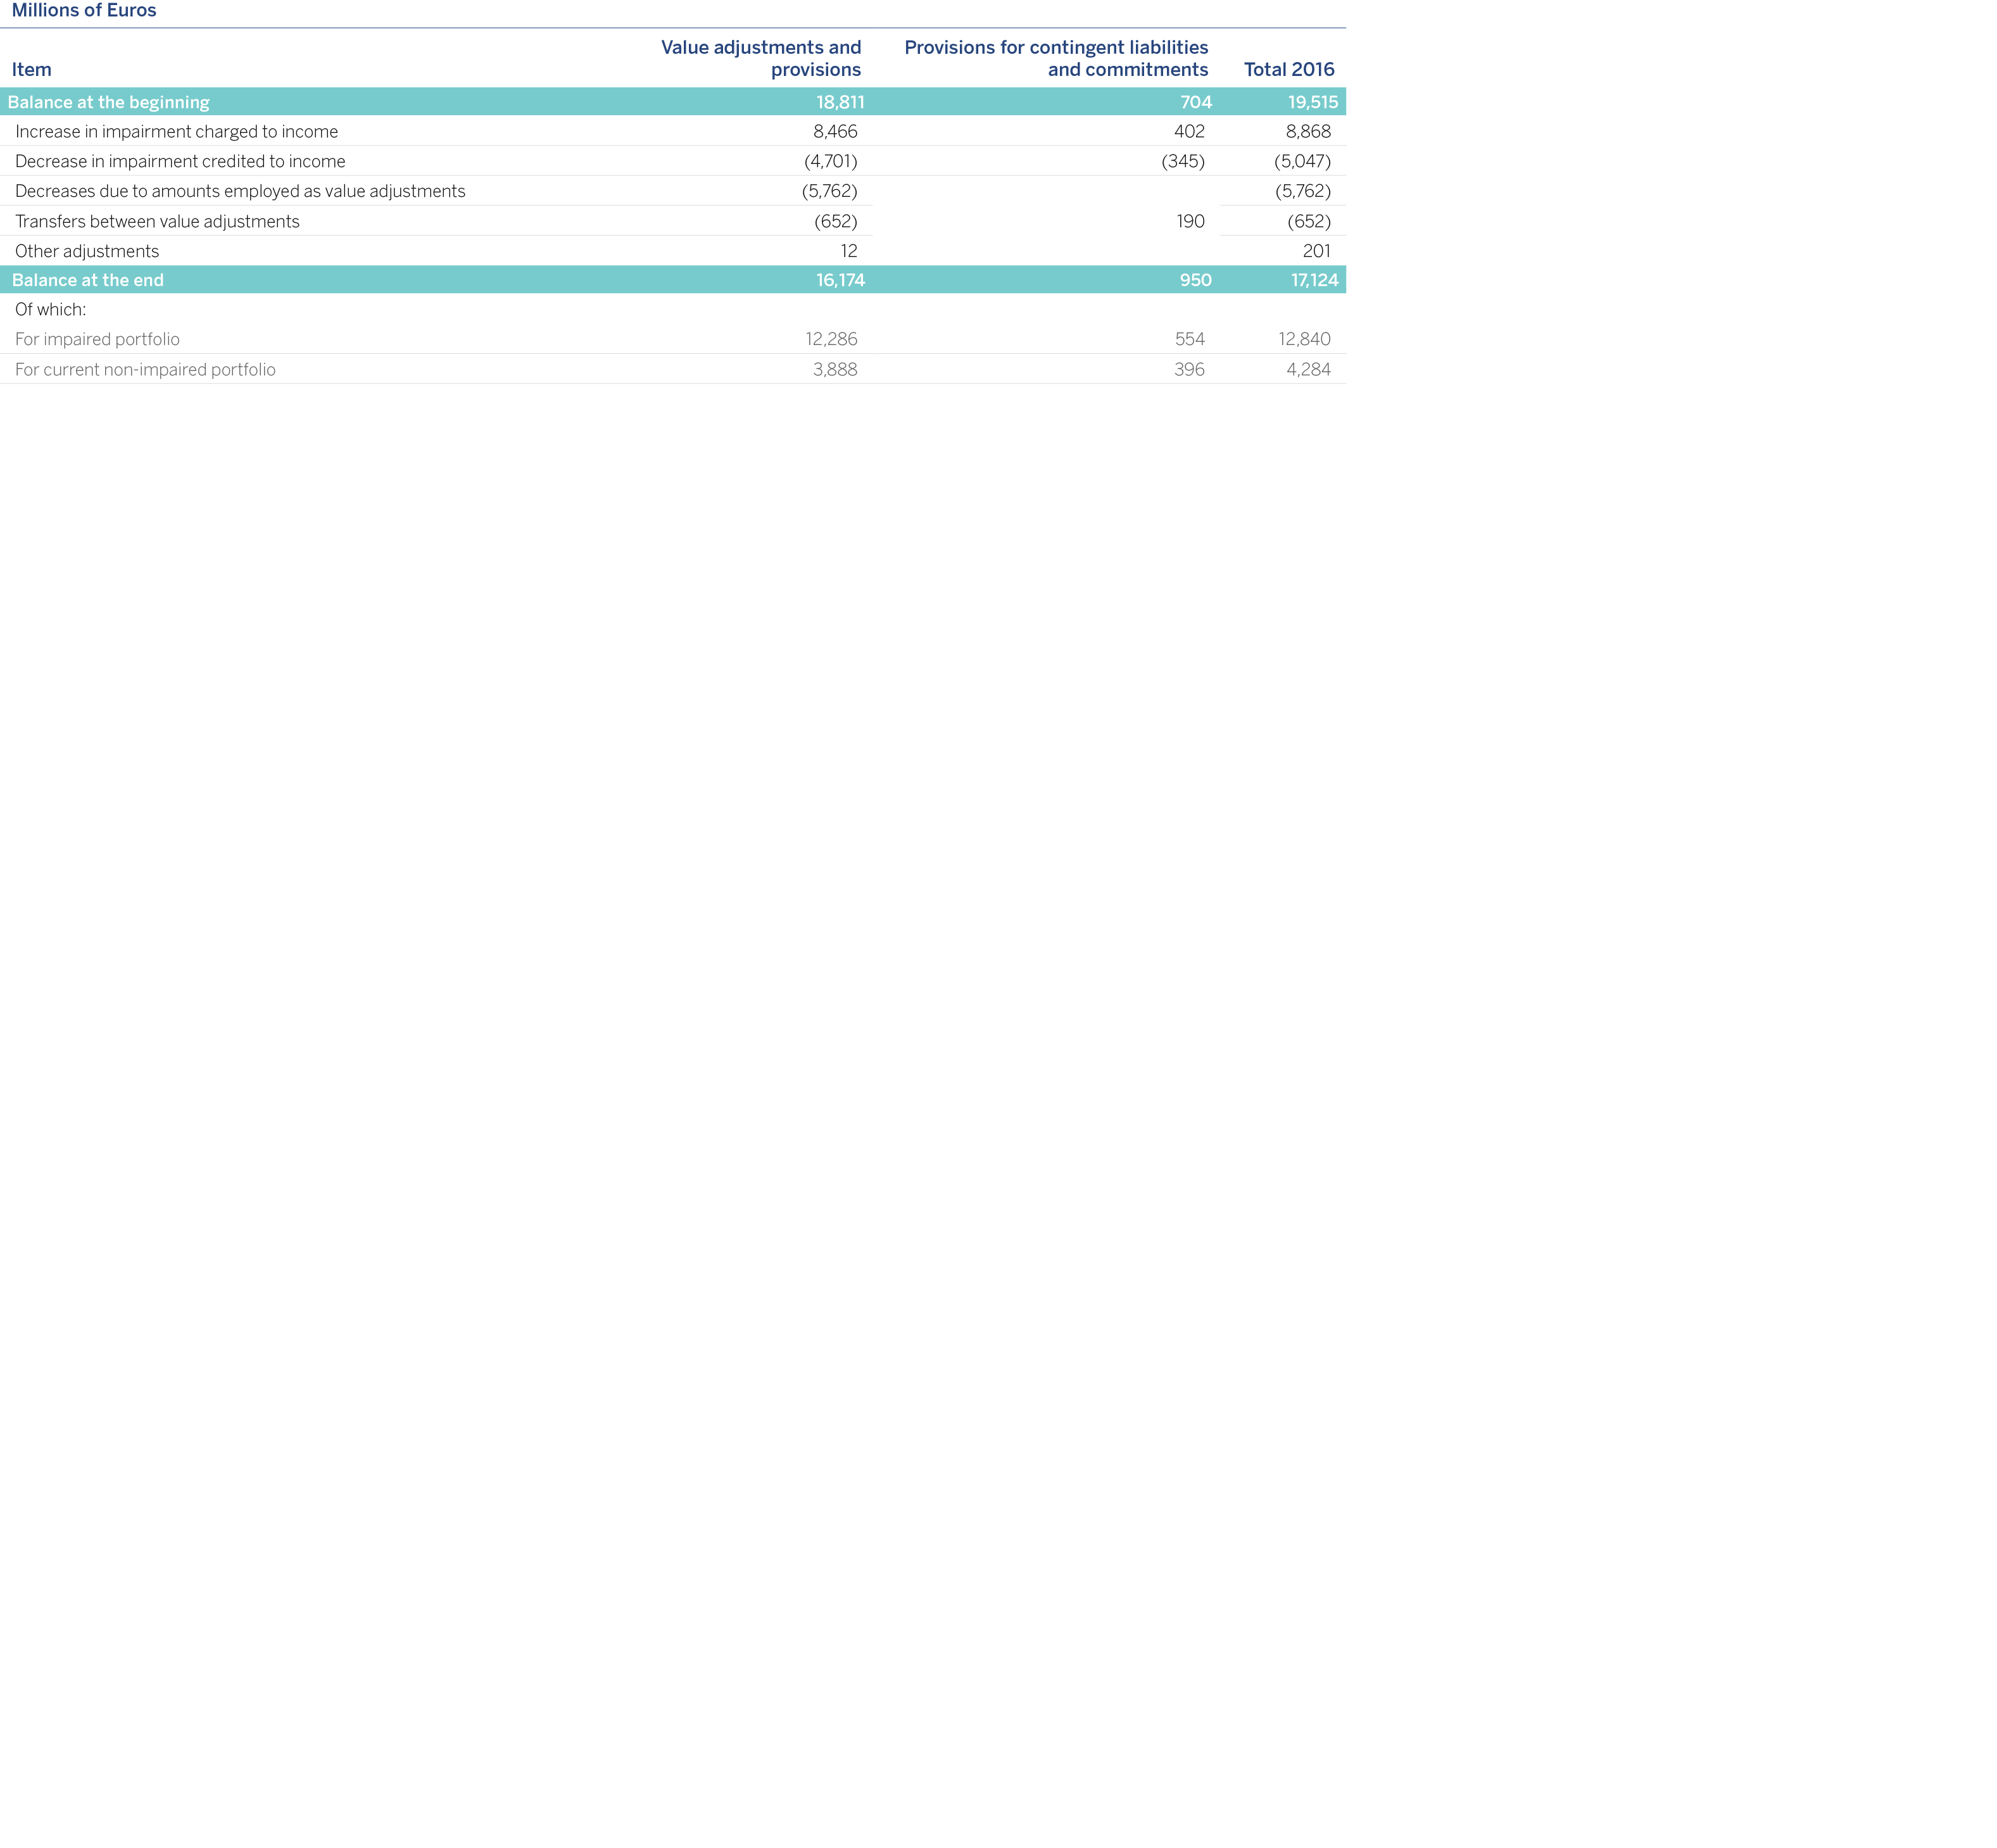
The following table presents the movement recorded in 2016 in the value adjustments for allowances and impairment losses of financial assets on the balance sheet; and for contingent risks and commitments.
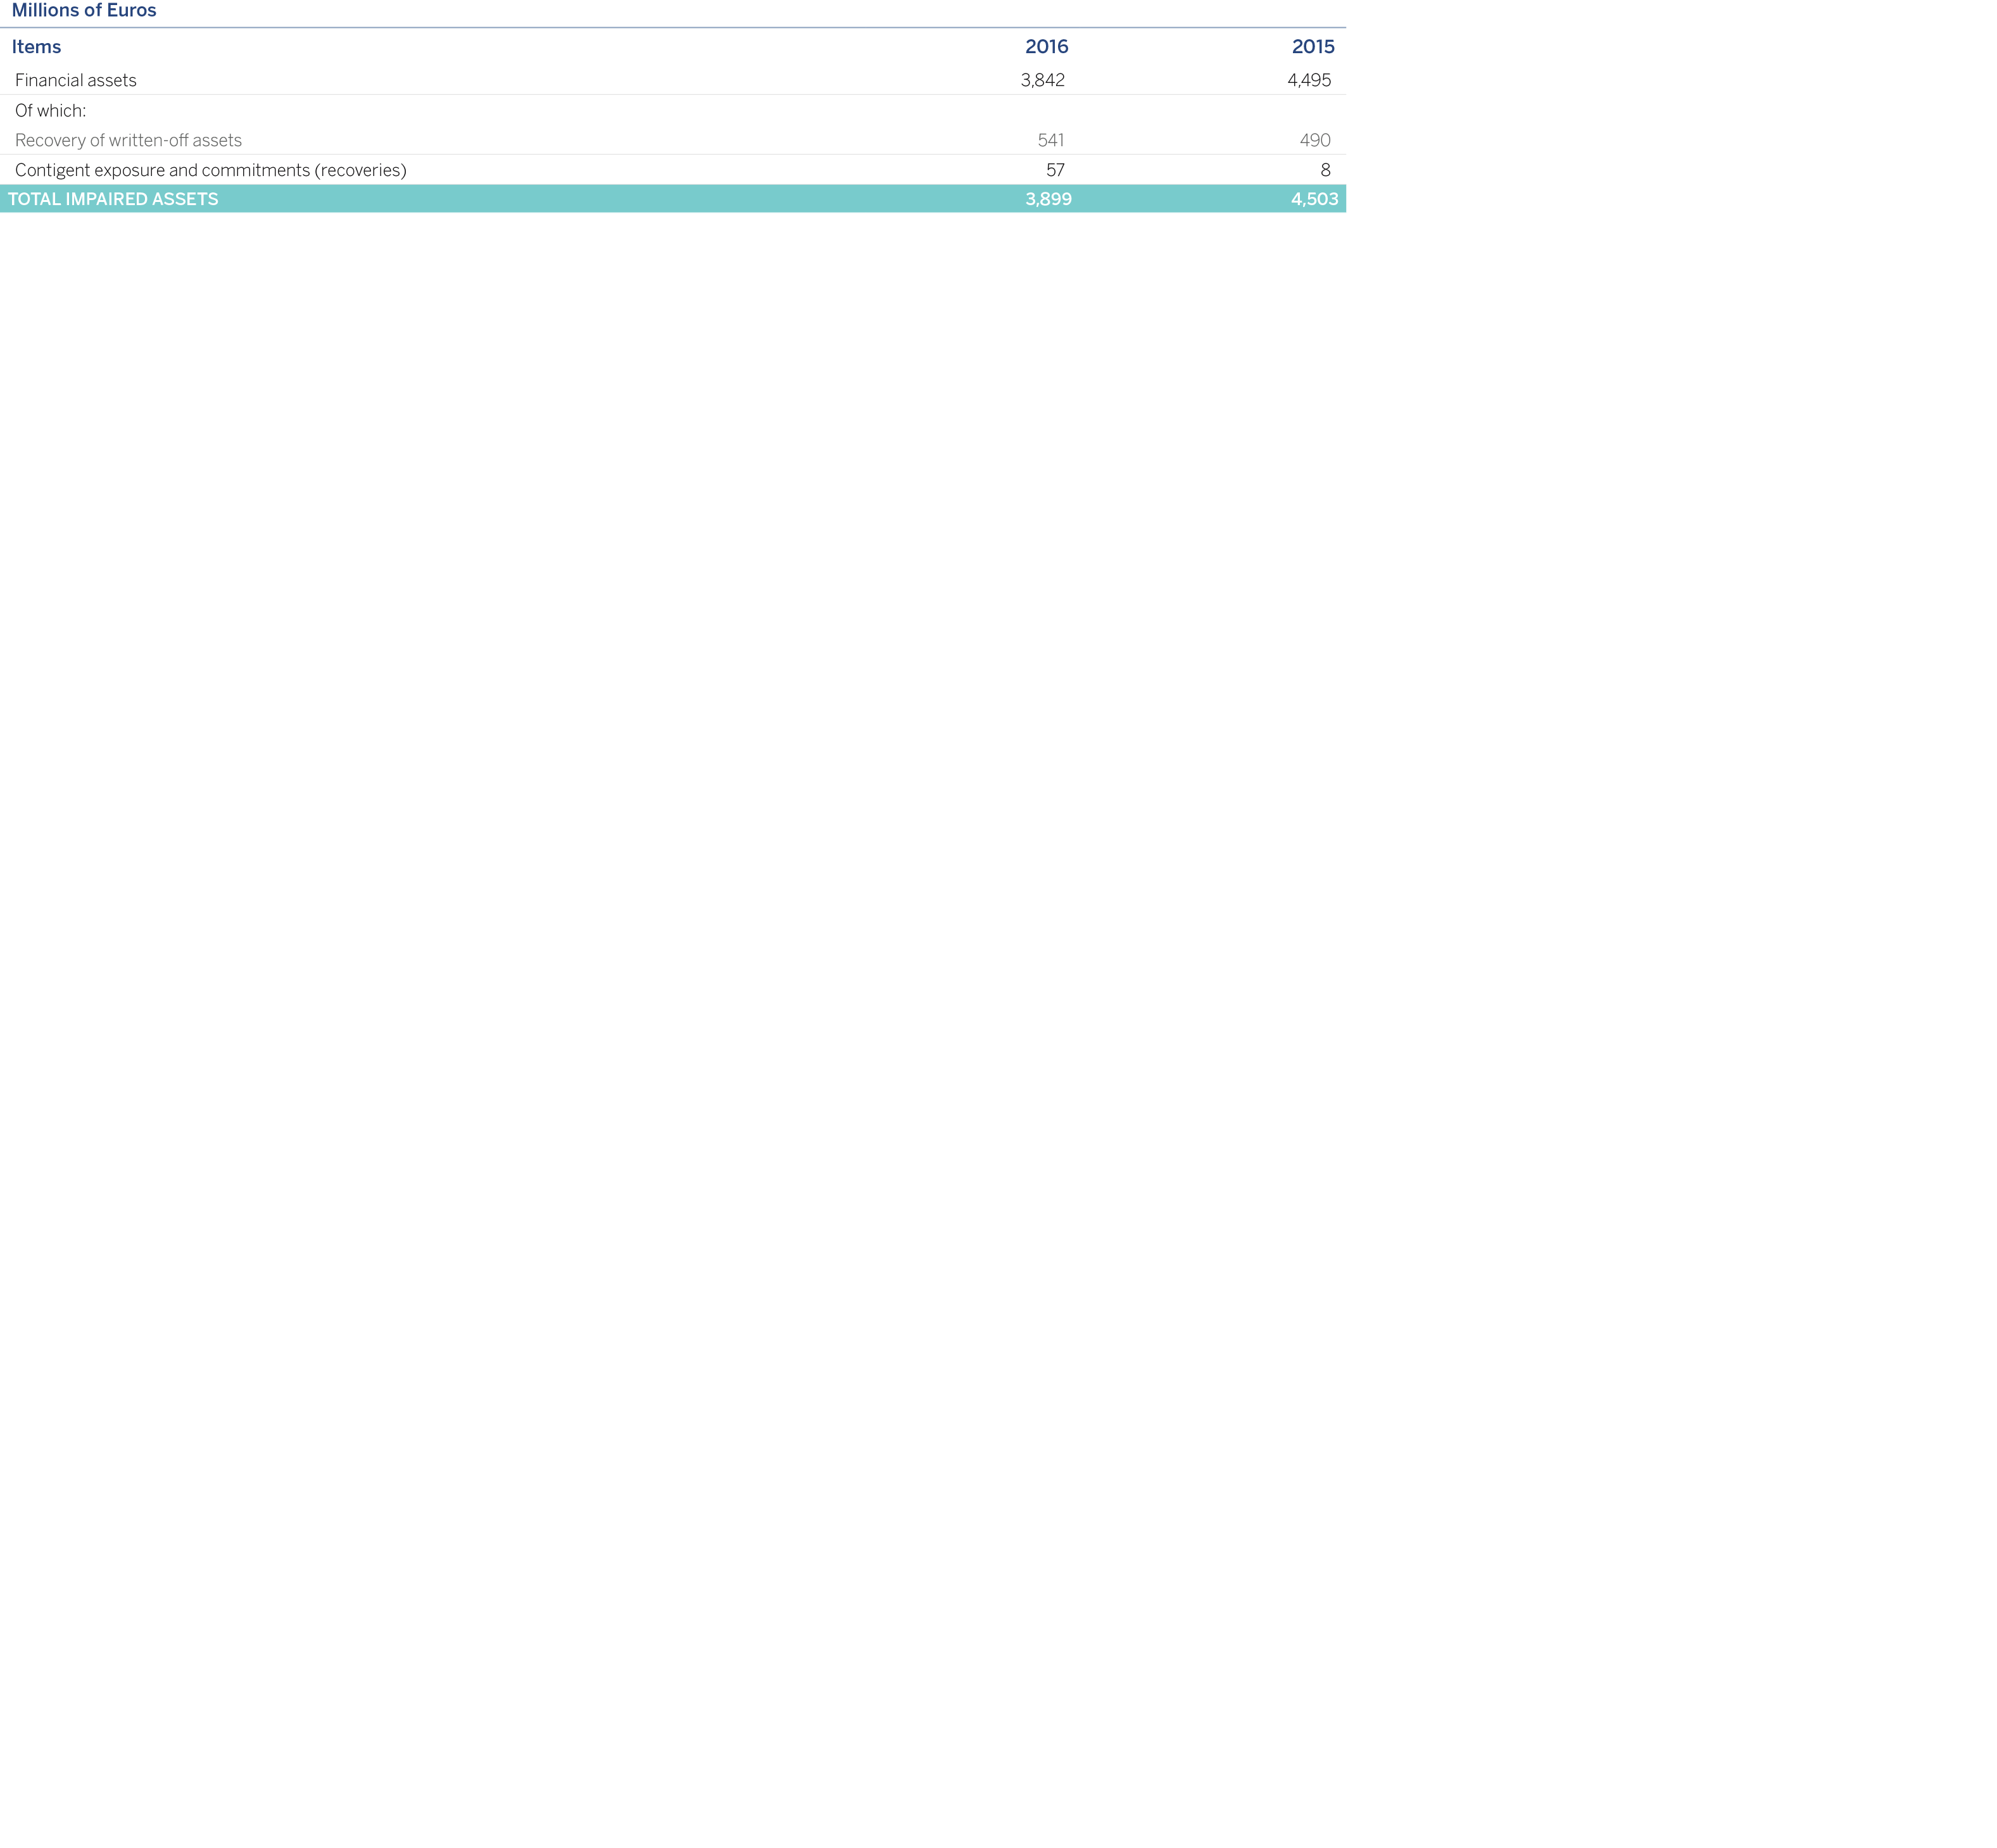
The following table shows details of impairment losses and allowances on financial assets and contingent risks and commitments, as well as derecognition of losses recognized previously in asset write-offs recorded directly in the income statement in 2016 and 2015.
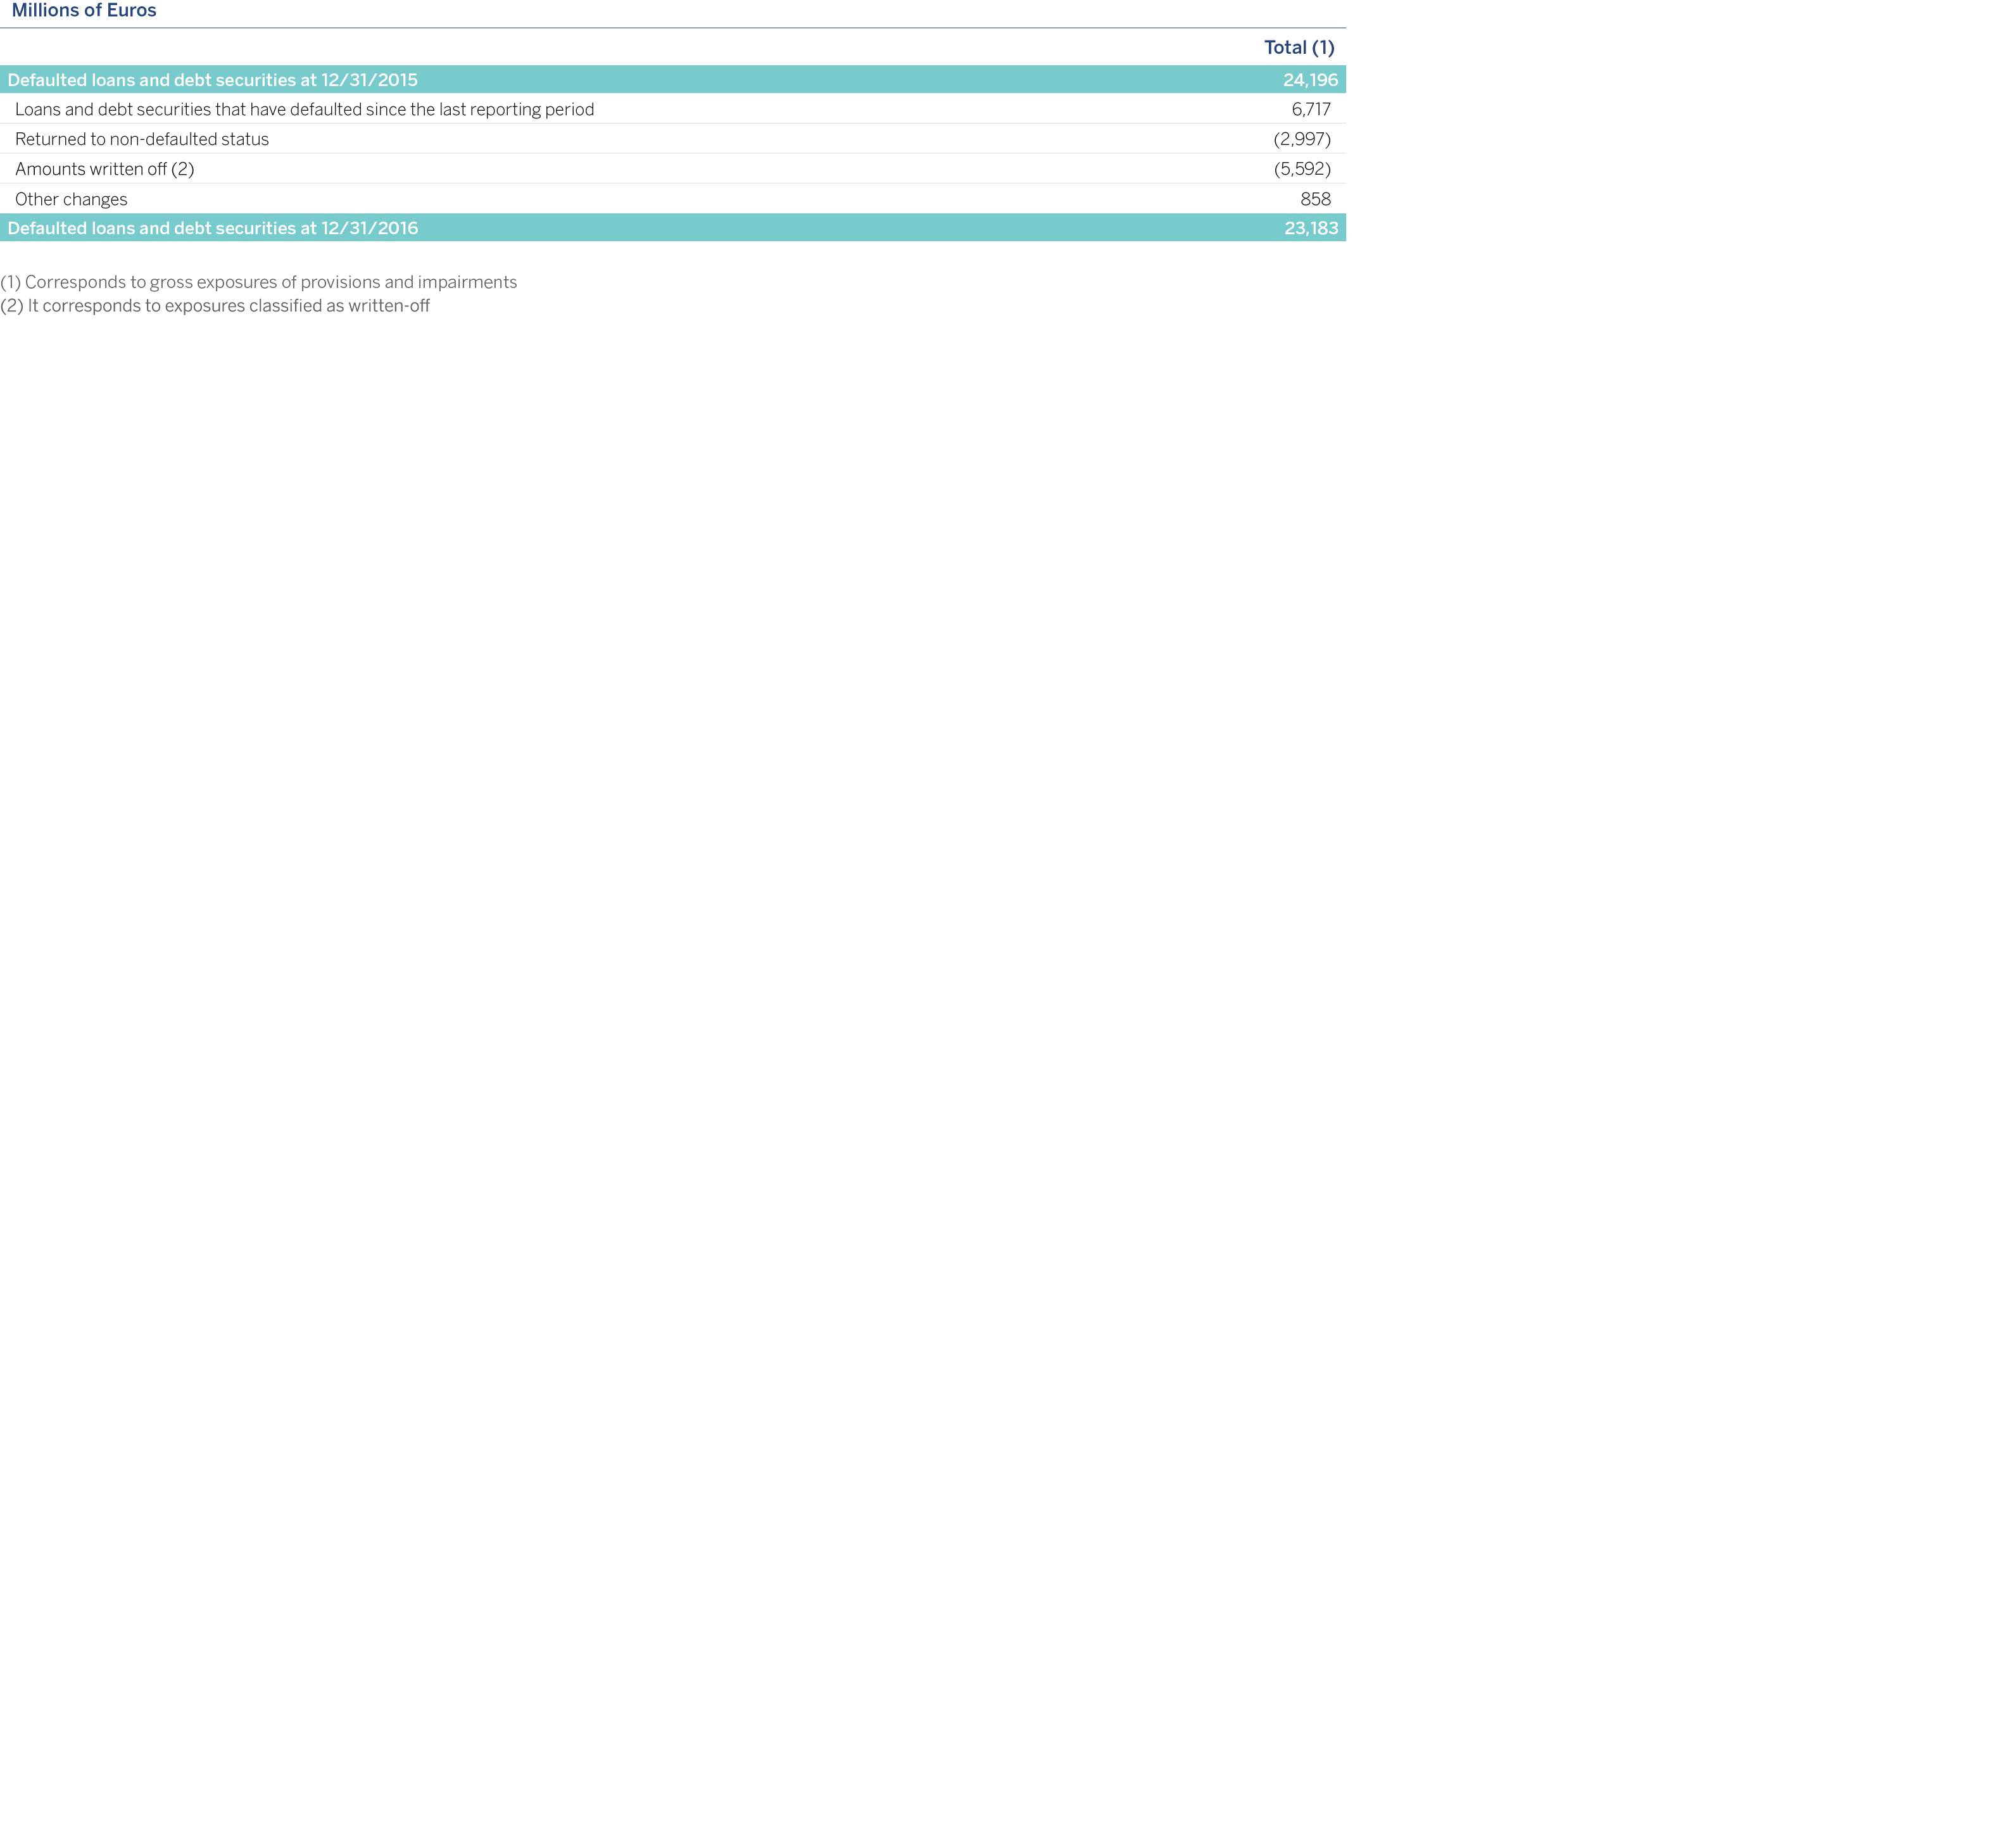
In addition, a movement in the stock of defaulted exposures in the balance sheet between December 31, 2016 and December 31, 2015 is shown below:
The external credit assessment institutions (ECAIs) appointed by the Group to determine the risk weightings applicable to its exposures are the following: Standard&Poor’s, Moody’s, Fitch and DBRS.
The exposures for which the ratings of each ECAI are used are those corresponding to the wholesale portfolios, basically involving “Sovereigns or central banks” in developed countries, and “Financial Institutions”.
In cases where a counterparty has ratings by different ECAIs, the Group follows the procedure laid down in Article 261 of the Solvency Regulations, which specifies the order of priority to be used in the assignment of ratings.
When two different credit ratings made by designated ECAIs are available for a rated exposure, the higher risk weighting will be applied. However, when there are more than two credit ratings for the same rated exposure, use is to be made of the two credit ratings that provide the lowest risk weightings. If the two lowest risk weightings coincide, then that weighting will be applied; if they do not coincide, the higher of the two will be applied.
The correspondence between the alphanumeric scale of each agency used and the risk categories used by the Group are defined in the final draft Implementing Technical Standards on the mapping of the credit assessments of the ECAI under Article 136(1) and (3) of Regulation (EU) No. 575/2013; complying with the provisions of Article 136 of the CRR.
The number of cases and the amount of these assignments is not relevant for the Group in terms of admission and management of issuer credit risk.
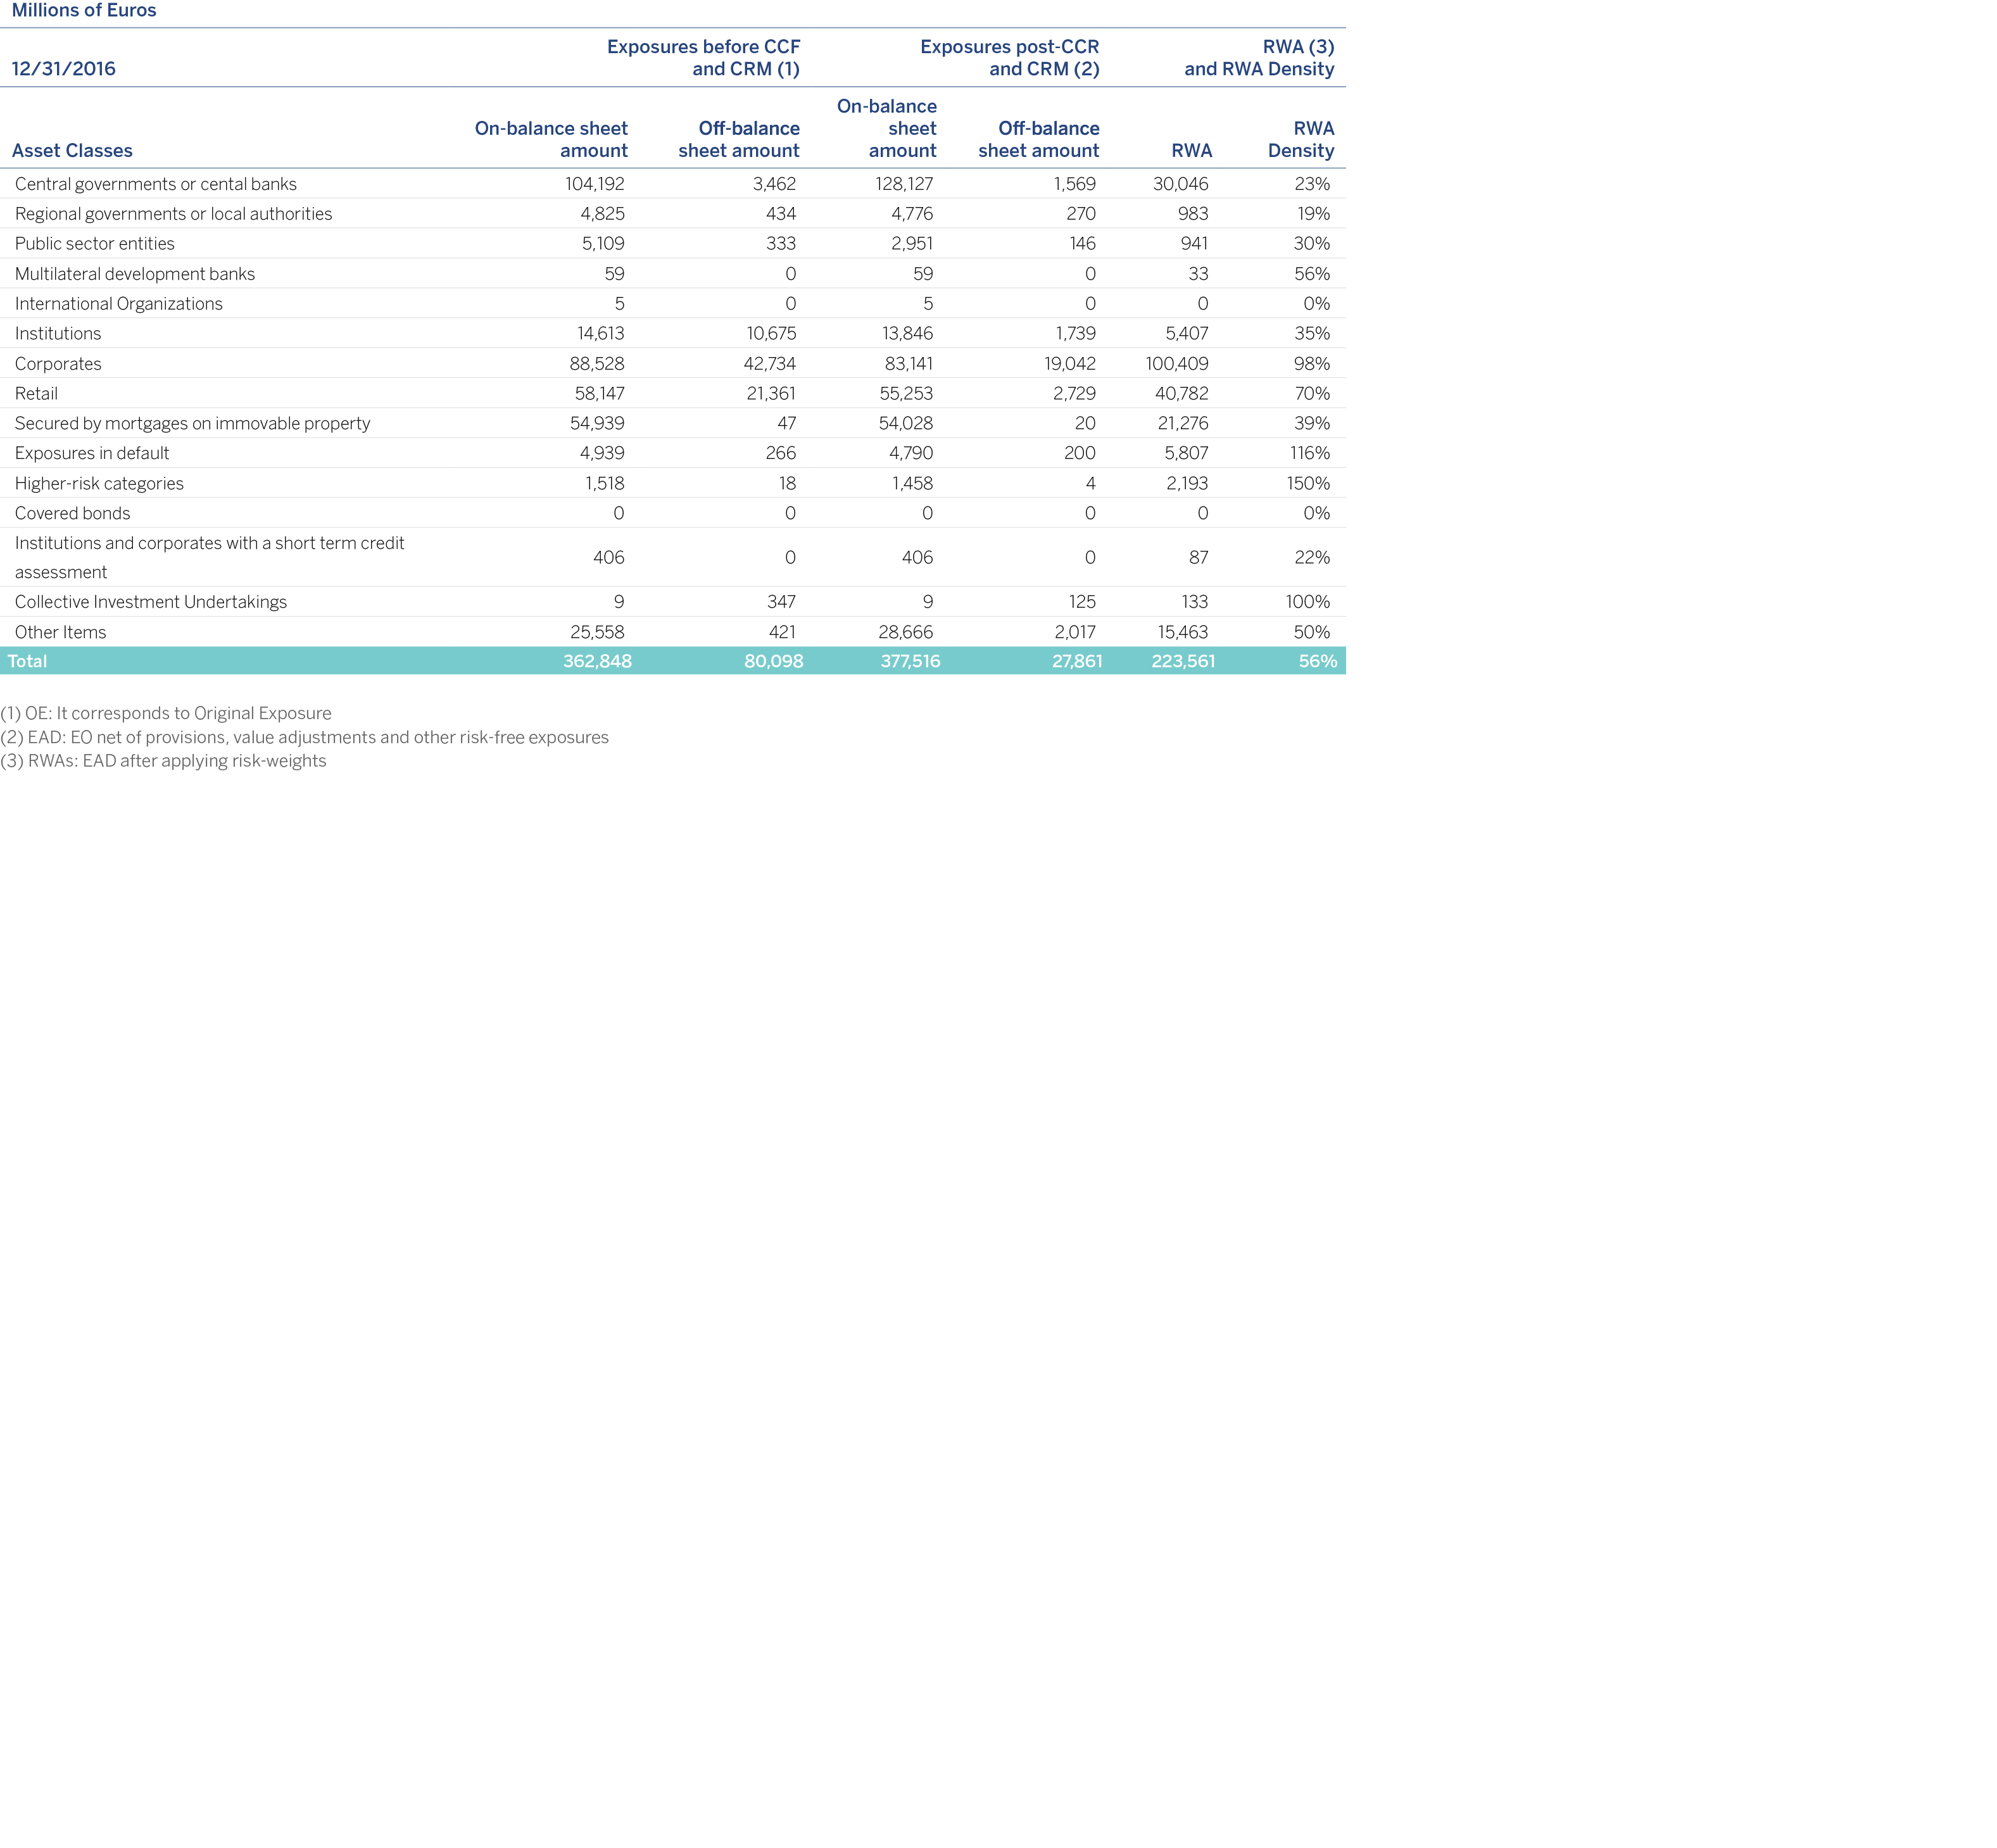
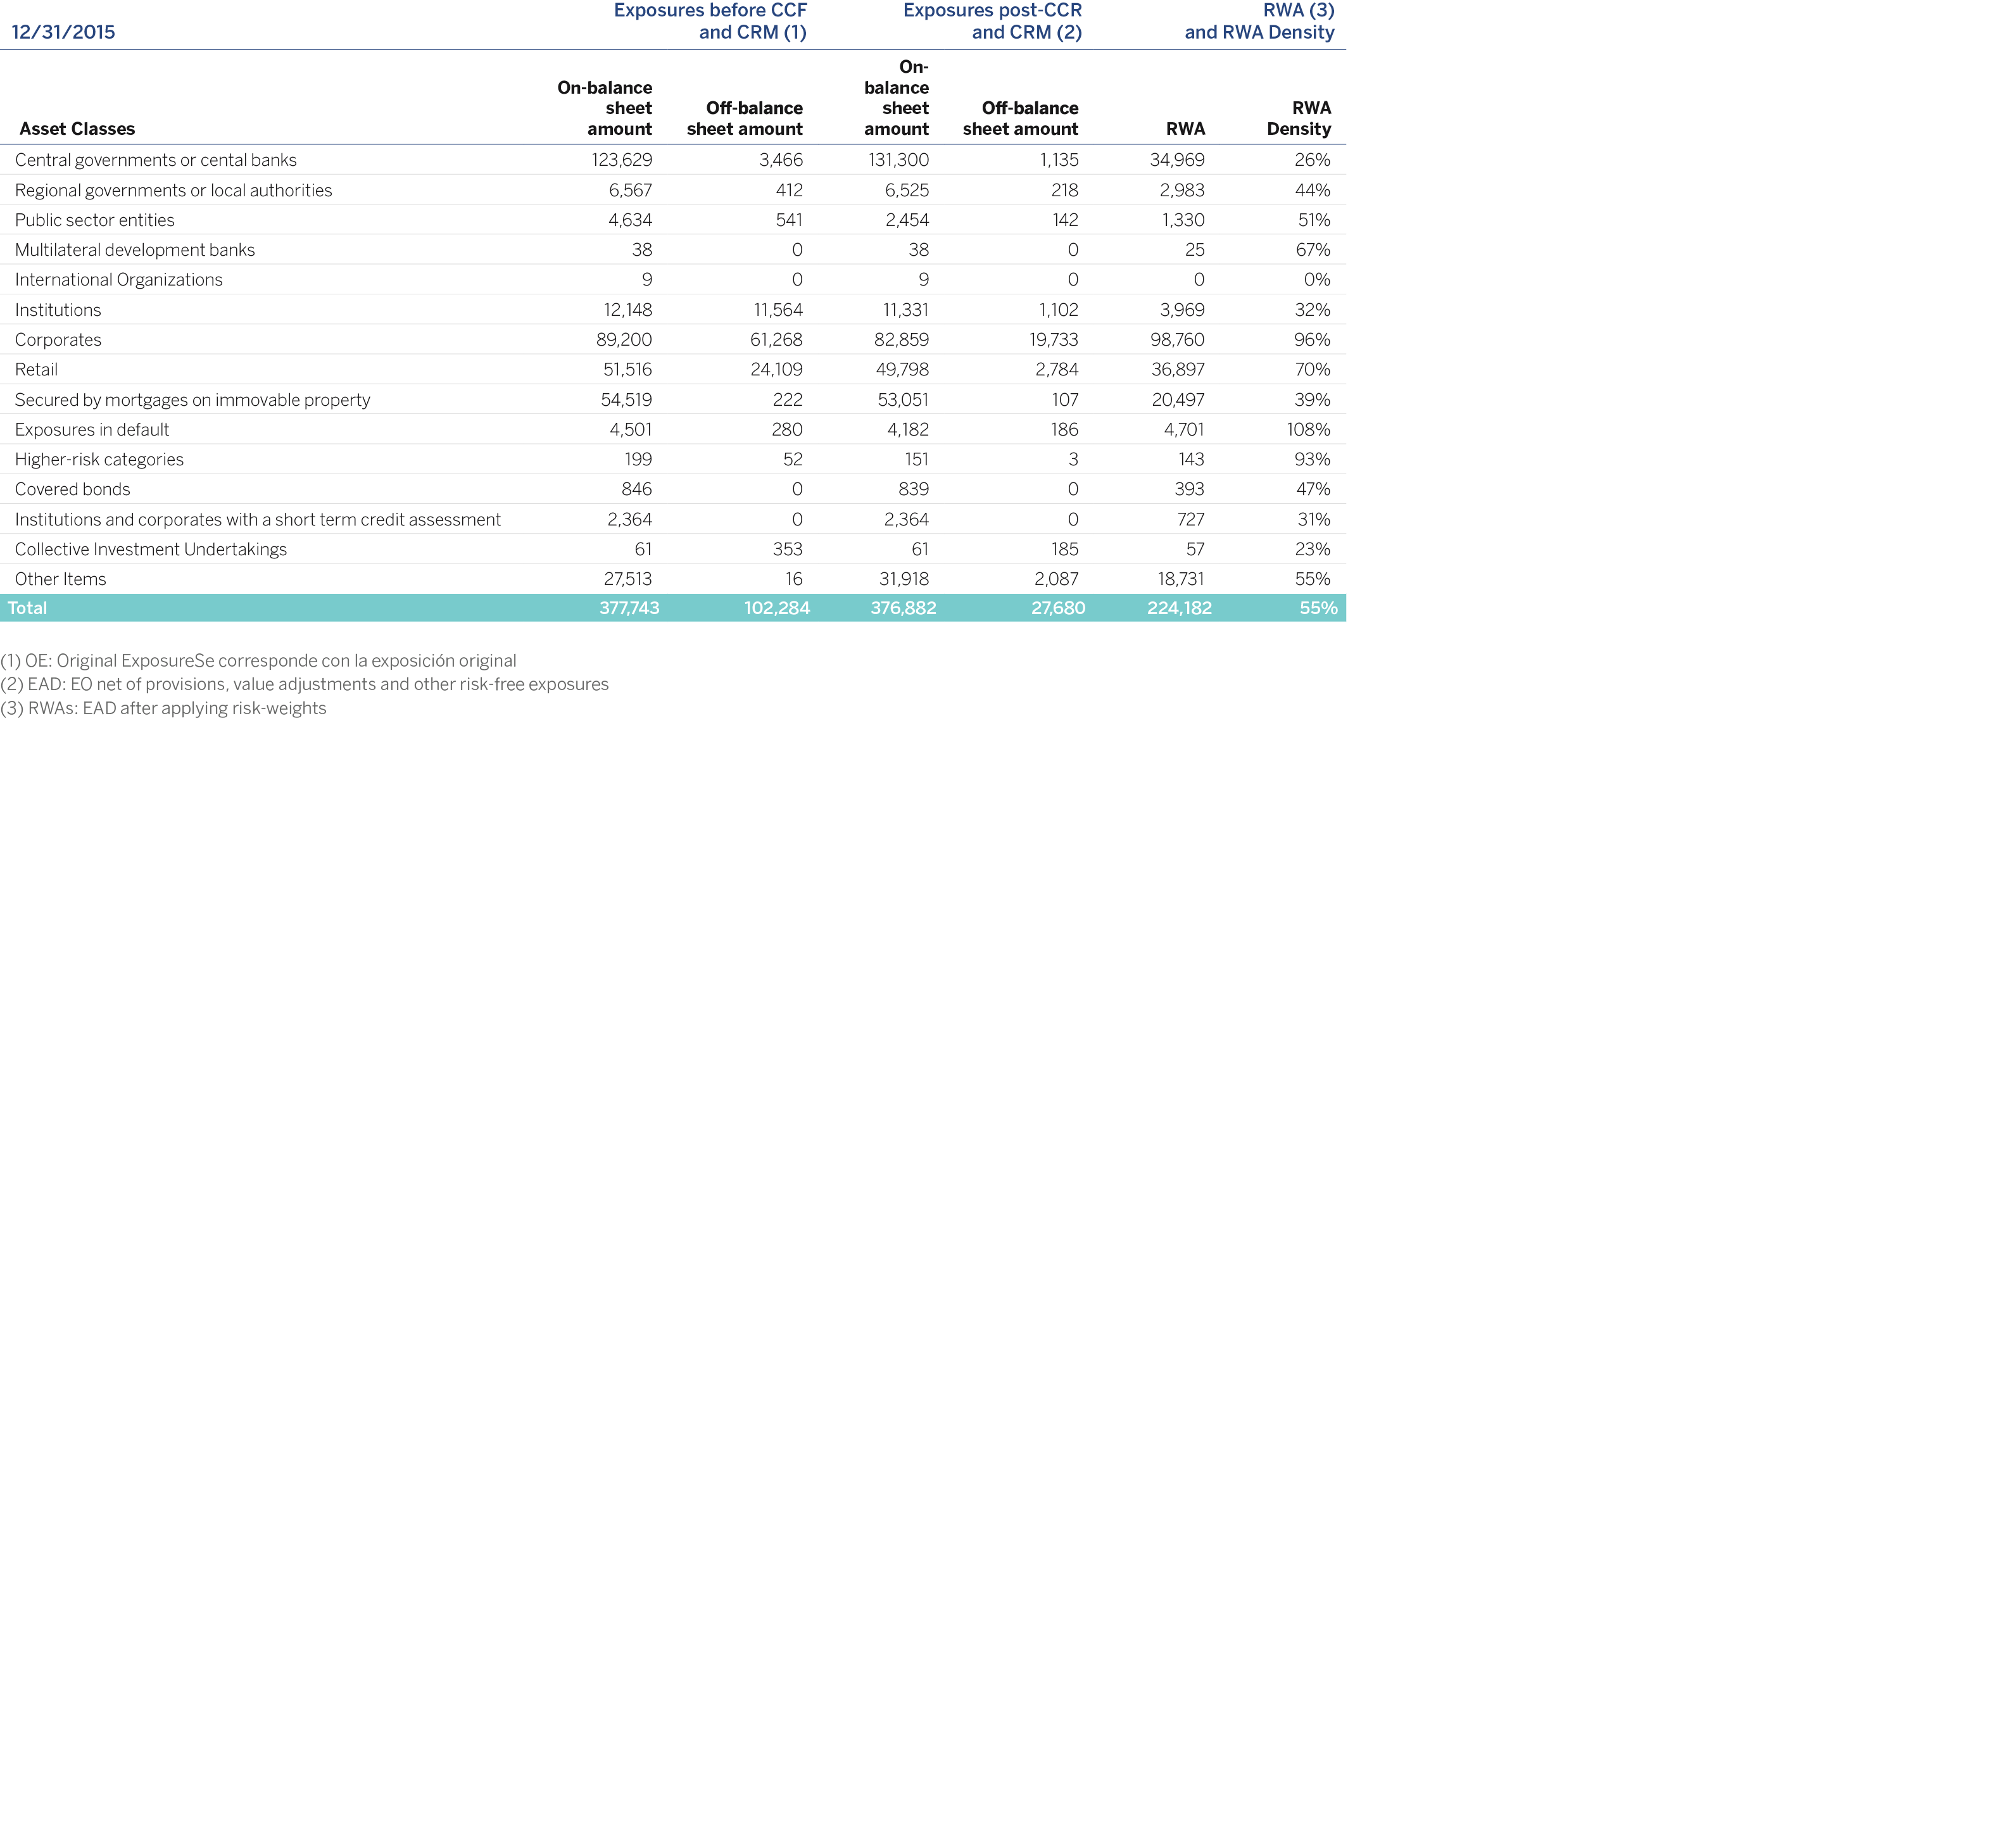
The original net exposure amounts for provisions and value adjustments, the exposure after risk mitigation techniques and RWA density for each exposure category by the standardized approach are shown below, excluding securitization and counterparty credit risk exposure which is presented in section 3.2 of this Report.
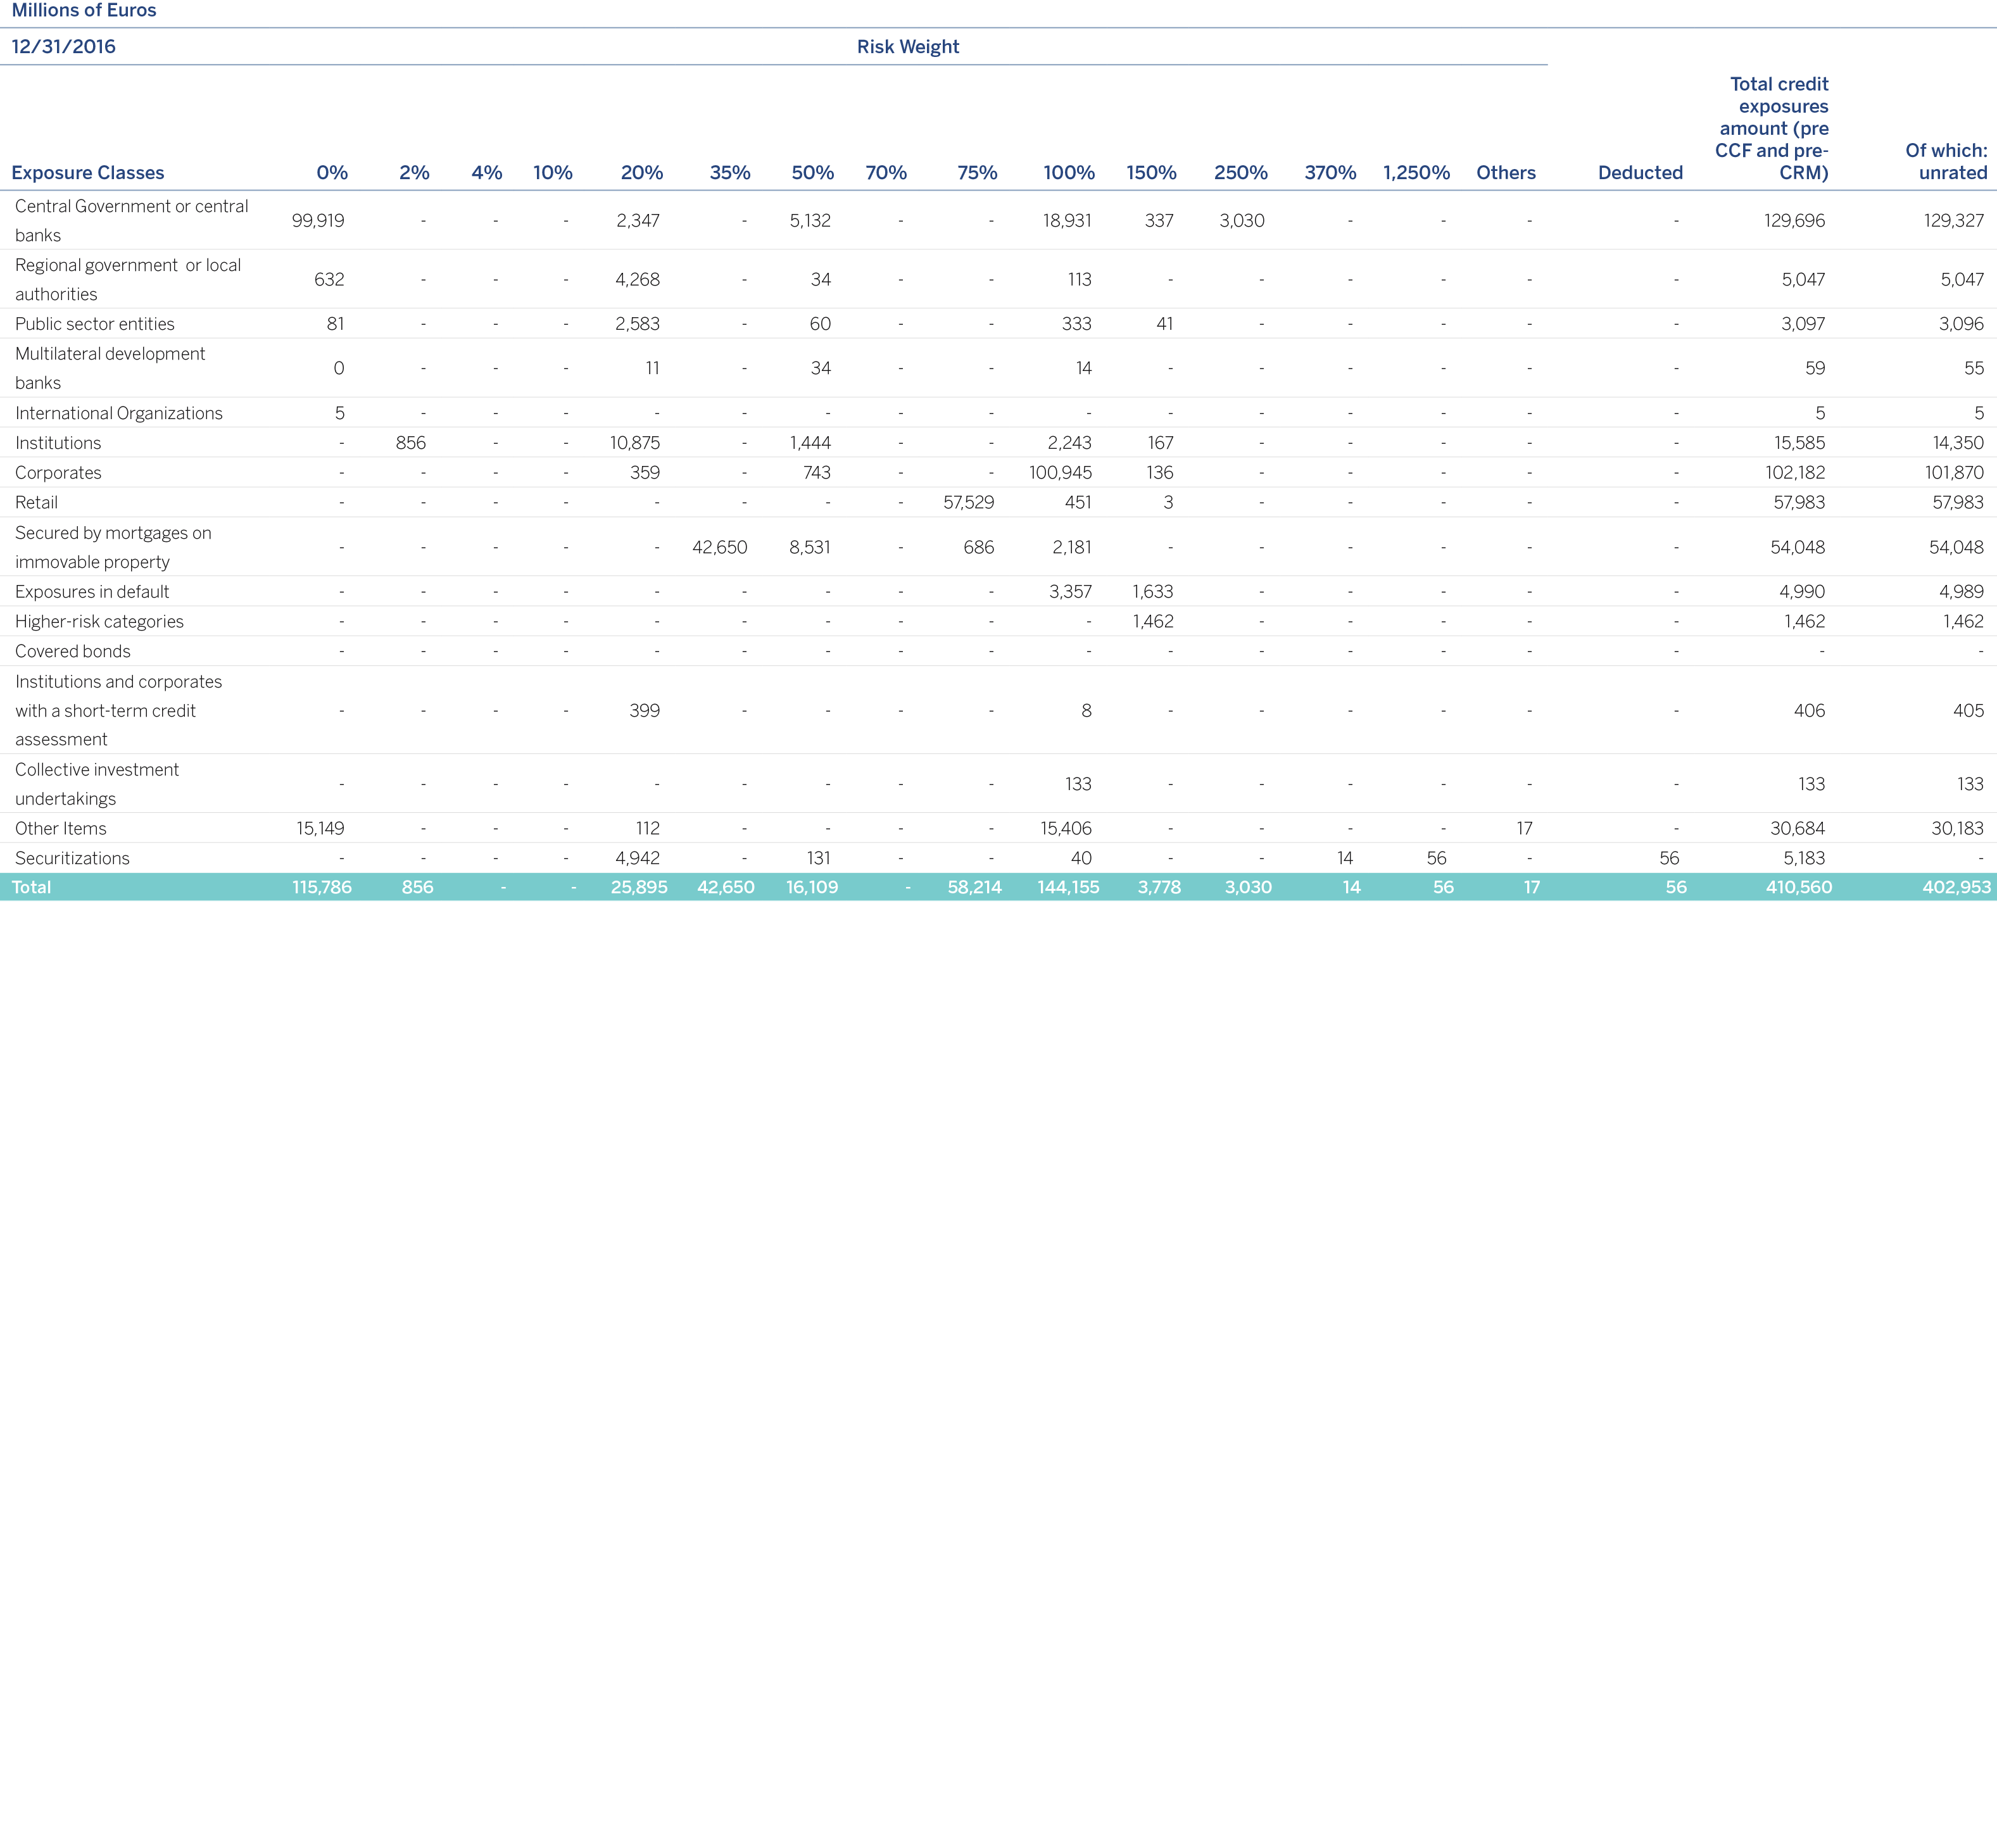
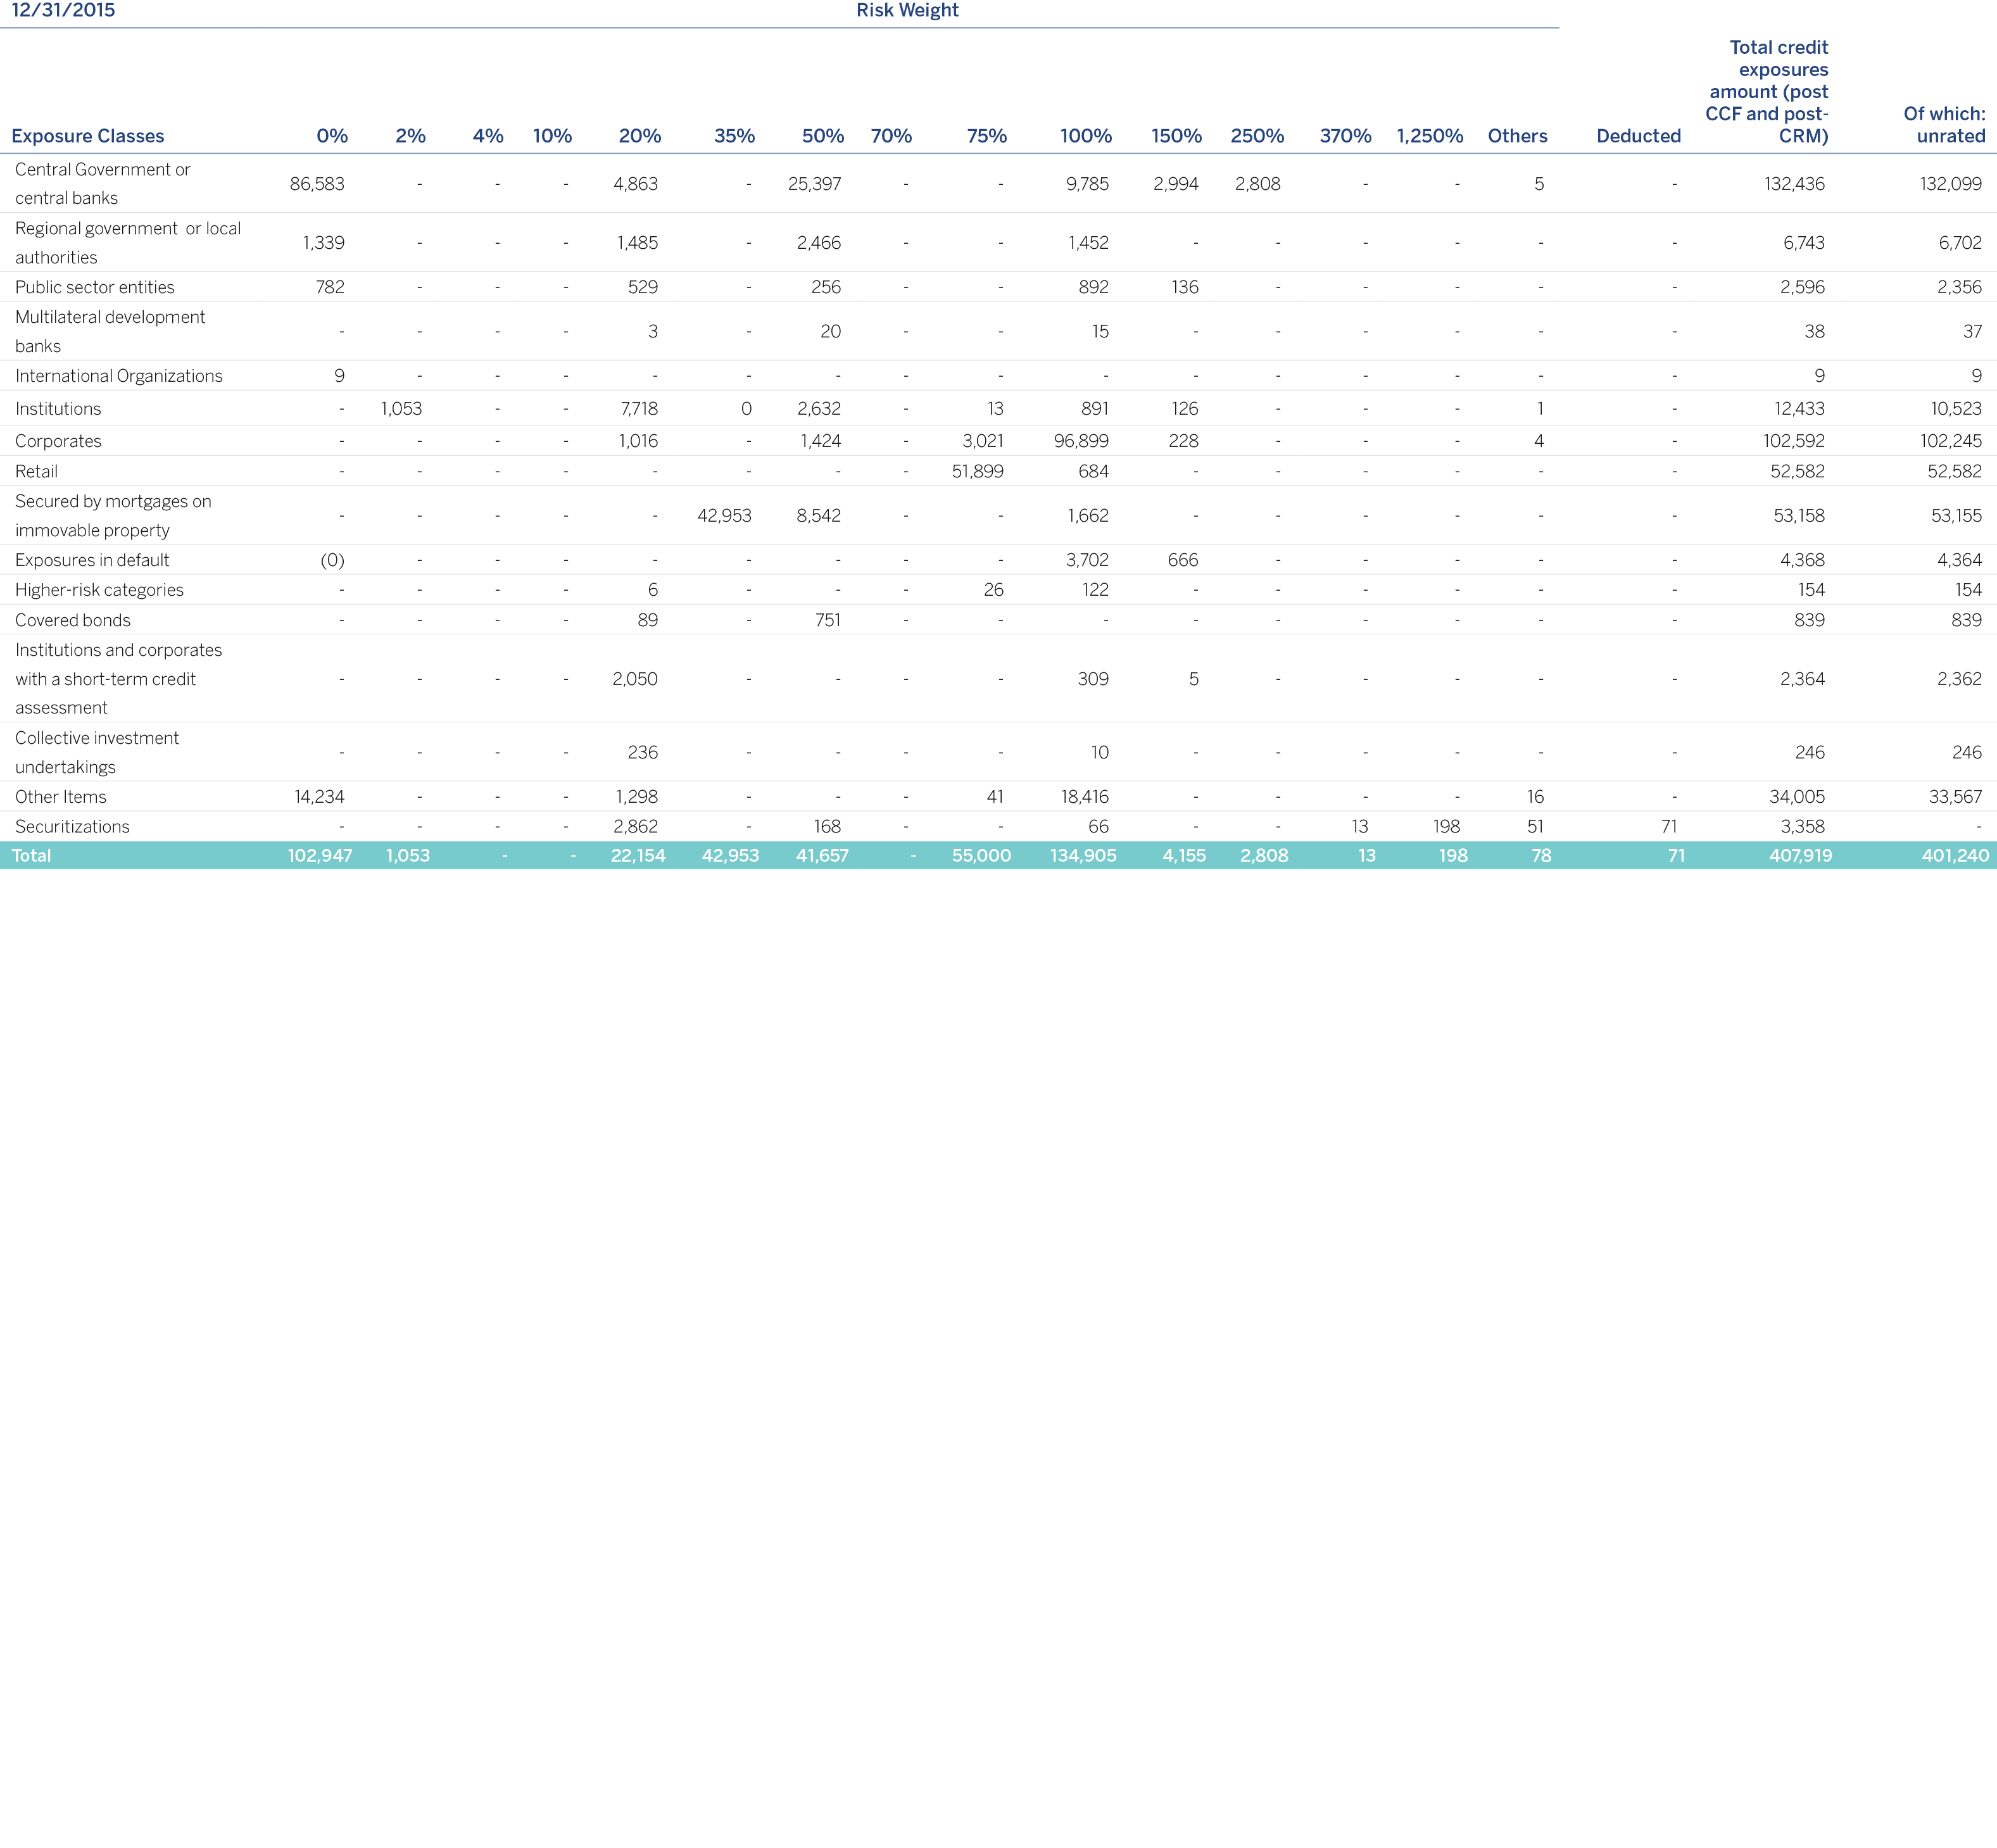
Moreover, the following tables present the amounts of exposures net of provisions, before and after the application of credit risk mitigation techniques by risk weightings and by exposure categories that correspond to the standardized method, not including securitization positions and counterparty credit risk exposure, in accordance with the EBA EU-CR5 (GRPDR) format.
Counterparty credit risk exposures net of provisions and after applying CCF and CRM are shown in table EU-CCR3 of section 3.2.6 of this report.

The following table presents the main variations in the period in terms of RWAs for the Credit Risk standardized approach.
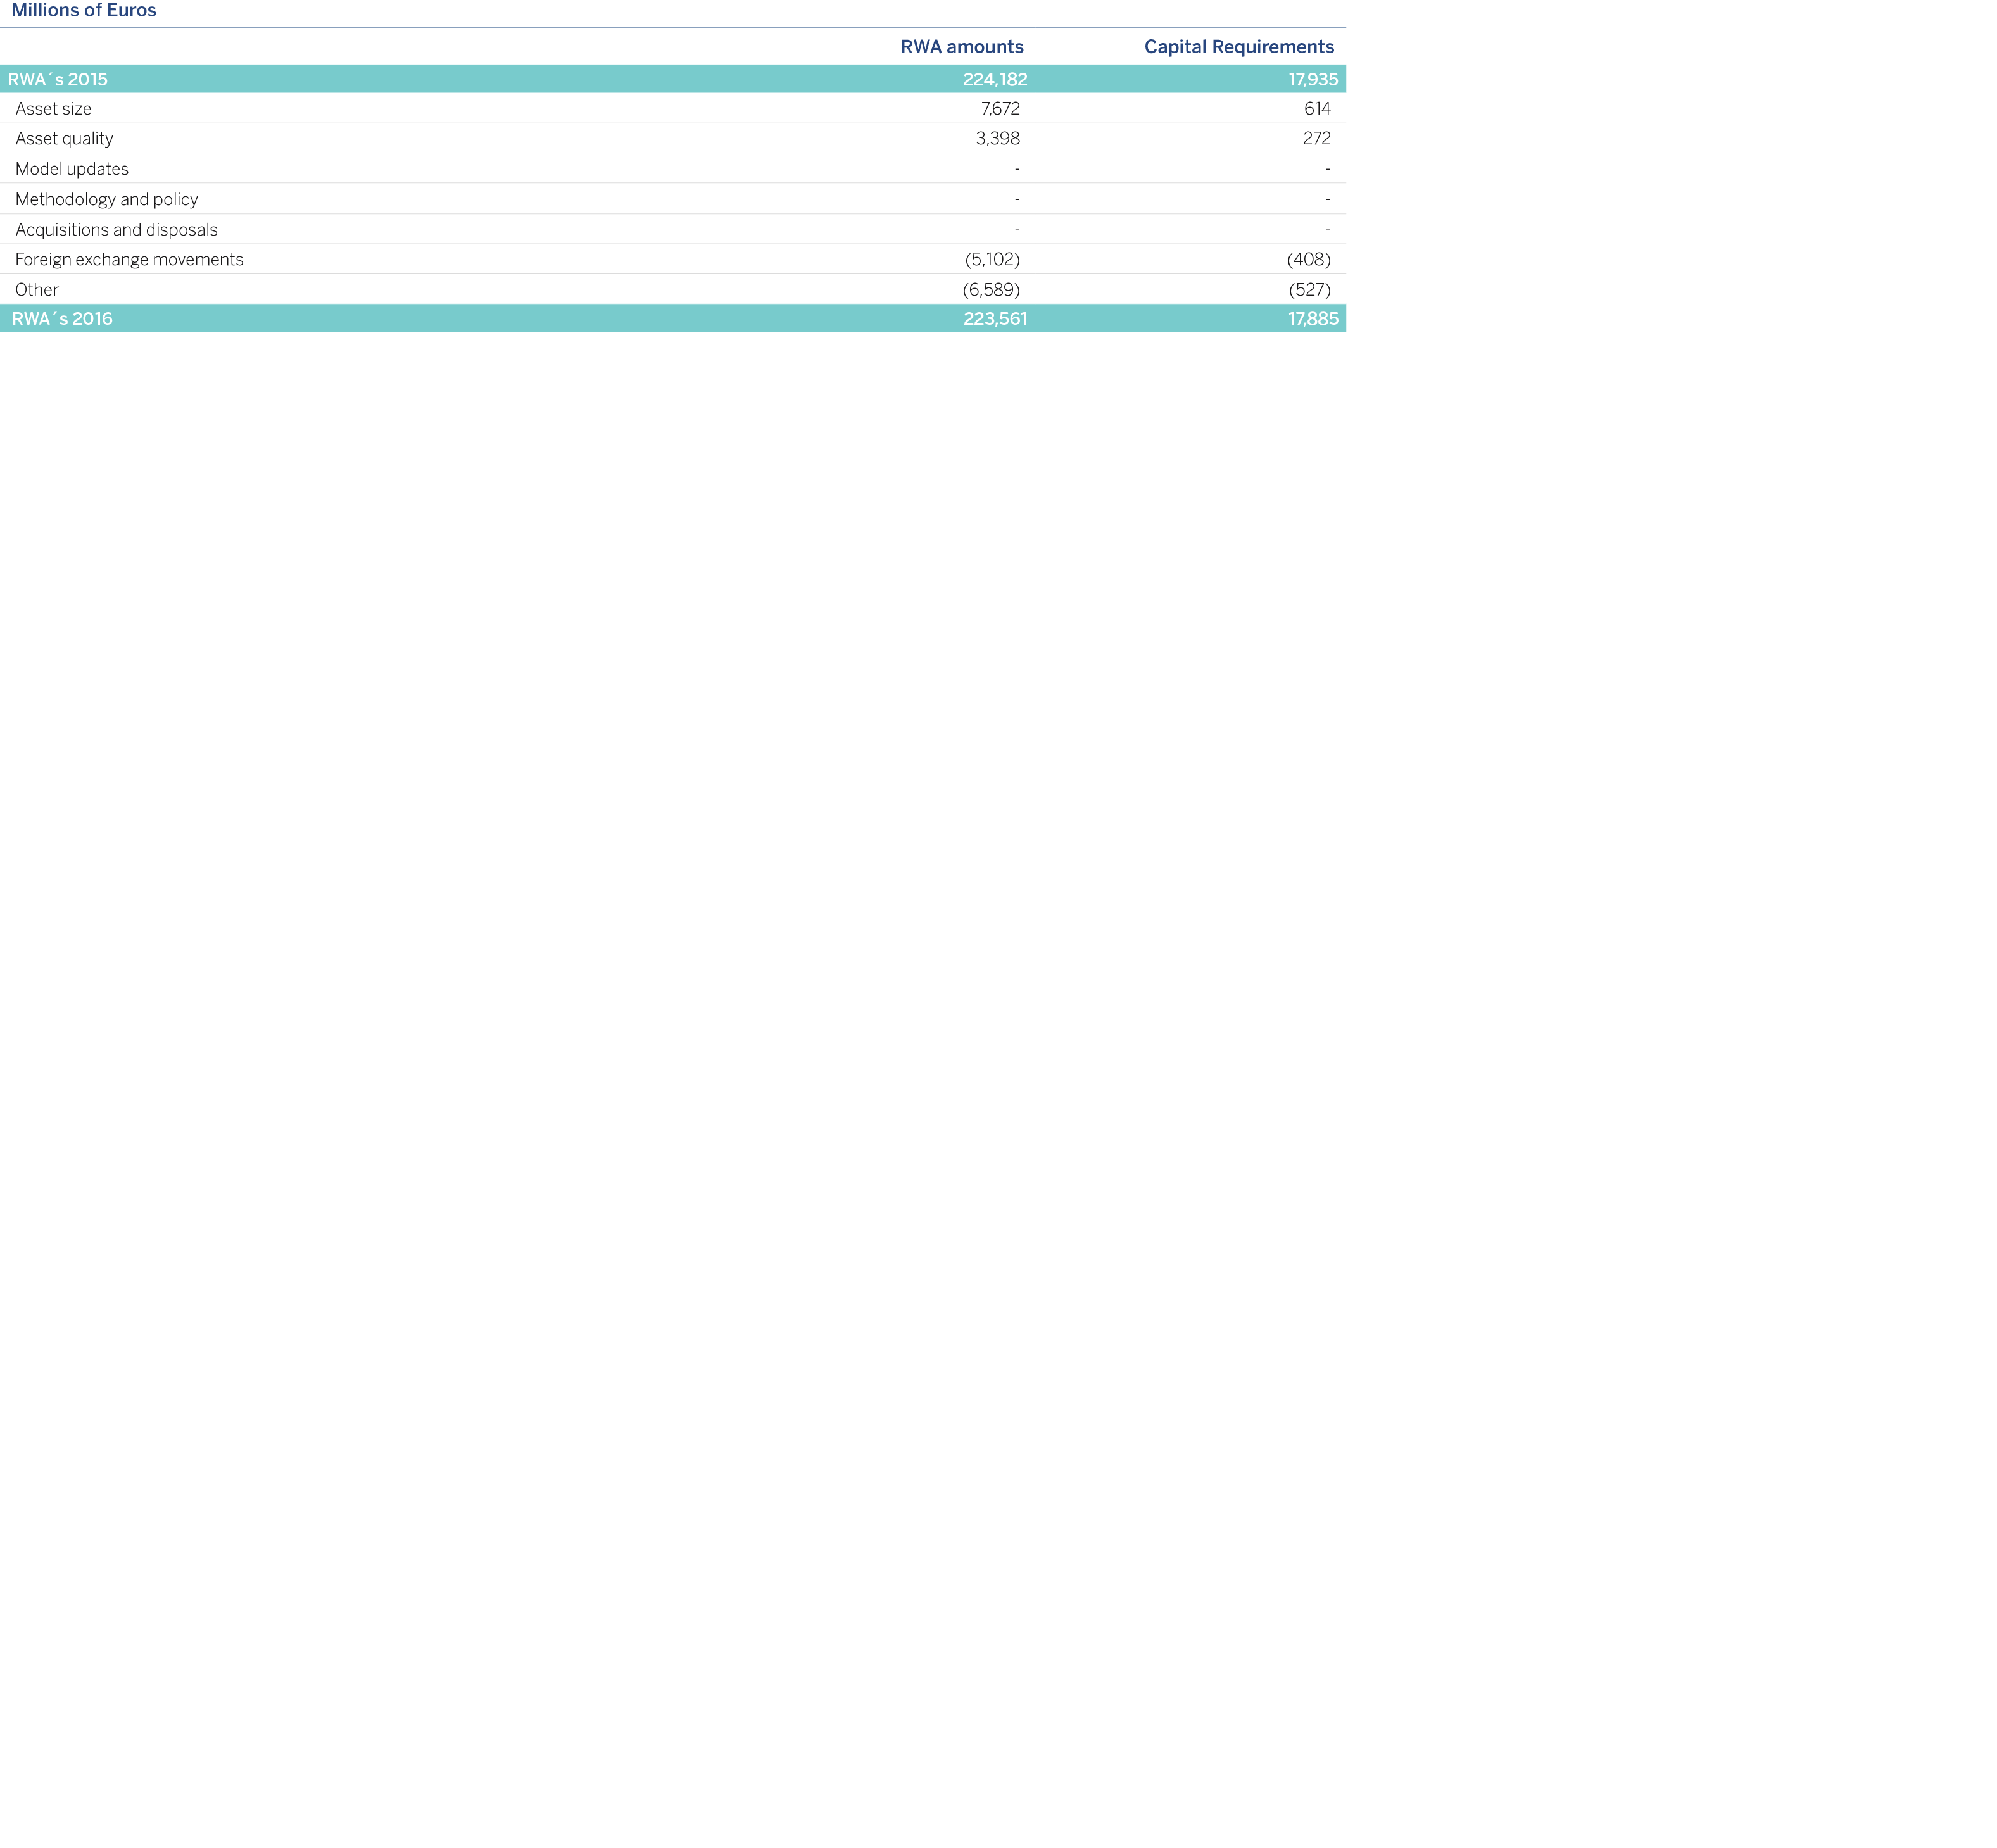
The increase in RWAs for credit risk in the standardized model is due mainly to:
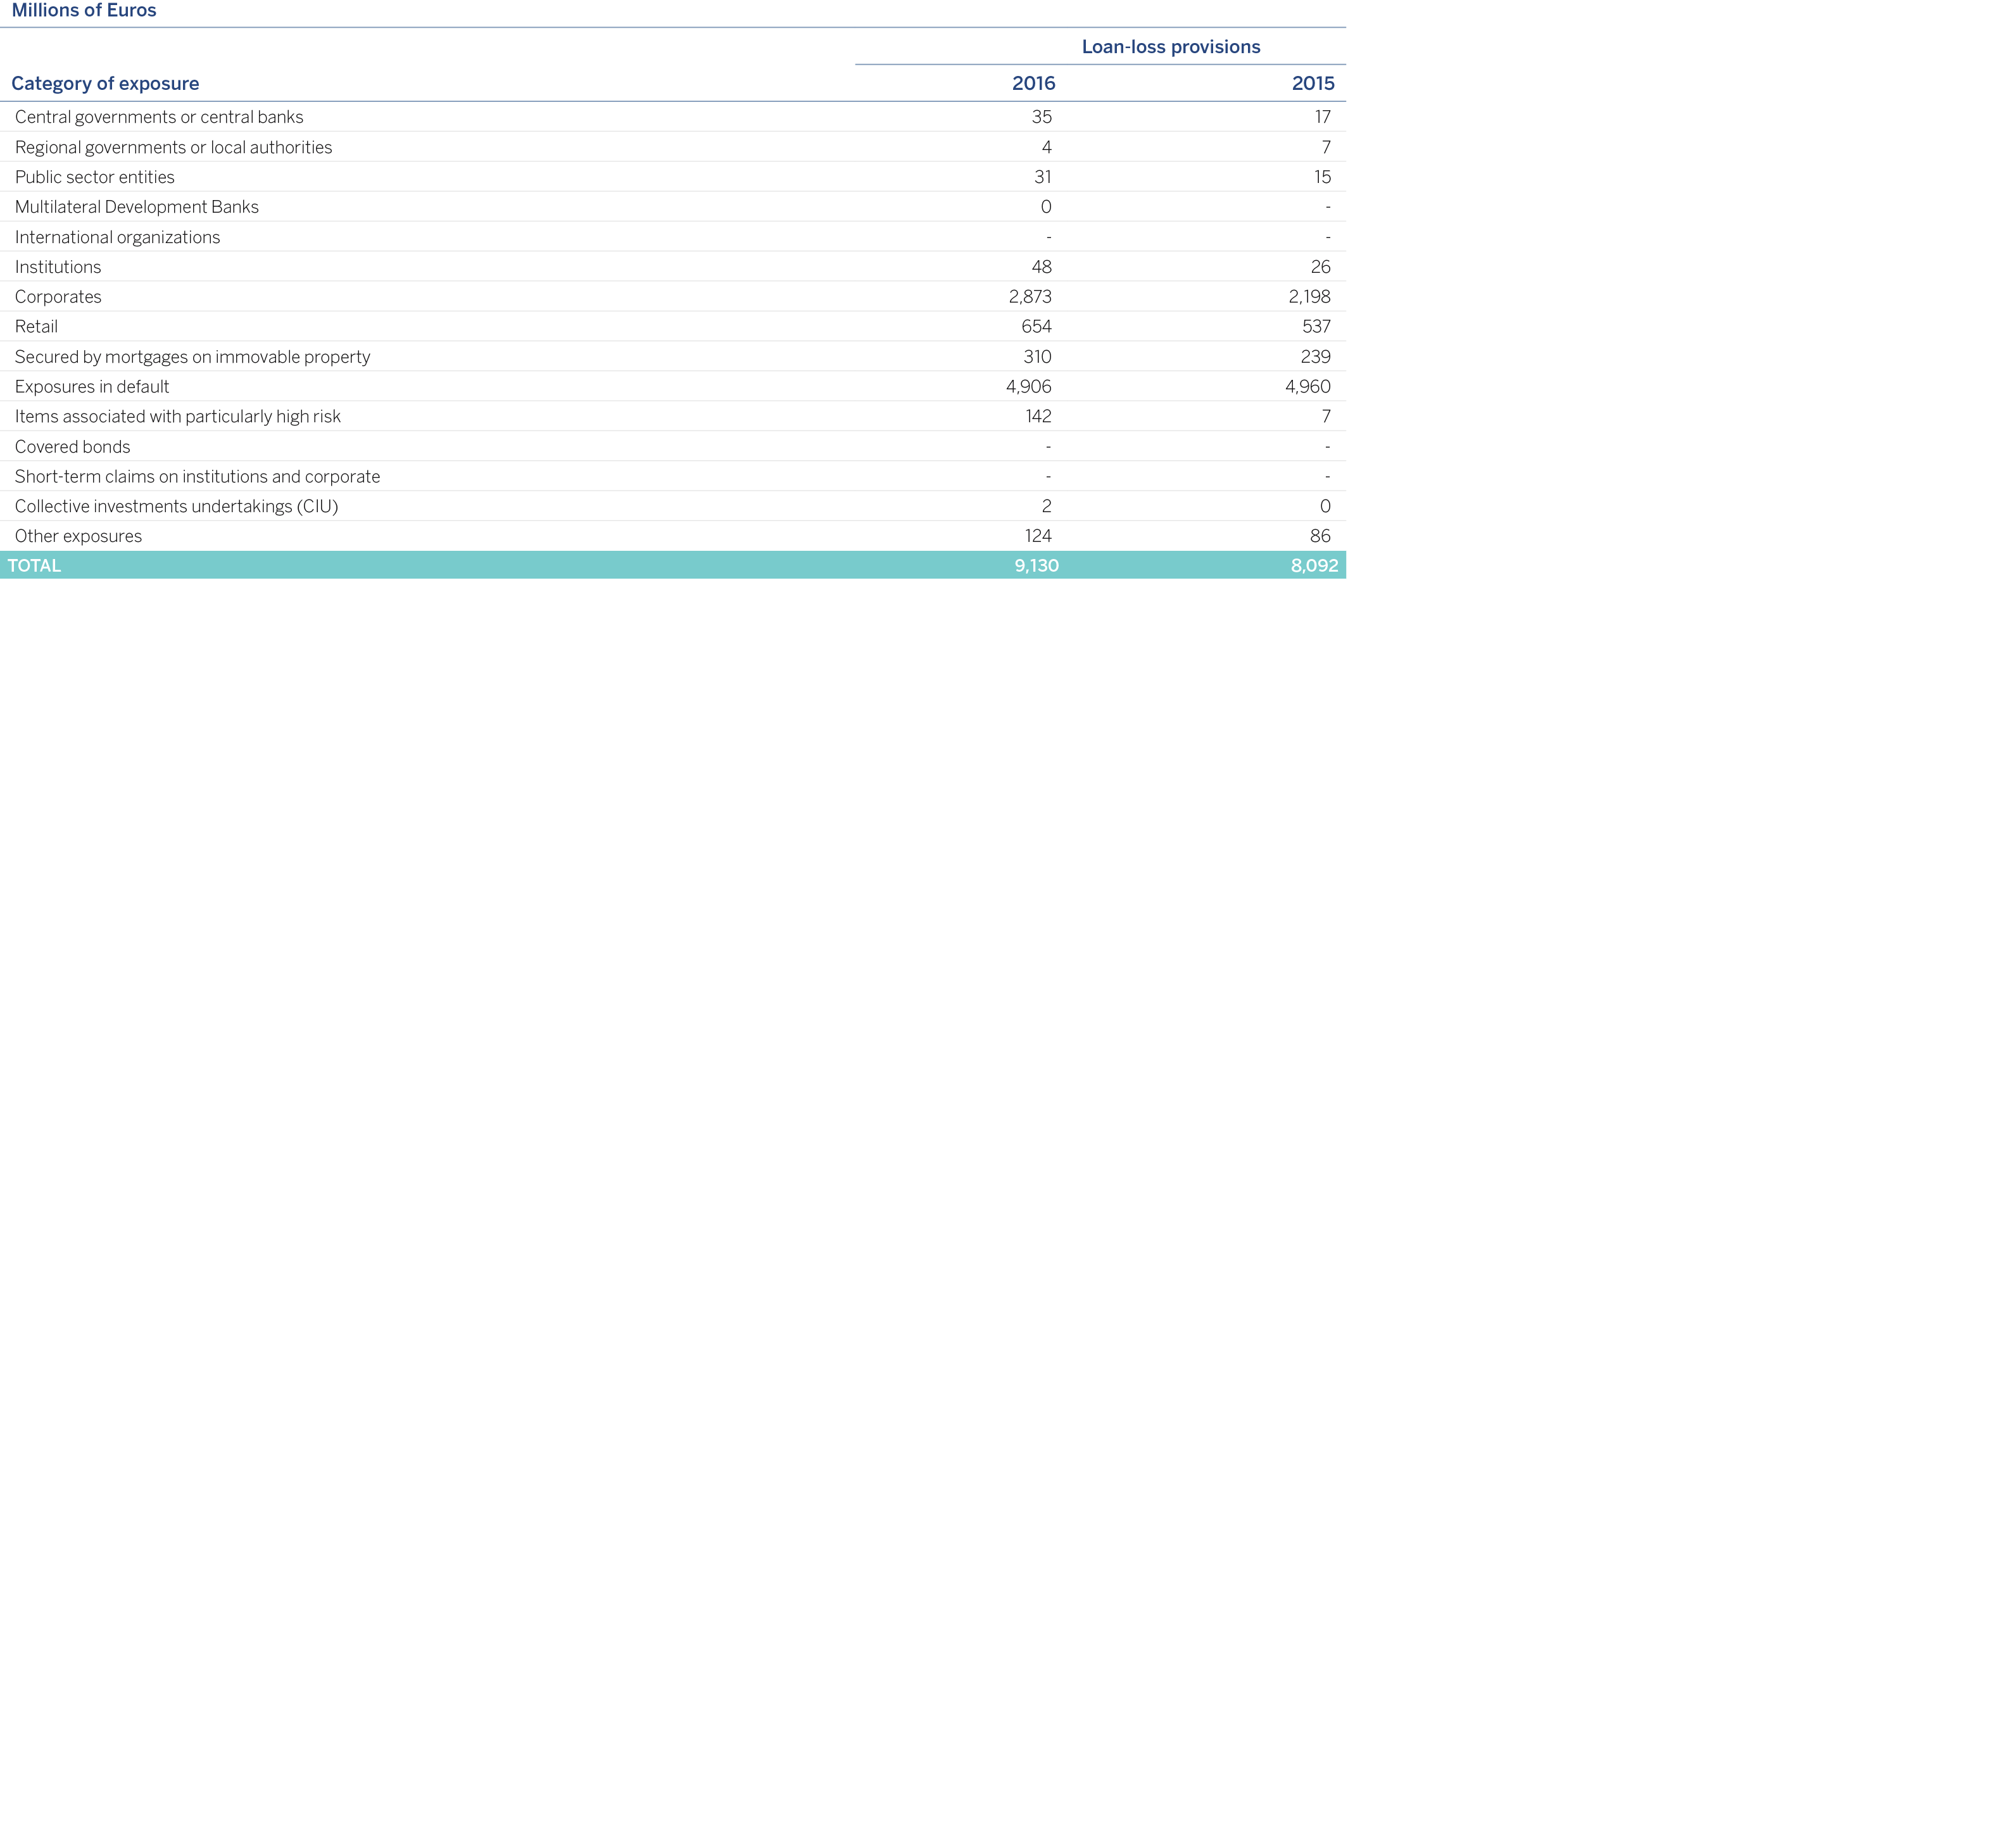
The table below shows the balances of credit risk and counterparty credit risk provisions by exposure categories, as of December 31, 2016 and 2015:
The following is a list of the models authorized by the supervisor to be used on the calculation of capital requirements.
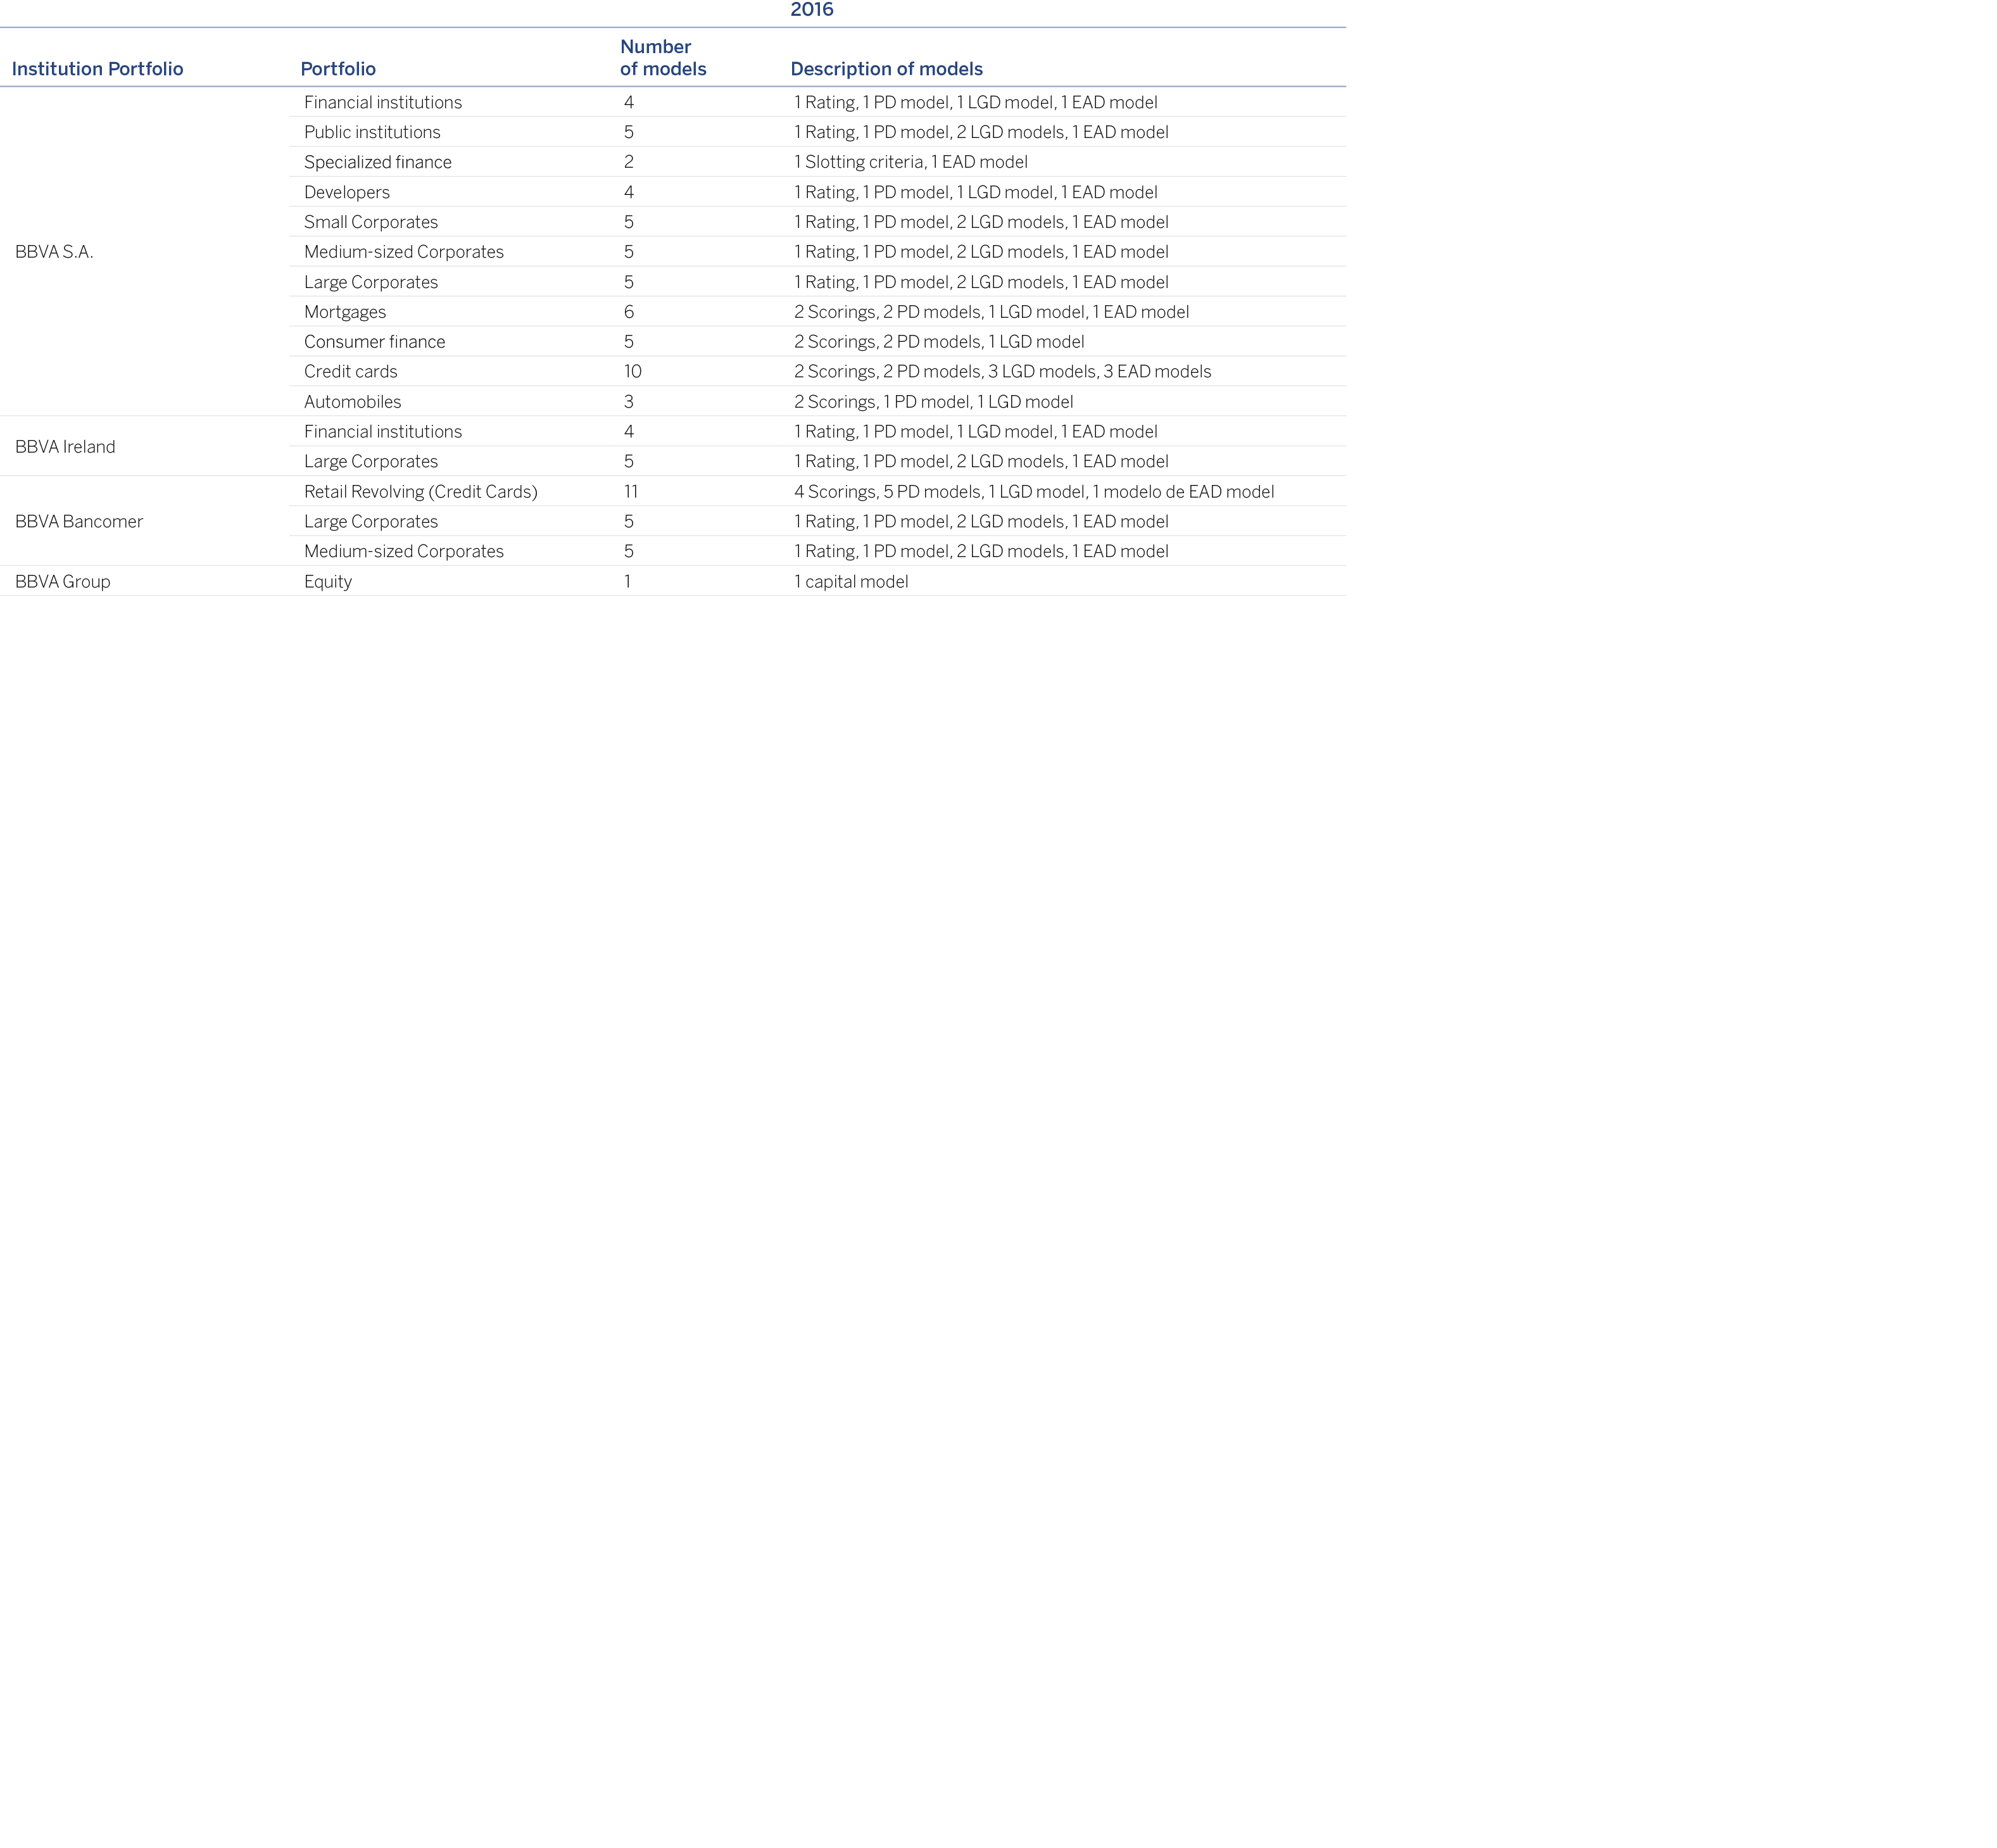
The main types of rating models used in the IRB portfolios are ratings for wholesale portfolios and proactive and reactive scorings in the case of retail portfolios.
The rating models give contracts/customers a score that orders customers according to their credit quality.
This score is determined by the characteristics of the transactions, economic and financial conditions of the customer, information on payment behavior, credit bureau, etc.
Based on this score a probability of default (PD) can be assigned at contract or customer level.
If the data used in these calculations do not cover a complete economic cycle, the additions to NPL and probability of default depend on the phase of the cycle used. As a result, an adjustment has to be made to the cycle to consider this question. It will vary depending on the economic situation and will allow an average PD to be determined over the cycle.
In the case of low default portfolios, the Group uses a variety of techniques to estimate the PDs, such as the use of external default data, or ECAI references.
The method used to estimate the loss given default is the “Workout LGD”, based on the discount of the cash flows of defaulted exposure, recovered at different points of time.
According to the quantitative requirements, to calculate the RWAs a LGD has to be estimated that includes the slowdowns in the economic cycle, called the “DLGD” (the LGD at the bottom of the cycle).
In the case of low default portfolios the Group uses a variety of techniques to estimate the LGDs, such as the use of LGD data from external studies or empirical estimates, either of groupings of low default portfolios (“LDPs”), or extrapolations of non-LDP portfolios.
Finally, the conversion factors or CCF are defined as the percentage of the undrawn balance that is expected to be used before the default. It tends to be estimated under a cohort approach based on the historically observed defaults.
A cohort is a 12-month window that has a reference date (close of each month) and contains all the non-performing transactions whose default date is within the cohort. All the transactions will need a contracting date before the reference date. A CCF is calculated in each cohort considering all the defaults included in it.
The approval of the models by the supervisor includes both own estimations of the probability of default (PD), loss given default (LGD) and the internal estimation of credit conversion factors (CCFs).
The Group maintains its calendar established for receiving approval for additional Advanced Internal Models in different risk classes and geographical areas.
The Group has rating tools for each one of the exposure categories listed in the Basel Accord.
The retail portfolio has scoring tools for determining the credit quality of transactions on the basis of information on the transaction itself and on the customer. The scoring models are algorithms estimated using statistical methods that score each transaction. This score reflects the transaction’s level of risk and is in direct relation to its probability of default (PD).
These decision models are the basic tool for deciding who should receive a loan and the amount to be granted, thereby contributing to both the arrangement and management of retail type loans.
For the wholesale portfolio, the Group has rating tools that, as opposed to scorings, do not assess transactions but rather, customers. The Group has different tools for rating the various customer segments: small companies, corporates, government and other government agencies, etc. In those wholesale portfolios where the number of defaults is very low (sovereign risks, corporates, financial institutions) the internal information is supplemented by the benchmarks of external rating agencies.
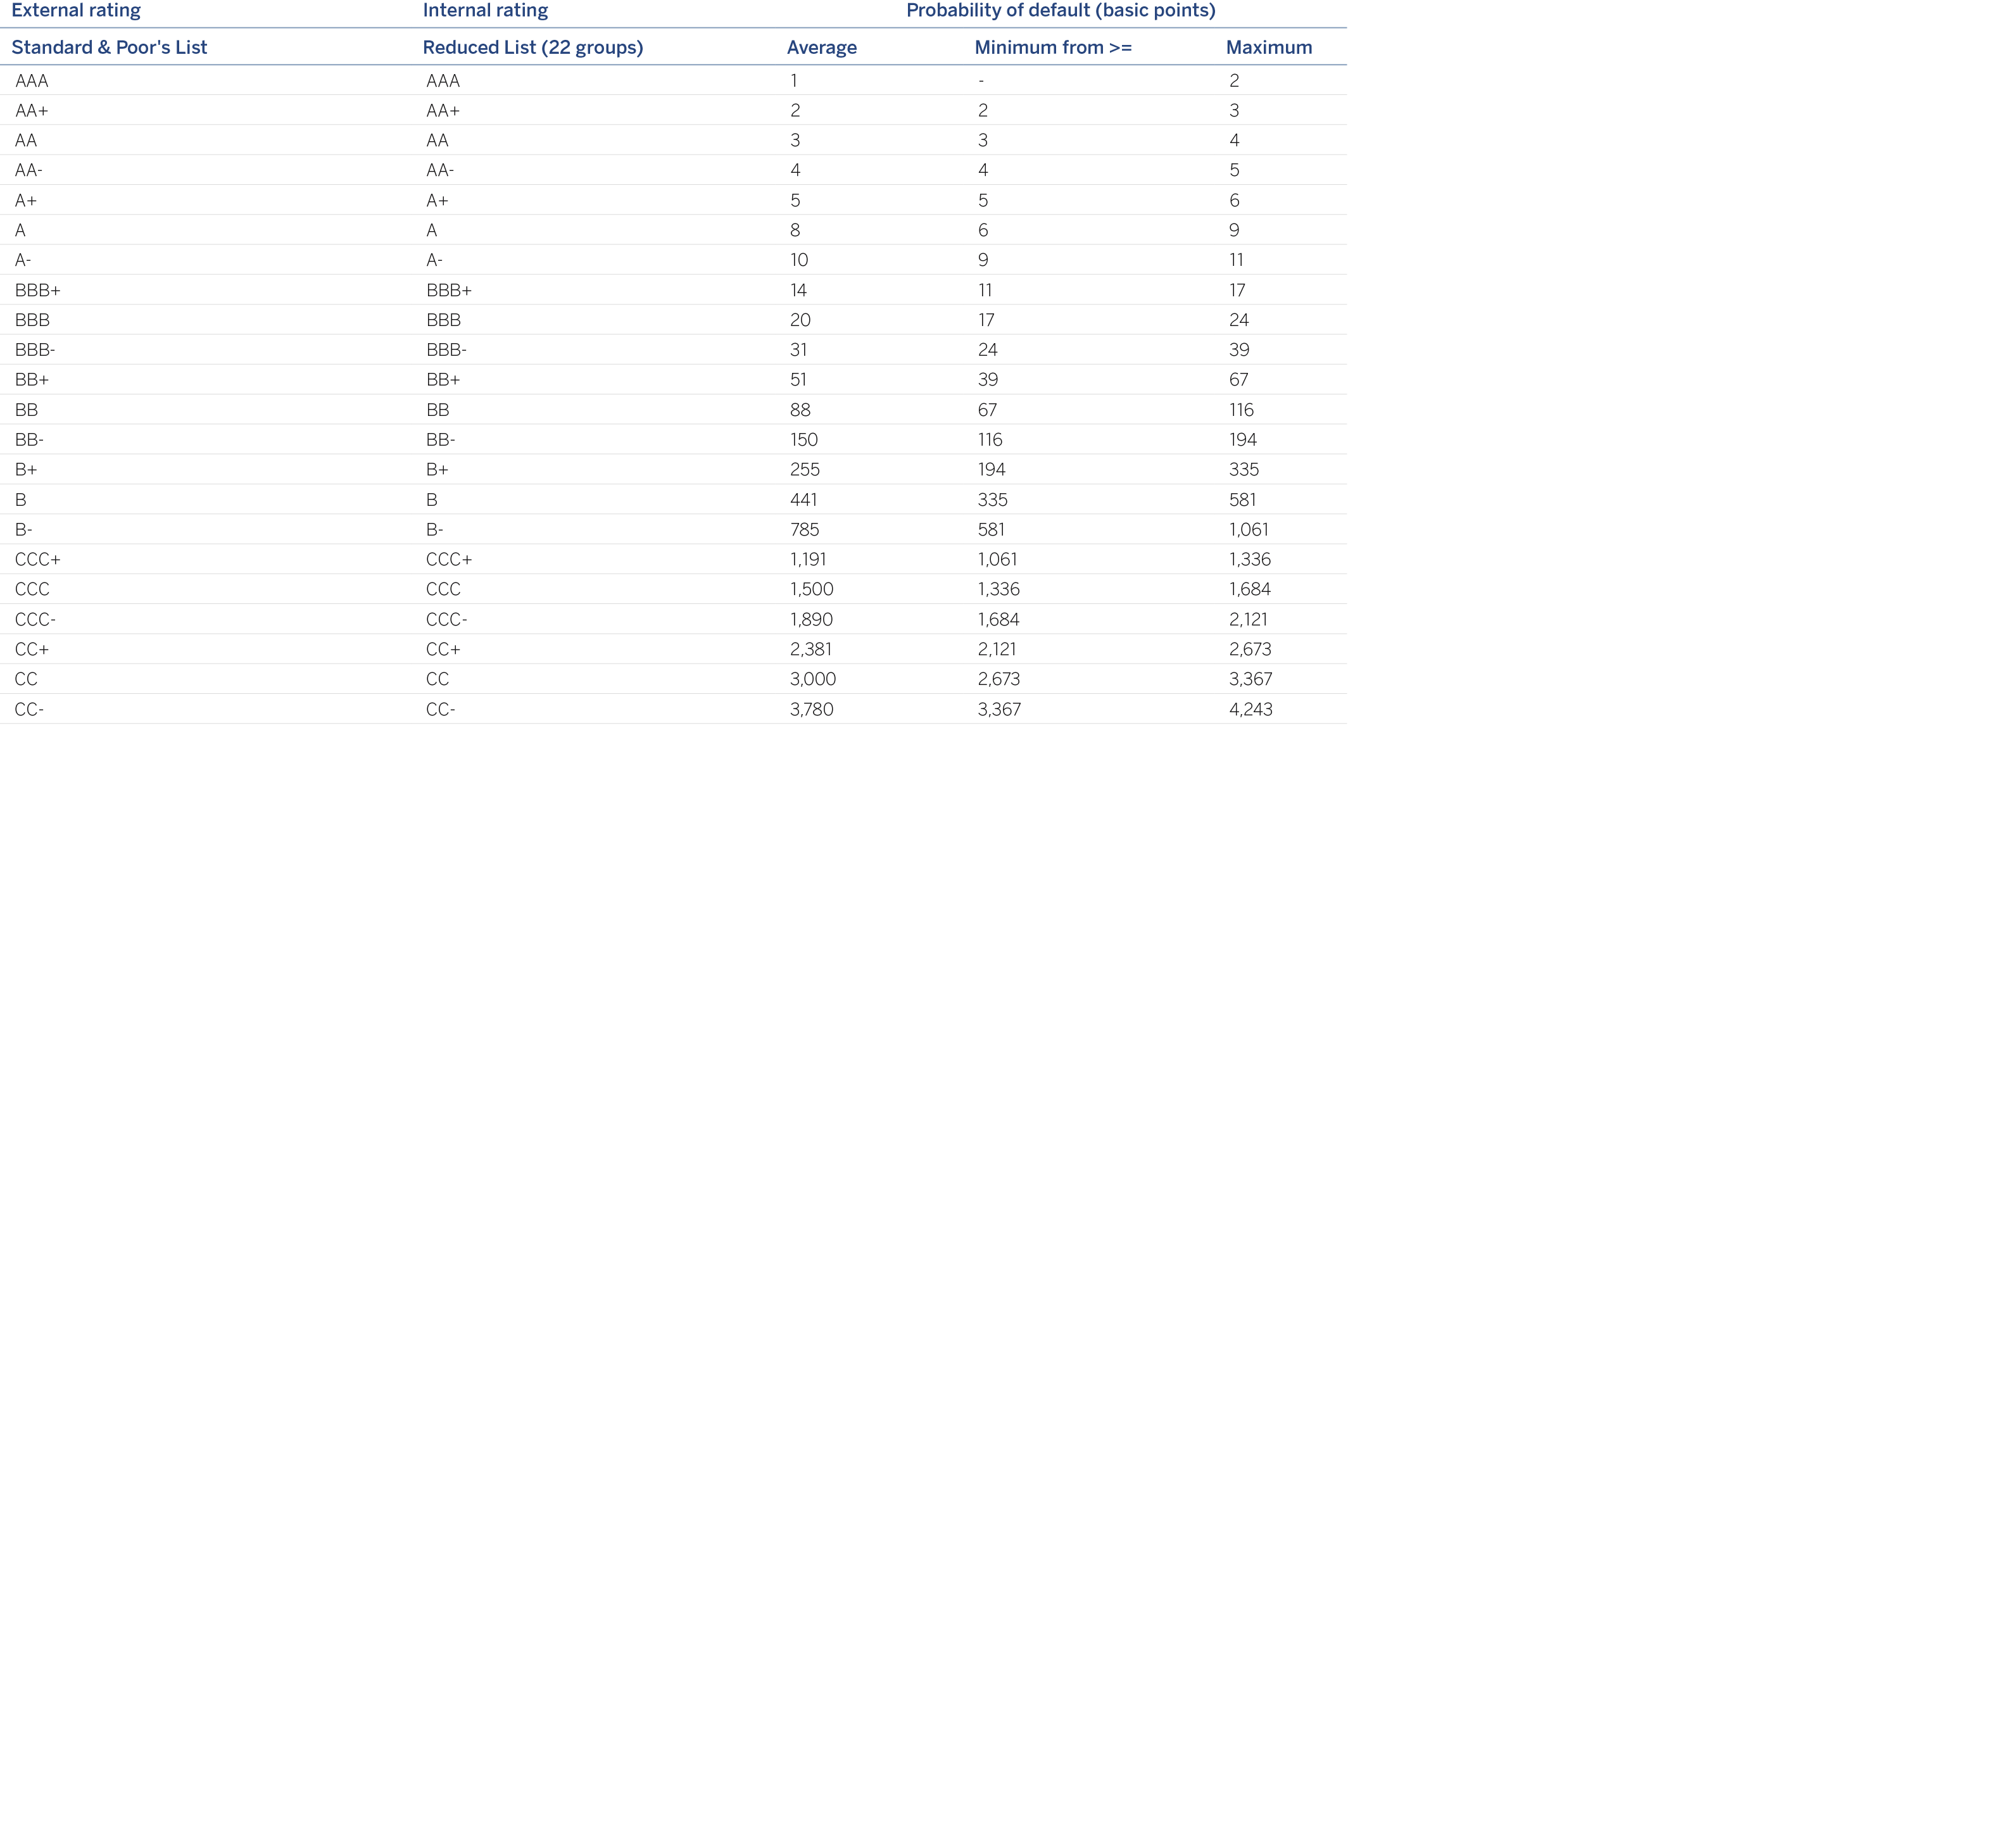
The PD estimates made by the Group are transferred to the Master Scale, enabling a comparison to be made with the scales used by external agencies. This is shown below.
The Group’s internal estimations are a vital component of management based on value creation, giving rise to criteria for assessing the risk-return trade-off.
These measures have a broad range of uses, from the adoption of strategic business decisions through to the individual admission of transactions.
Specifically, internal estimates are used in everyday business in support of credit risk management through their inclusion in admission and monitoring processes, as well as in the pricing of transactions.
The management use of performance metrics that consider expected loss, economic capital and risk-adjusted return enables the monitoring of portfolios and the assessment of non-performing positions, among others.
Mitigation is an iterative process whose purpose is to recognize the benefits of the existence of collateral and guarantees, ordering them from the highest to the lowest credit quality.
The Group uses risk mitigation techniques for exposures pertaining to the wholesale portfolio by replacing the obligor’s PD with that of the guarantor, in those cases in which the latter is eligible and their PD is lower than the obligor’s. Regarding processes of retail admission, the scoring contains the effect of the guarantor, and the recovery flows that are forthcoming throughout the cycle reflect the recoveries related to the guarantees associated with the contracts. This means that the effect of the guarantees is taken into account in the actual estimation of the loss given default for retail portfolios.
The entity carries out the control and monitoring of the rating systems and metrics for risk management for private individuals, SMEs and the self-employed, corporates and institutions. The activities are carried out, within certain analytical and qualitative fields, by carrying out periodic 360º monitoring of all impacts of the tools as well as their internal function in terms of efficiency and effectiveness.
Global understanding of the systems allows action plans to be established, with a follow-up to ensure their proper execution. The weaknesses of the rating tools are thus identified and managed. The monitoring function is the main driving force of new developments and evolving maintenance, which allow the business interests of the entity to be aligned with regulatory requirements and management needs within a framework of analytical, technical and technological capacities.
In general, there is a series of corporate management programs that establish the main lines and minimum contents determining the management and/or supervision of the different credit risk models, as well as defining the metrics for their correct control.
More specifically, these corporate management programs will be adjusted to each of the rating tools of a business area within a time horizon adapted to the nature of the tool.
Periodically, an overall monitoring and review of compliance with the thresholds agreed under the management program will be carried out to detect situations that could potentially require an adjustment to the models and/or credit policies and to take early corrective actions to minimize the impact of such situations.
Analysis, in the methodological sphere, is defined as the monitoring of the predictive capabilities of the models, backtesting calibration of the parameters, proper granularity and concentration, sample stability of input, as well as traceability, integrity and consistency.
The use of rating systems by the different areas is overseen from the context of integration in management. This context defines parameter sensitivity tests, stress-tests of estimates, proper use of the parameters in the portfolio management to facilitate decision-making, control of exposure without rating, risk policies and the framework for delegating tasks, structures of decision-making committees, implementation risk evaluation, proper technological environment, evaluation of the inclusion of the parameters in corporate applications, proper follow-up of the training of users to guarantee its proper implementation and full comprehension, follow-up of the correct structure and quality of documentation, as well as all other activities that ensure the proper use of management metrics.
Apart from the corporate management programs mentioned above, access to the internal rating systems is based on IT system-authorized profiles that ensure only the customer loan management supervisors can see the scoring and rating.
Control of the capital process is performed by risk units that are independent of the units that calculate the scoring and rating and which, therefore, are users of the internal rating system. These control mechanisms are established at different levels of the process, such as at input, execution and final outputs, and involve both the integrity of the data and their accuracy and correctness.
There follows a description of the internal classification processes according to each customer category:
Central banks and central governments: For this segment, the assignment of ratings is made by the Risk units appointed for this purpose, which periodically analyze this type of customers, rating them according to the parameters included in the corresponding rating model. There are 3 different methods currently in use for assigning country ratings: (i) ratings from external agencies, used for developed nations, emerging countries with elevated incomes and emerging countries where the Group has little risk, (ii) internal rating based on a proprietary tool used for emerging countries where the Group has an appreciable risk, and lastly (iii) the country risk ratings published by the Belgian export credit agency (which manages the quantitative model used by the OECD to assign its country risk ratings) for countries of marginal importance for the Group that have no external qualifications. Sovereign ratings are generated in local and foreign currency for all the tools, as well as a transfer rating, which evaluates the risk of inconvertibility/transfer restrictions.
In the case of emerging countries with presence of BBVA subsidiaries or branches, the rating in local currency is adjusted to that obtained by the emerging countries’ tool under the authorization of the Risk Committee assigned for this purpose.
Institutions: The rating of Public Institutions is generally provided by the risk units responsible for their approval, on a yearly basis, coinciding with the review of customer risk or with the reporting of their accounts.
In the case of Financial Institutions, the Risk unit responsible makes a regular assessment of this type of customer, continuously monitoring their evolution on domestic and international markets. External ratings are a key factor in assigning ratings for financial institutions.
Large Companies: Includes the rating of exposures with corporate business groups. The result is affected both by indicators of business risk (evaluation of the competitive environment, business positioning, regulation, etc.) and financial risk indicators (size of the group by sales, cash generation, levels of debt, financial flexibility, etc.).
In accordance with the characteristics of the large companies segment, the rating model is global in nature with specific algorithms by sector of activity and geographical adaptations. The rating of these customers is generally calculated within the framework of the annual risk review process, or the admission of new operations.
The responsibility for the assessment lies with the units originating the risk, while those approving it validate it when the decision is taken.
Medium-sized companies: This segment also takes into account quantitative factors derived from economic and financial information, and qualitative factors that are related to the age of the company, the sector, management quality, etc. and alert factors derived from risk monitoring.
As in the Corporate segment, the rating tends to run parallel to the admission process, so the responsibility for rating lies with the unit proposing the risk, while the decisionmaking level is in charge of validating it.
Small Businesses: As in the case of medium-sized companies, this segment also takes into account quantitative factors derived from economic and financial information, and qualitative factors that are related to the age of the company, the sector, management quality, etc. and alert factors derived from risk monitoring. Similarly, the rating tends run parallel with the admission process, so the responsibility for rating is with the unit proposing the risk, while the decision-making level is in charge of validating it.
Specialist Lending: For classifying this segment, the Group has chosen to apply the supervisory slotting criteria approach, as included in the Basel Accord of June 2004 and in the Solvency Regulations (CRR article 153.5).
Developers: The rating of real-estate developers allows the rating of both the customers who are developers and the individual real-estate projects. Its use makes it easier to monitor and rate projects during their execution phase, as well as enriching the admission processes.
BBVA Bancomer companies: This segment also takes into account quantitative factors derived from economic and financial information and bureau information, as well as qualitative factors related to the age of the company, the sector, the quality of its management, etc. The rating tends to run parallel to the admission process, so that responsibility for the rating is with the unit originating the risk, while the decisionmaking body validates it.
In general in the wholesale area, the rating of customers is not limited to admission, as the ratings are updated according to new information available at any time (economic and financial data, changes in the company, external factors, etc.)
Retail: This has been broken down into each one of the exposure categories referred to by the correlations provided for in the sections defined in the Solvency Regulations.
One of the most important processes in which scoring is fully integrated at the highest level and in all decision-making areas is the Group’s process for approving retail transactions. Scoring is an important factor for the analysis and resolution of transactions and it is a mandatory requirement to include it in decision-making on risk in those segments for which it has been designed. In the process of marketing and approving retail transactions, the manager is responsible for marketing management, the credit quality and the profitability, in other words, the customer’s comprehensive management, attending to the processes of admission, monitoring and control.
The rating process is as follows for each specific category of retail exposure:
Mortgages, consumer finance and retail credit cards - Spain: The manager collects data on the customer (personal, financial, banking relationship information) and on the operation (LTV, amount, maturity, destination etc.) and calculates the rating of the transaction with the scoring. The decision of whether it is approved is made based on the results issued by the model.
Consumer Finance Autos Spain: The financing application may enter through the call center or be directly recorded in web application by our authorized dealers. The necessary information on the customer (personal, financial information, authorization of the consult from the external bureau of credit) and on the transaction (maturity, amount, etc.) is recorded to rate the transaction with the scoring. Once the validity of the information provided is obtained, the decision of whether to approve it is made based on the results issued by the model.
Retail Revolving (BBVA Bancomer credit cards): The manager or specialist party gathers the necessary information on the customer (personal, financial information and authorization of the consult from the external bureau of credit) and on the transaction (limit requested) to rate the transaction with the scoring. There are additional processes for validating and checking this information through the back office or operational support areas. The decision of whether it is approved is made based on the results issued by the model.
Behavioral: Every month all the active cards are rated according to their transactional behavior and payment status.
Proactive: Each month all the customers who have asset positions in credit cards, consumer finance or mortgages and liabilities positions are rated, based on information on internal behavior and flows.
Proactive - Spain: Each month all the customers who have asset positions in credit cards, consumer finance or mortgages and liabilities positions in credit cards and consumer finance, are rated according to information on their behavior.
Equity: For its portfolio position registered as equity, the Group is applying the rating obtained for the customer as a result of their classification in the lending process.
The estimation of the parameters is based on the uniform definition of default established at Group level. Specifically, for a contract or customer to be considered in a situation of default, the provisions of current regulations must be met.
Specifically, there are two approaches within the Group for considering default and estimating parameters:
The contract-level approach is applied within the sphere of retail risk. Each customer transaction is dealt with as an independent unit in terms of credit risk. Therefore, non-compliance with credit obligations to the bank is handled at the transaction level, regardless of the behavior of the customer with respect to other obligations.
The customer-level approach is applied to the remainder of the portfolio. The significant unit for defining default is the customer’s sum of contracts, which enter a situation of default en masse when the customer defaults.
In addition, to avoid including defaults for small amounts in the estimations, defaulted volumes are to pass through a materiality filter that depends on the type of customer and transaction.
Estimating parameters
In the case of Spain and Mexico, the Group has a RAR information system that reflects exposure to credit risk in the Group’s different portfolios included in advanced internal models.
This information system guarantees the availability of historical data recorded by the Group, which are used to estimate the parameters of Probability of Default (PD), Loss Given Default (LGD) and Credit Conversion Factors (CCF). These are then used to calculate the regulatory capital using the advanced measurement approach, economic capital and expected loss by credit risk.
Other sources of information for the Bank may be used in addition, depending on any new needs detected in the estimation process. Internal estimations of the PD, LGD and CCF parameters are made for all the Group’s portfolios.
In the case of low default portfolios (LDP), in which the number of defaults tends to be insufficient for obtaining empirical estimates, use is made of data from external agencies that are merged with the internal information available and expert criteria.
The following shows the estimation methodologies used for the PD, LGD and CCF risk parameters, for the purpose of calculating the capital requirements.
The methodology used for estimating the PD in those cases that have a mass of internal data of sufficient size is based on the creation of pools of exposures. The groups proposed with a view to calibration are defined by pooling contracts together seeking to achieve intragroup uniformity in terms of credit quality and differentiation with all the other risk groups. The largest possible number of pools is defined in order to allow a suitable discrimination of risk.
The basic metric used for making these groupings is the score, being supplemented by other metrics relevant to PD that are proven to be sufficiently discriminating depending on the portfolio.
Once the pools of exposures have been defined, the average empirical PD recorded for each one is obtained and adjusted to the cycle. This metric provides stable estimates over the course of the economic cycle, referred to as PD-TTC (Through the Cycle). This calculation considers the portfolio’s track record and provides long-term levels of PD.
In low default portfolios (LDPs) the empirical PDs observed by external credit assessment institutions are used to obtain the PD of internal risk groups.
Finally, in customer-focused portfolios there is a Master Scale, which is simply a standard and uniform rule for credit levels that makes it possible to make comparisons of credit quality in the Group’s different portfolios.
As a general rule, the method used to estimate the severity in portfolios with a sufficient number of defaults is Workout LGD Here, the LGD of a contract is obtained as a quotient of the sum of all the financial flows recorded during the recovery process that takes place when a transaction defaults, and the transaction’s exposure at the time of the default.
This estimate is made by considering all the historical data recorded in internal systems. When making the estimates, there are transactions that have already defaulted but for which the recovery process is still ongoing. The loss given default recorded at the time of the estimate is therefore higher than it will ultimately be. The necessary adjustments are made in these cases so as not to distort the estimate.
These estimates are made by defining uniform risk groups in terms of the nature of the operations that determine loss given default. They are made in such a way that there are enough groups for each one to be distinguishable and receive a different estimate.
In keeping with the guidelines set out by the rules, the estimates are made by distinguishing between wholesale and retail type exposures.
There is insufficient historical experience to make a robust estimation in low default portfolios (LDP) using the Workout LGD method, so external sources of information are used, combined with internal data to provide the portfolio with a representative rate of loss given default.
The loss given default rates estimated according to the internal databases the Group holds are conditioned to the moment of the cycle of the data window used, since loss given default varies over the economic cycle. Hence, two concepts can be defined: long-term loss given default, referred to as Long-Run LGD (LRLGD), and loss given default in a period of stress in the cycle, called Downturn LGD (DLGD).
LRLGD is calculated by making an adjustment to capture the difference between the loss given default obtained empirically with the available sample and the average loss given default observed throughout the economic cycle if the observation is complete.
In addition, the LGD observed in a period of stress in the economic cycle (DLGD) is determined.
These estimates are made for those portfolios whose loss given default is noticeably sensitive to the cycle. The different ways in which the recovery cycles can conclude are determined for each portfolio where this LGD in conditions of stress has not yet been observed, and the level these parameters would have in a downturn situation are estimated.
As with the two preceding parameters, the exposure at the moment of default is another of the necessary inputs for calculating expected loss and regulatory capital. A contract’s exposure usually coincides with its balance. However, this does not hold true in all cases.
For example, for those products with explicit limits, such as credit cards or credit lines, the exposure should incorporate the potential increase in the balance that may be recorded up to the time of default.
In observance of regulatory requirements, exposure is calculated as the drawn balance, which is the real risk at any specific moment, plus a percentage (CCF) of the undrawn balance, which is the part that the customer can still use until the available limit is reached. Therefore, the CCF is defined as the percentage of the undrawn balance that is expected to be used before default occurs.
CCF is estimated by using the cohort approach, analyzing how the exposure varies from a pre-established reference date through to the moment of default, obtaining the average performance according to the relevant metrics.
Different approaches are used for wholesale and retail type exposures. The contract approach analyzes the exposure’s evolution until the contract’s moment of breach of contract, whereas the customer approach analyzes the exposure’s evolution through to the moment of breach by the customer.
Once again, in low default portfolios (LDP) there is insufficient historical experience to make a reliable calculation with the Workout LGD method defined. In this case, too, use is made of external sources that are combined with internal data to provide a representative CCF of the portfolio.
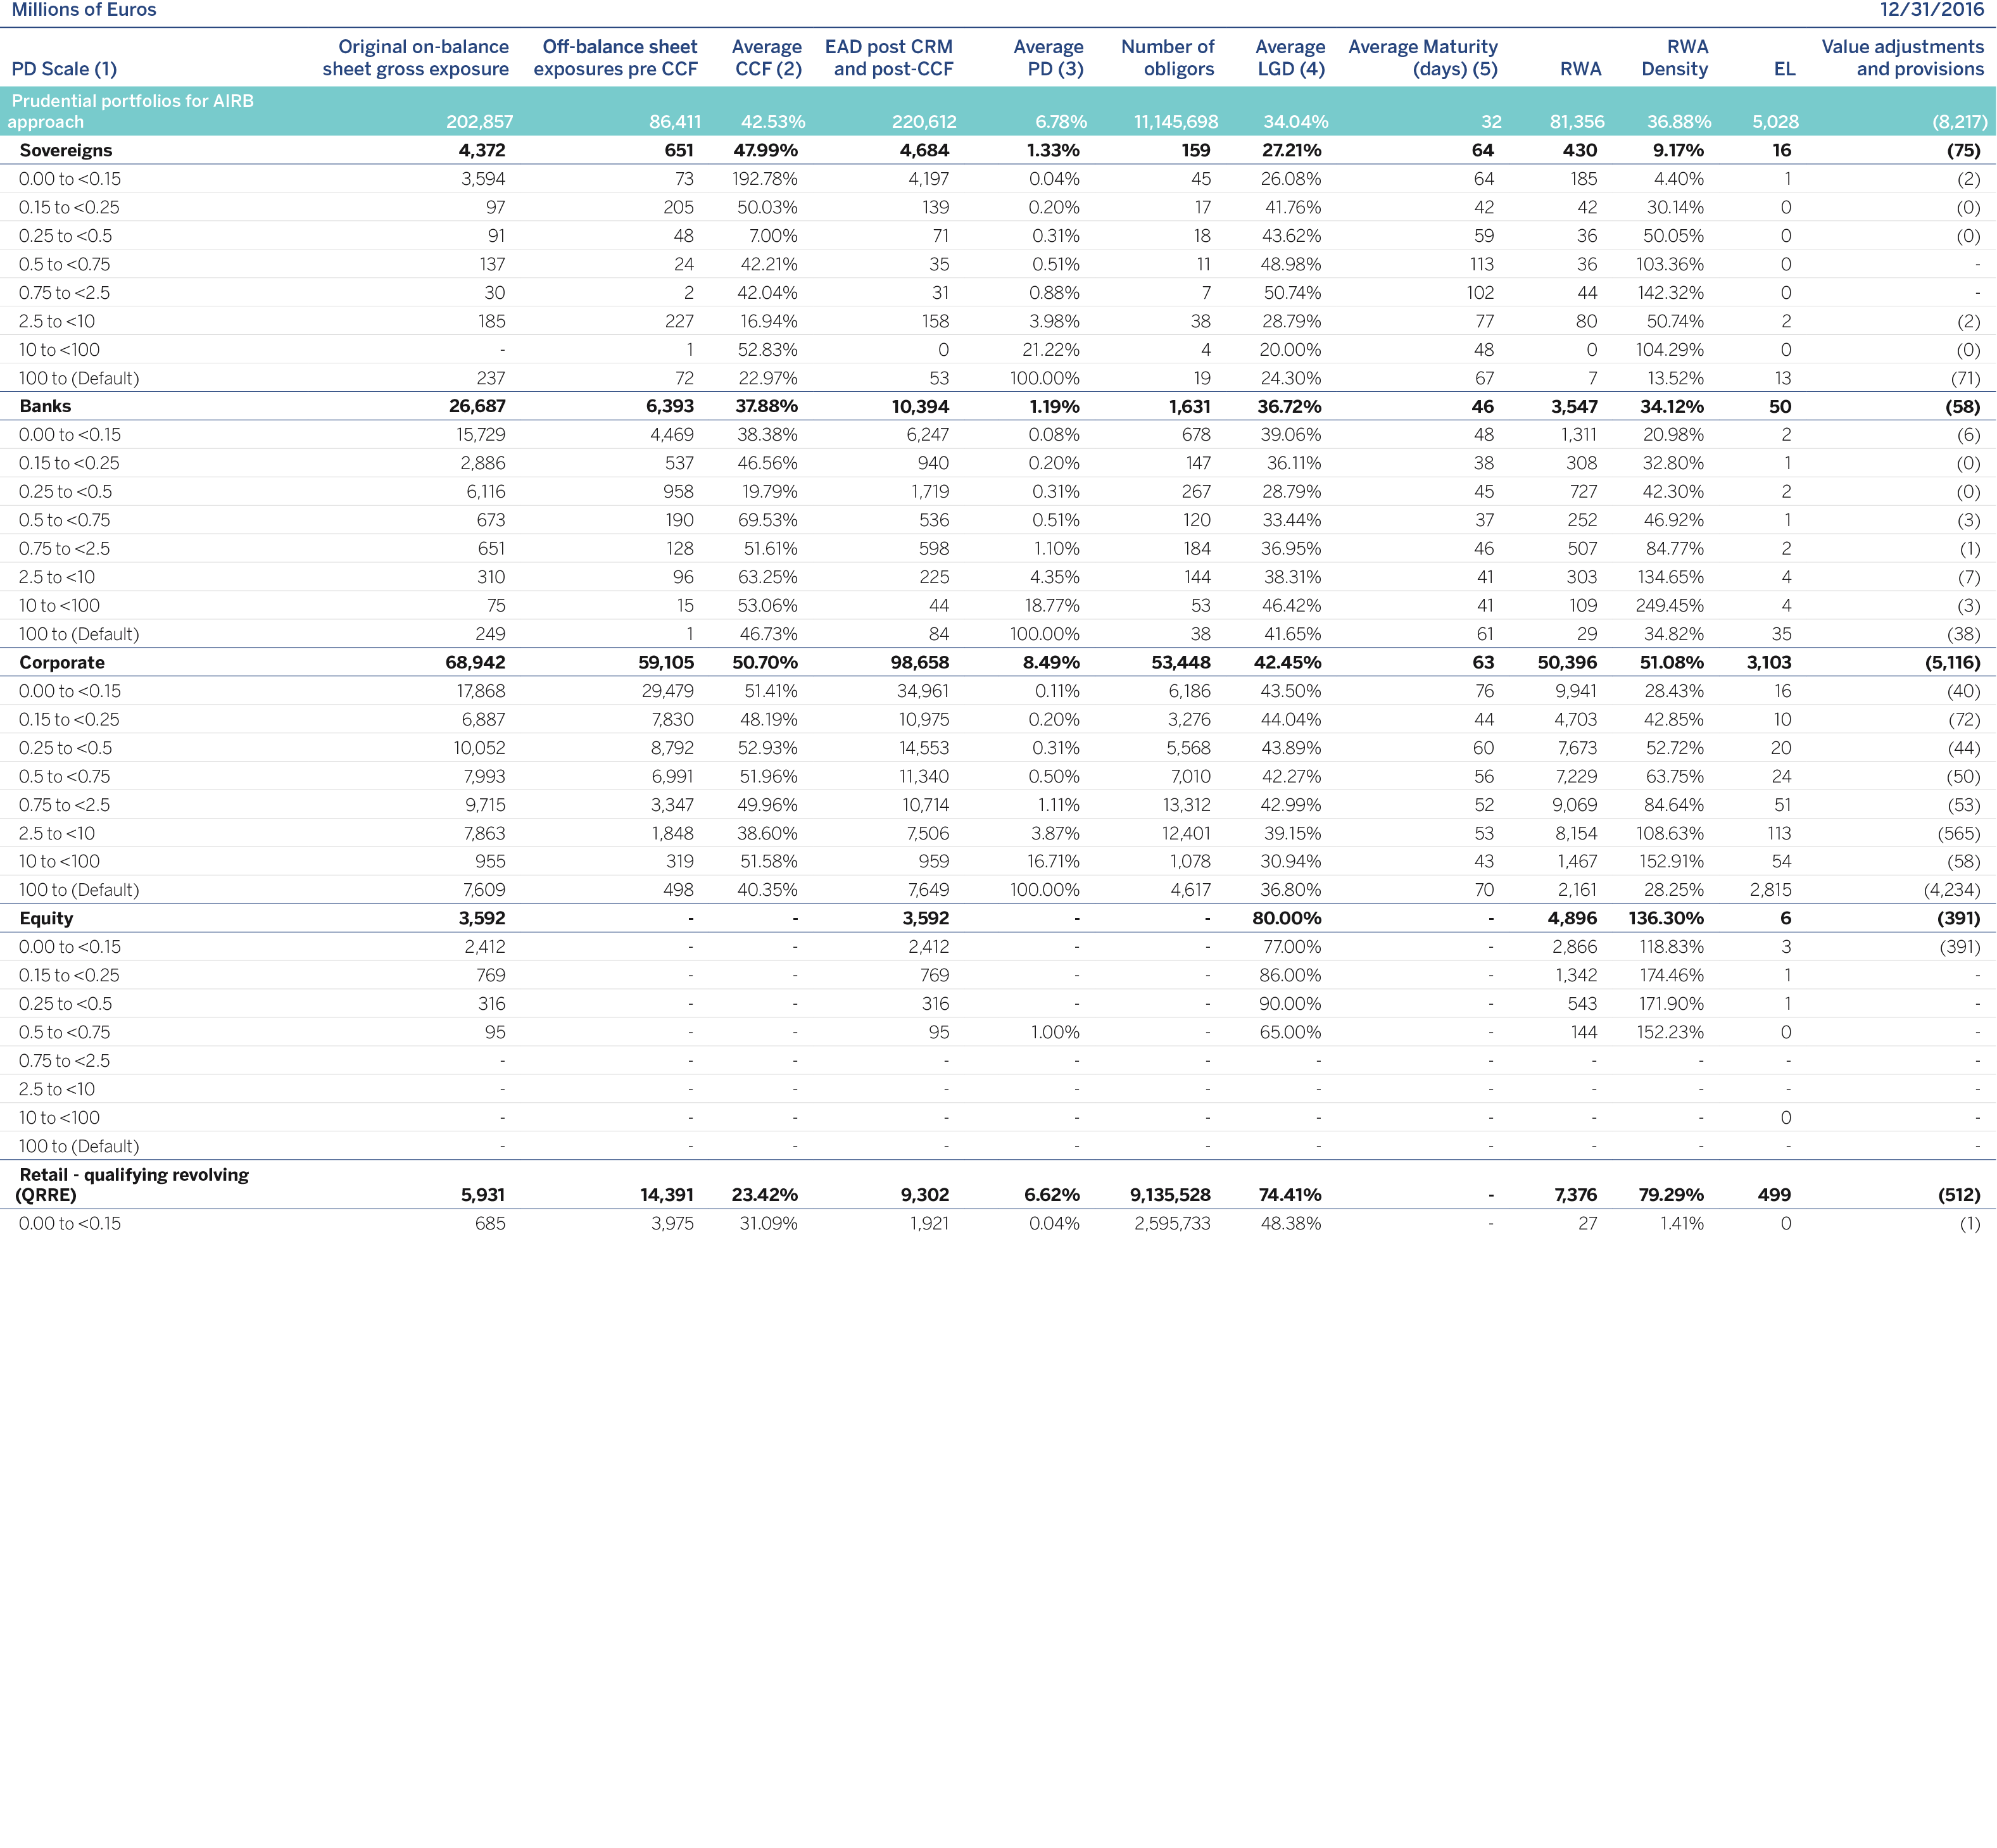
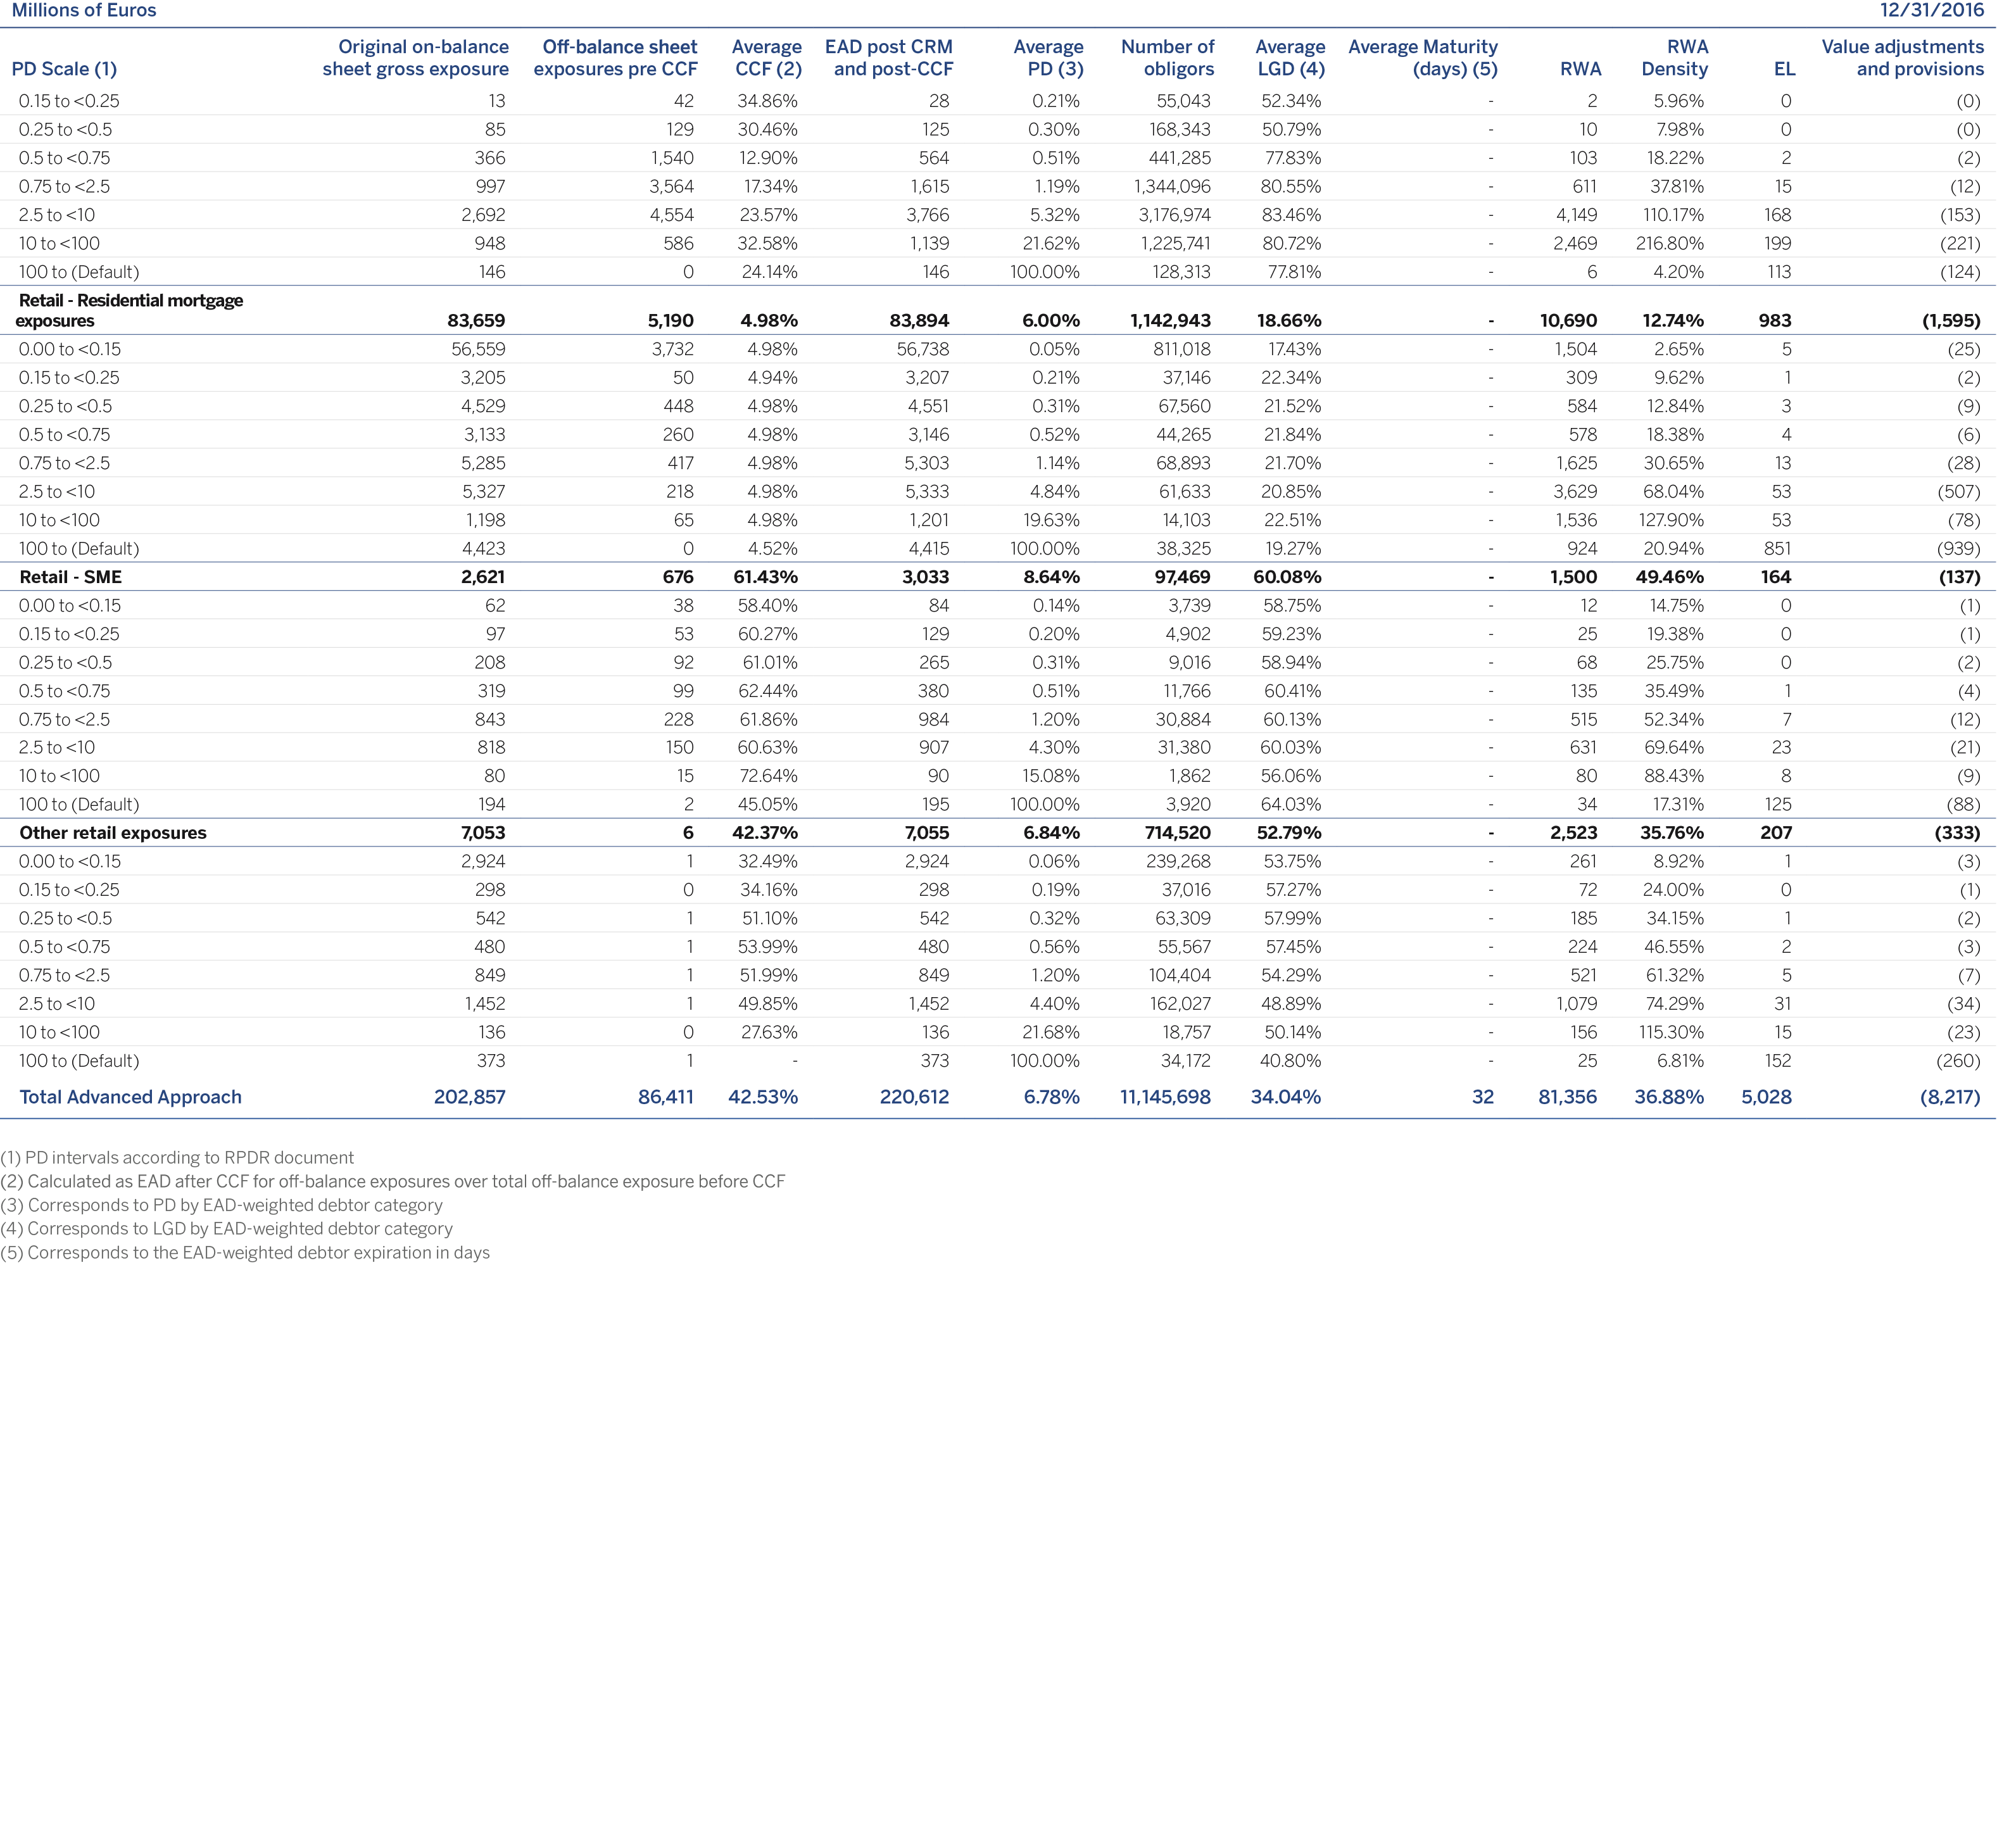
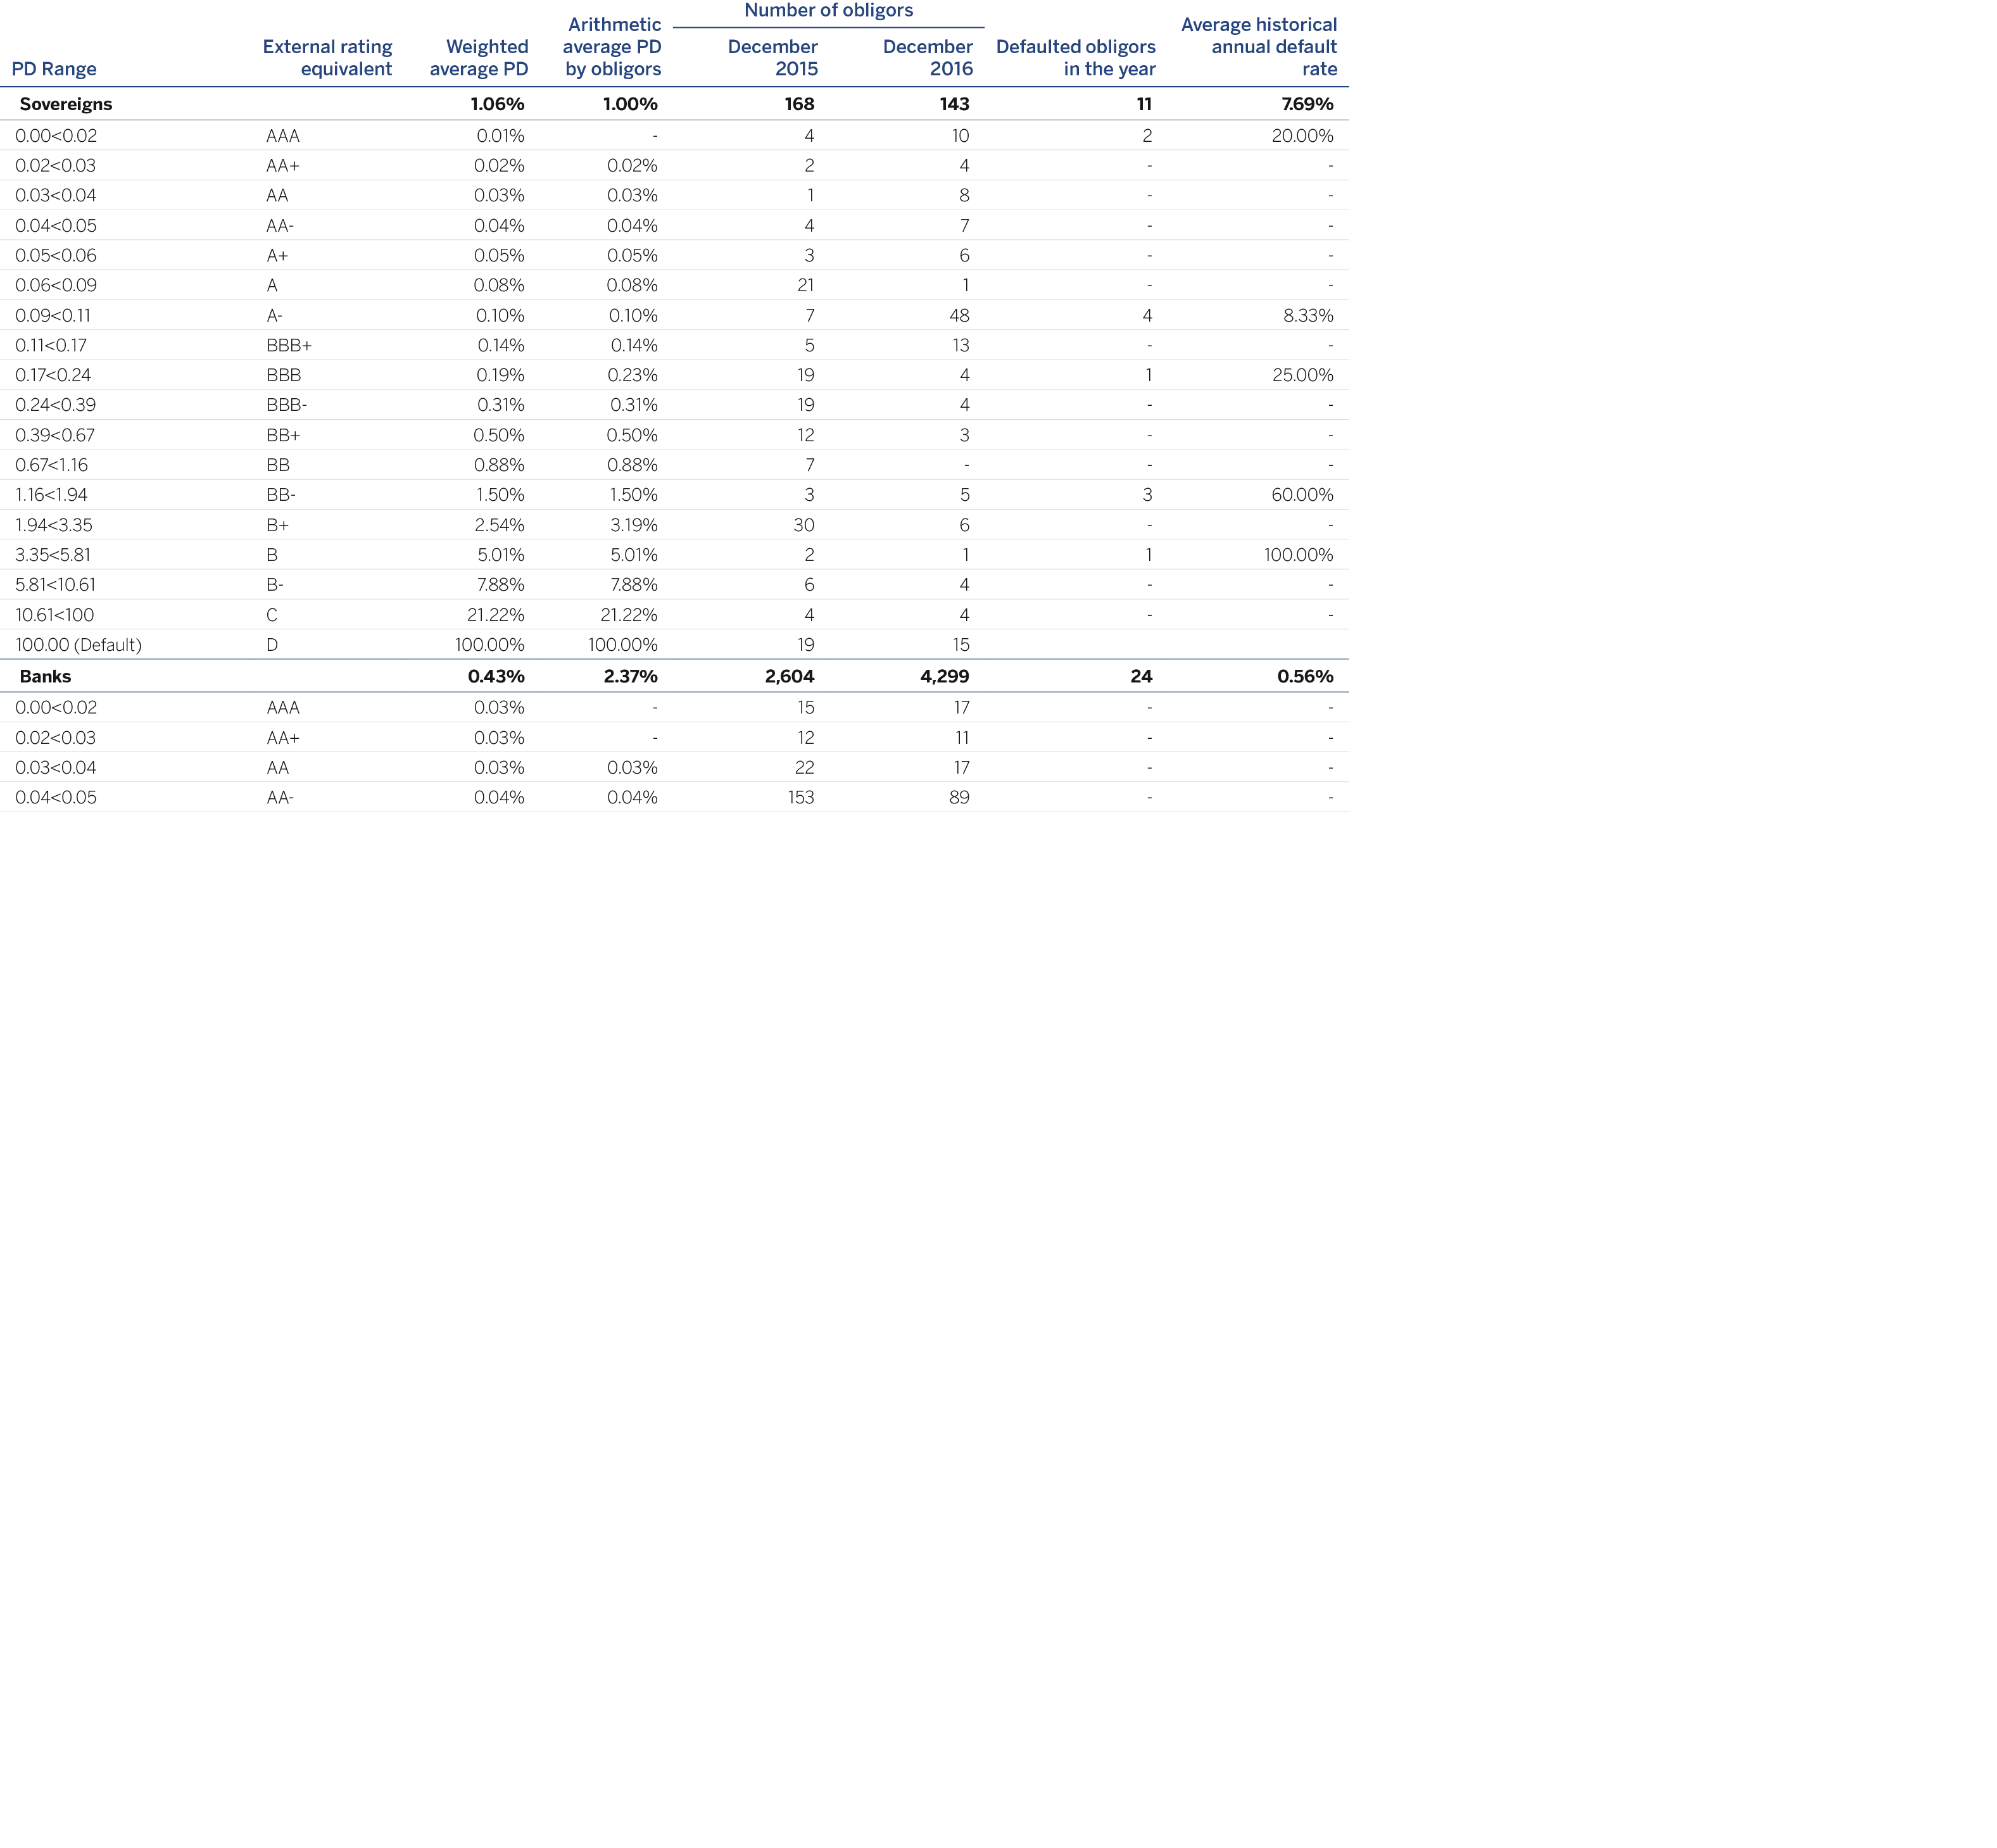
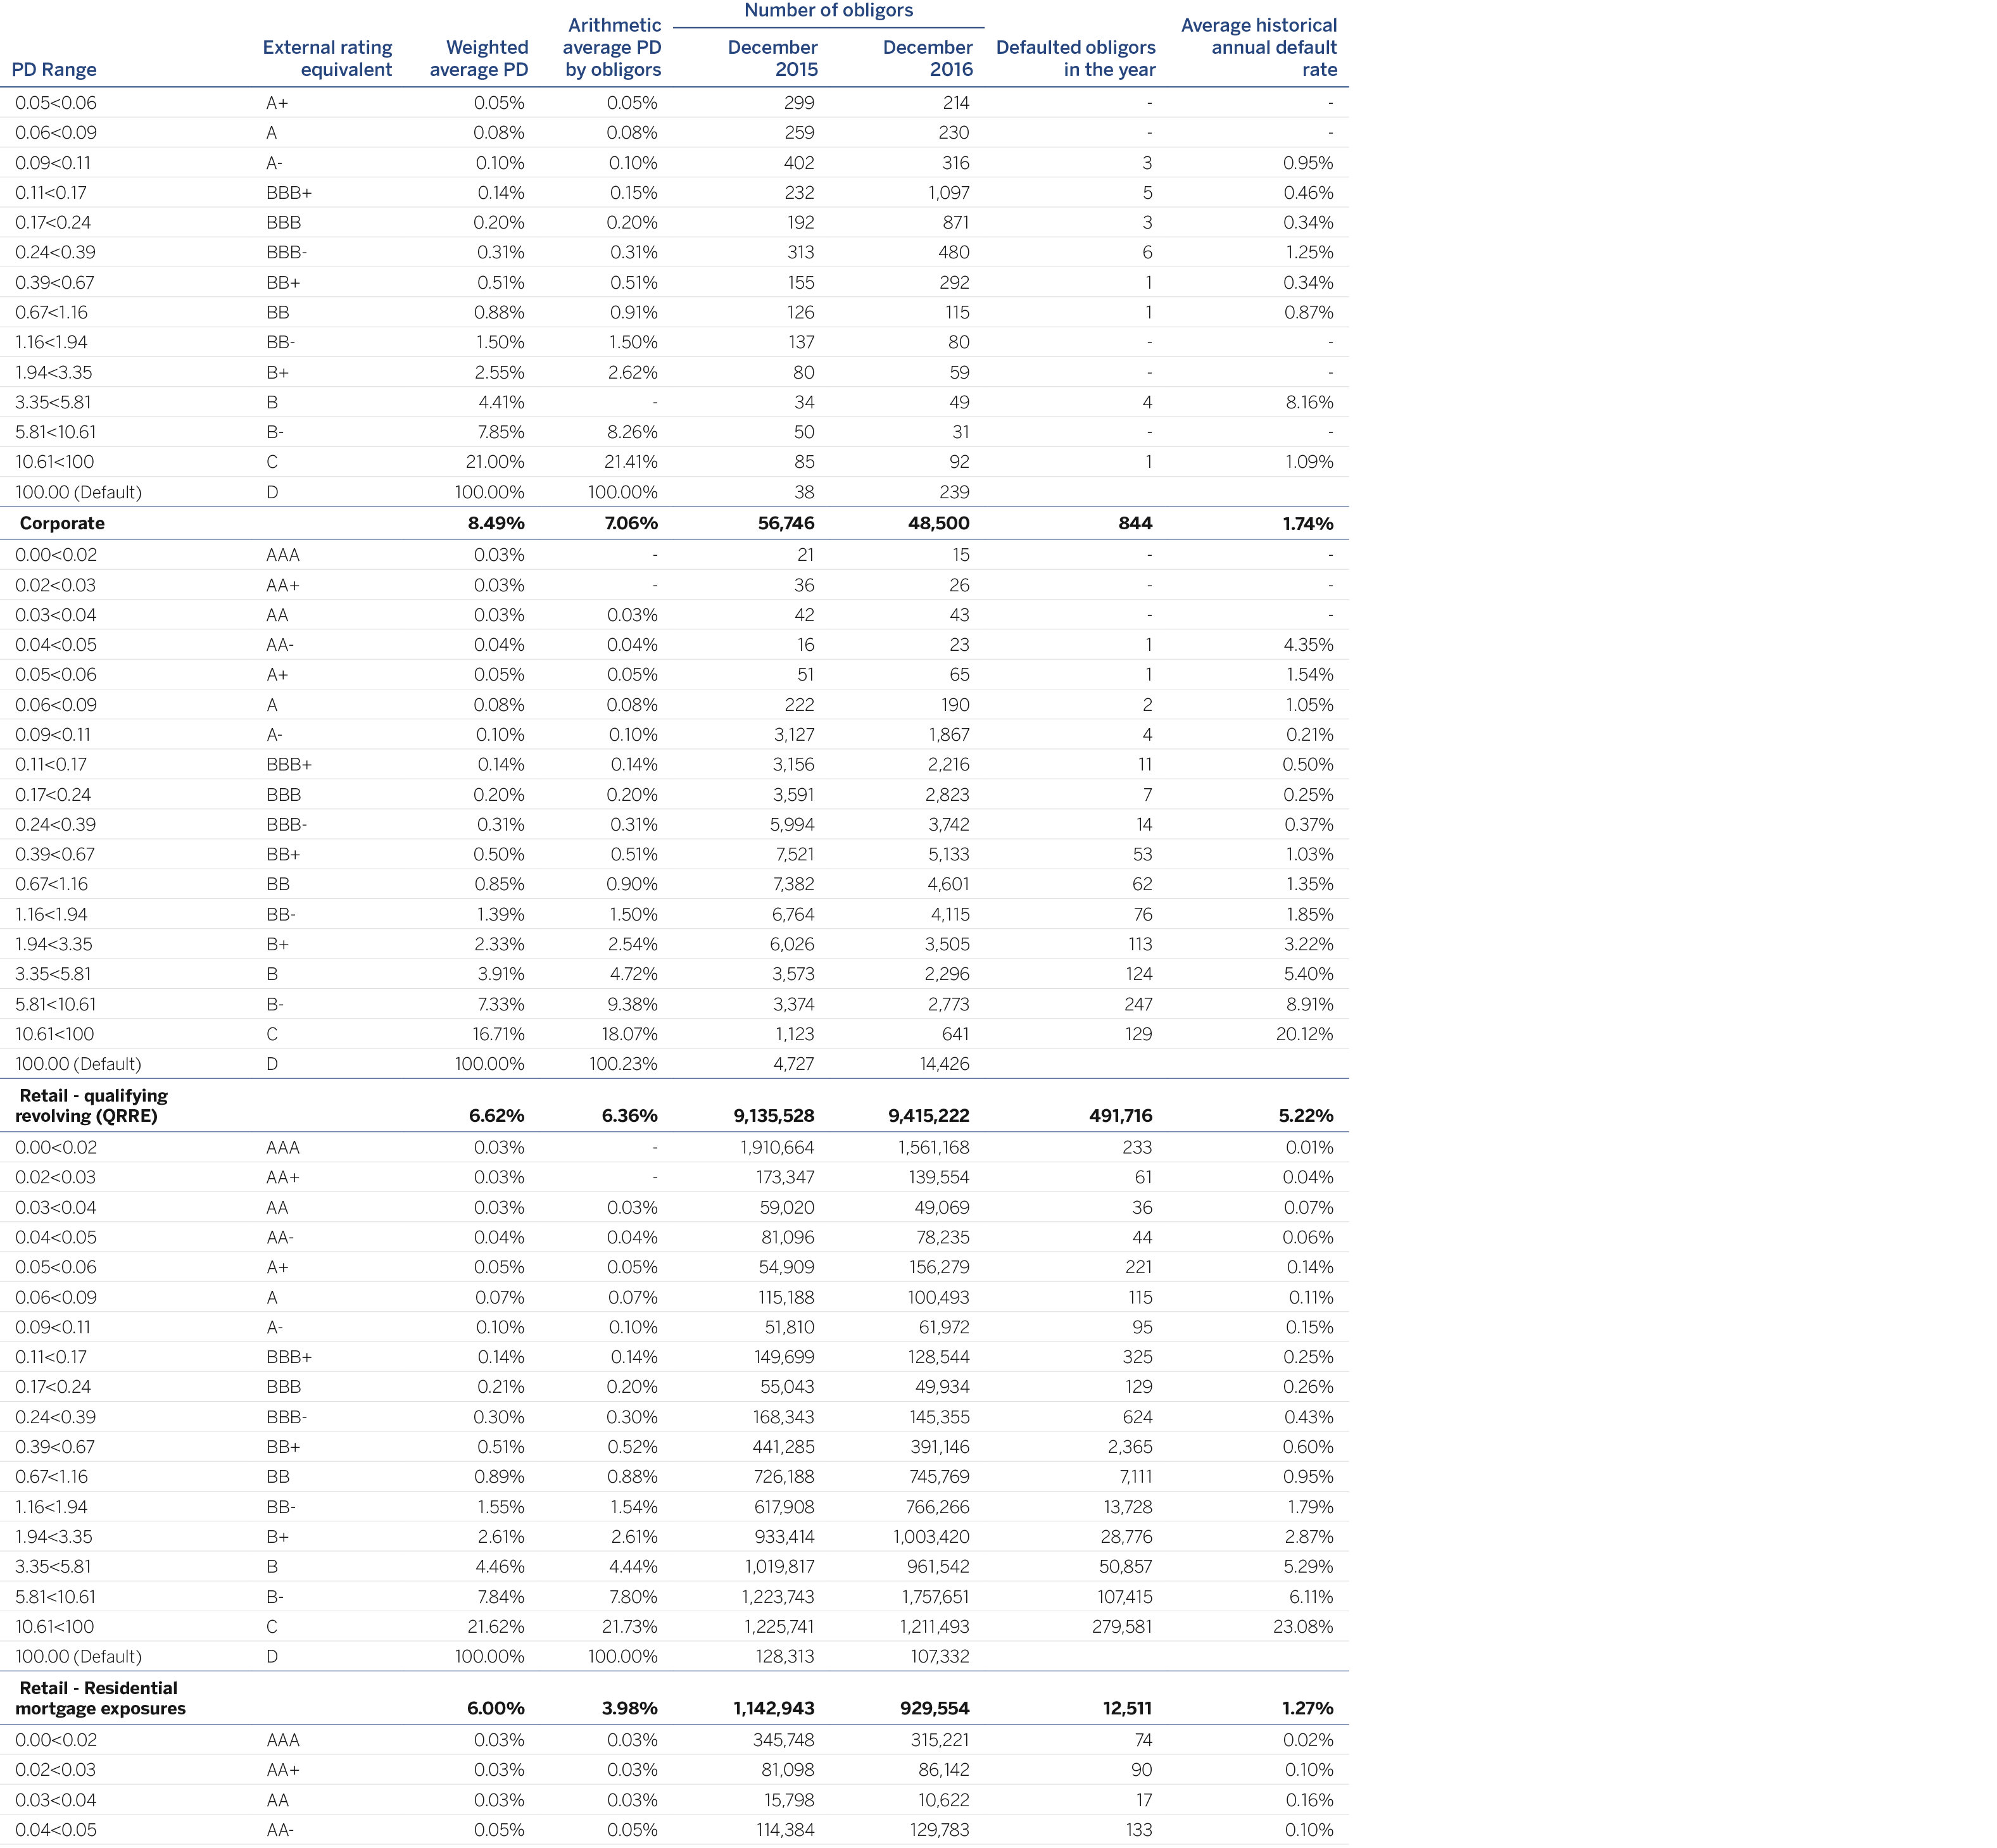
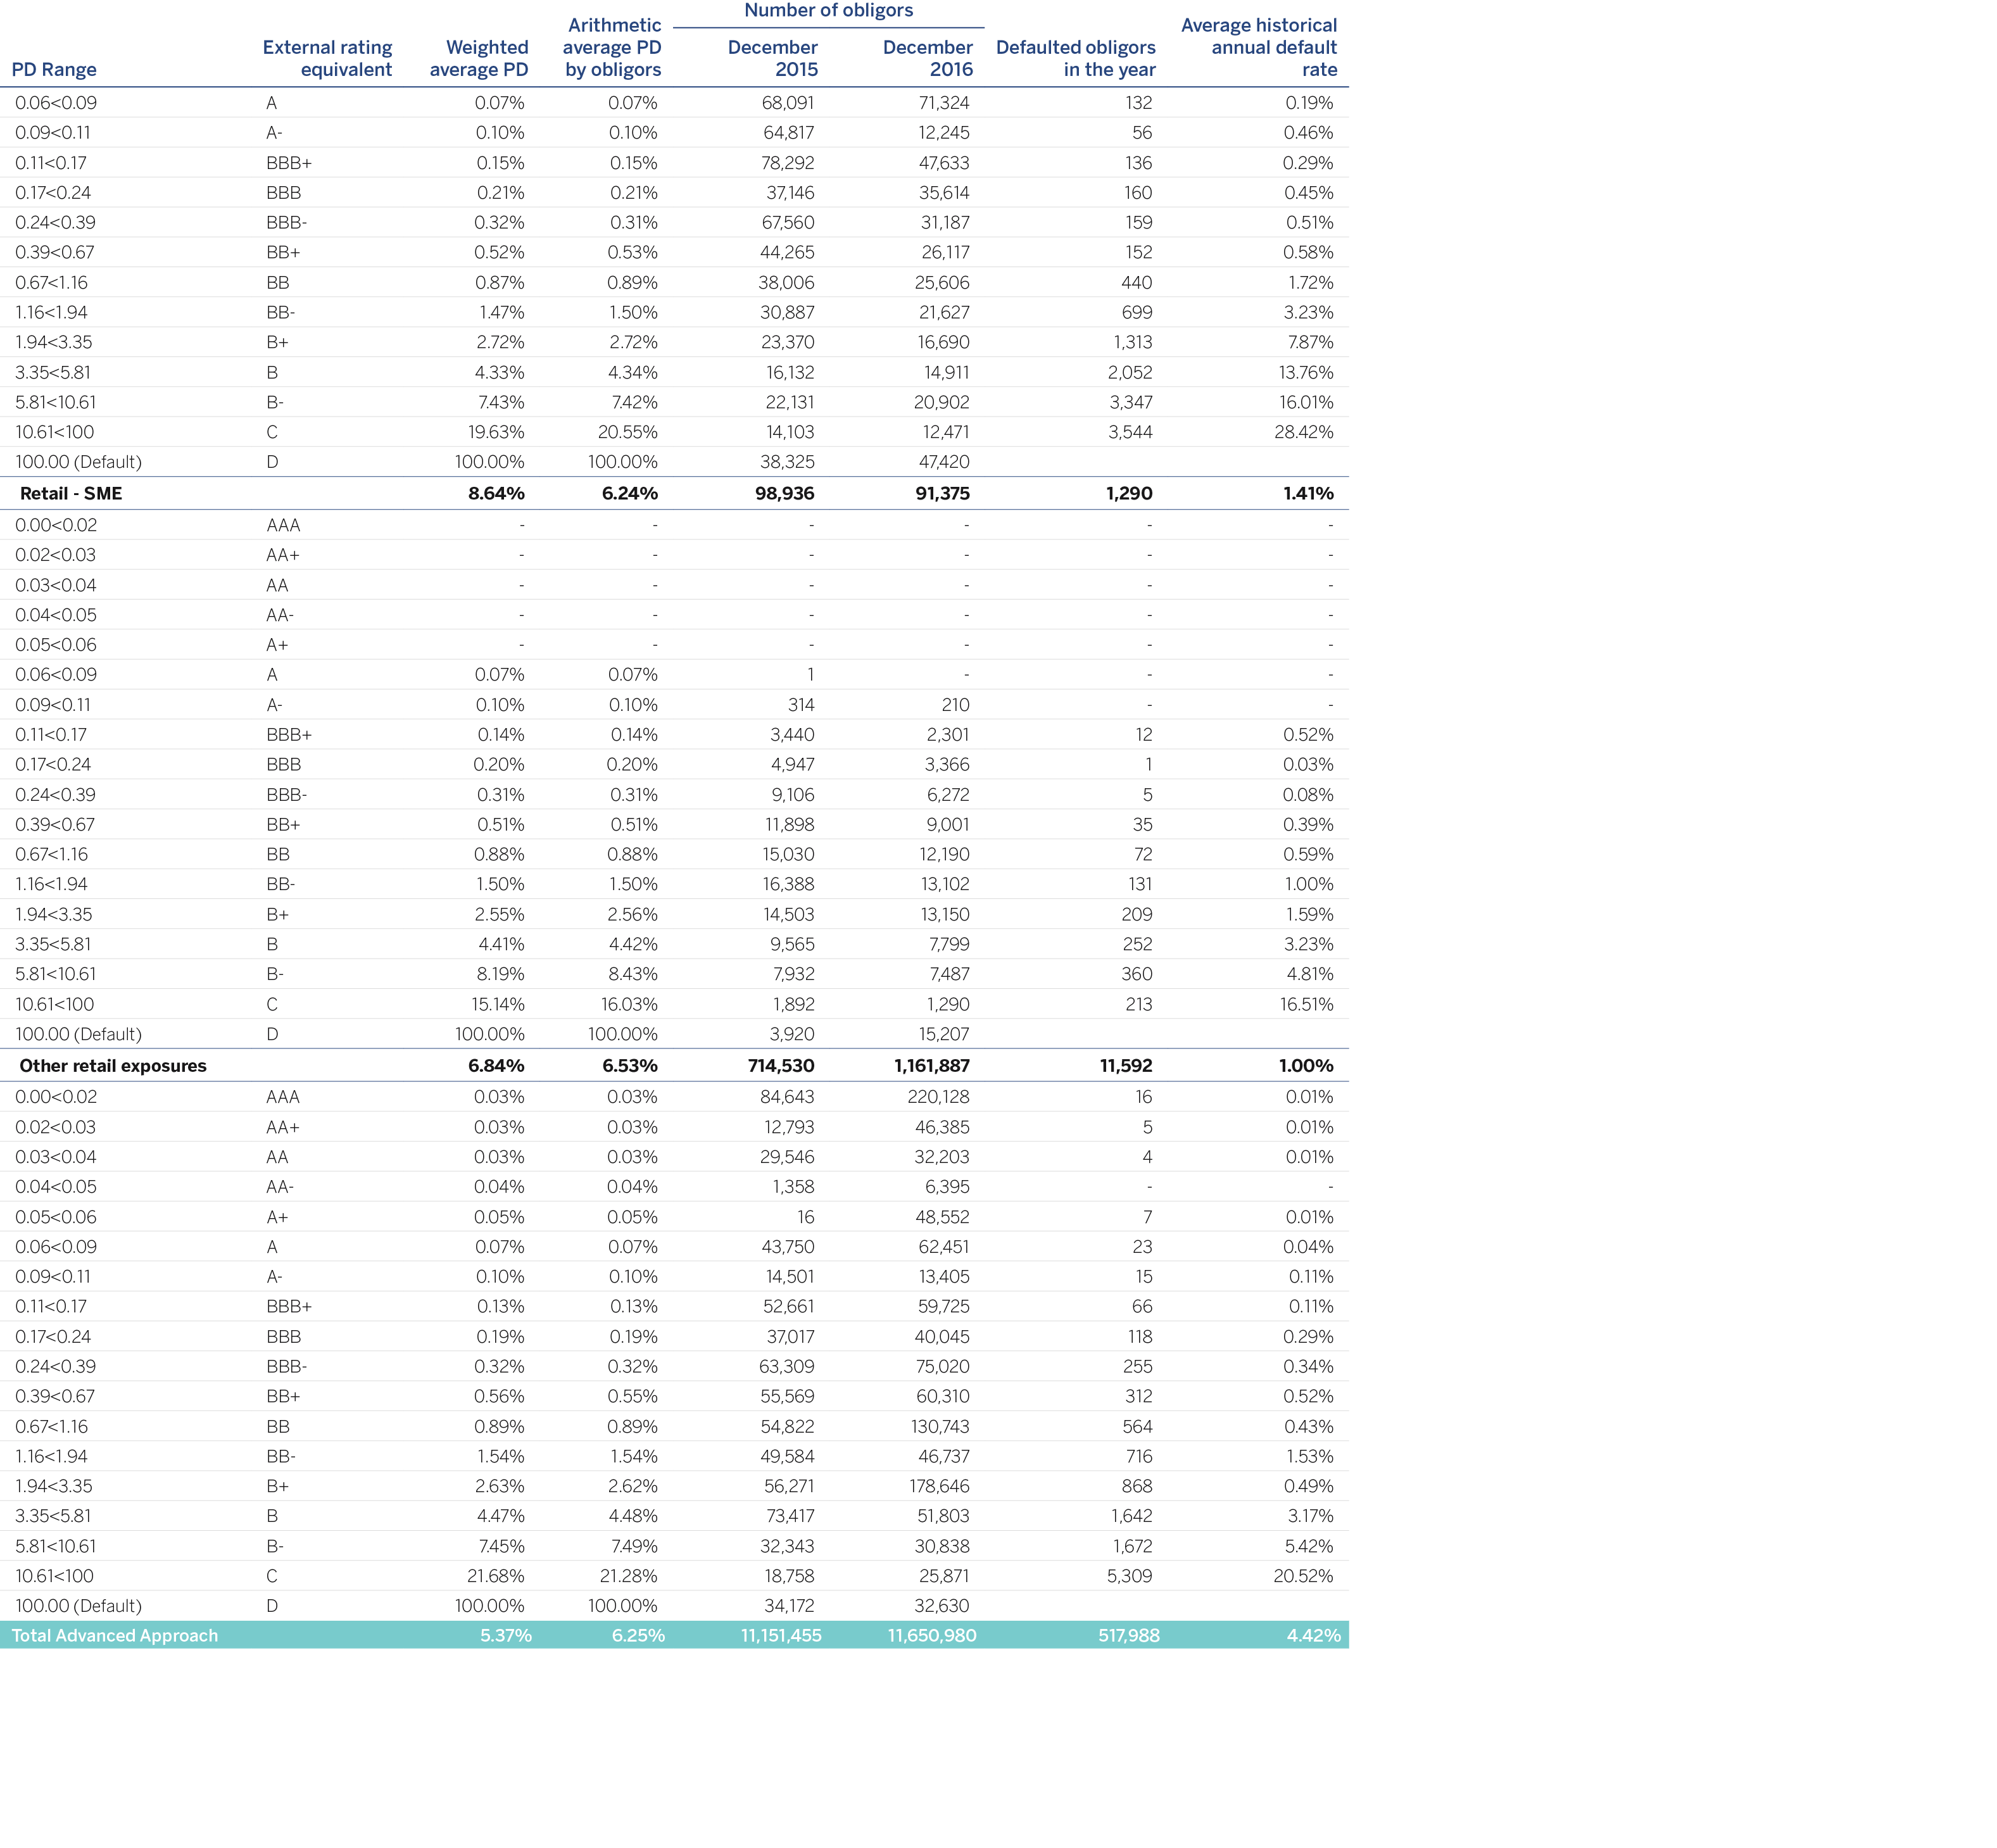
The following table shows the credit risk information as of December 31, 2016 (excluding counterparty credit risk which is detailed in table CCR4 of section 3.2.6.2.2; and specialized lending that follows the supervisory slotting criteria as explained in section 3.2.5.1.6) under the internal ratings based (IRB) method by level of obligors for the different exposure categories:
With the aim of providing backtesting data to validate the reliability of PD calculations, the table below gives a comparison of the PDs used in IRB capital calculations with the effective default rates of the Group’s obligors for credit and counterparty credit risks.
Specifically, the table compares the PD used in calculating capital by the advanced approach with the effective default rates of obligors.
The structure of the table is that recommended by the Basel Committee on Banking Supervision (BCBS) in its Revised Pillar 3 Disclosure Requirements. However, some flexibility is permitted in its interpretation.
The criteria adopted for presenting the information of the table are as follows:
Portfolio: The breakdown of the portfolios corresponds to that recommended by the RPDR, excluding the equity positions.
PD scale: Corresponds to the master rating scale in section 3.2.5.1.2 (Table 26).
External rating equivalent: Uses the equivalence between the PDs and the external ratings described in section 3.2.1.5.1.2.
Weighted PD and arithmetic average PD by obligors: Uses the PD after mitigation techniques i.e. that associated with guarantors.
Number of obligors: Presents the obligors at the close of the year and at the close of the previous year.
Defaulted obligors: For the purpose of guaranteeing the traceability of the table, columns “g” and “h” of the table included in the RPDR have been combined to report the information on transactions/customers that defaulted at some time in the last 12 months, so that the defaulted debtors in the last year are shown for each PD interval, except for the 100%-Default range.
Default rate: This presents the annual default rate, which is calculated as the defaults in the year divided by the total number of obligors the previous year.
The information contained in the above tables is set out below in graphic format (including counterparty credit risk):


The following table presents the main variations in the year in terms of RWAs for the Credit Risk advanced measurement approach:
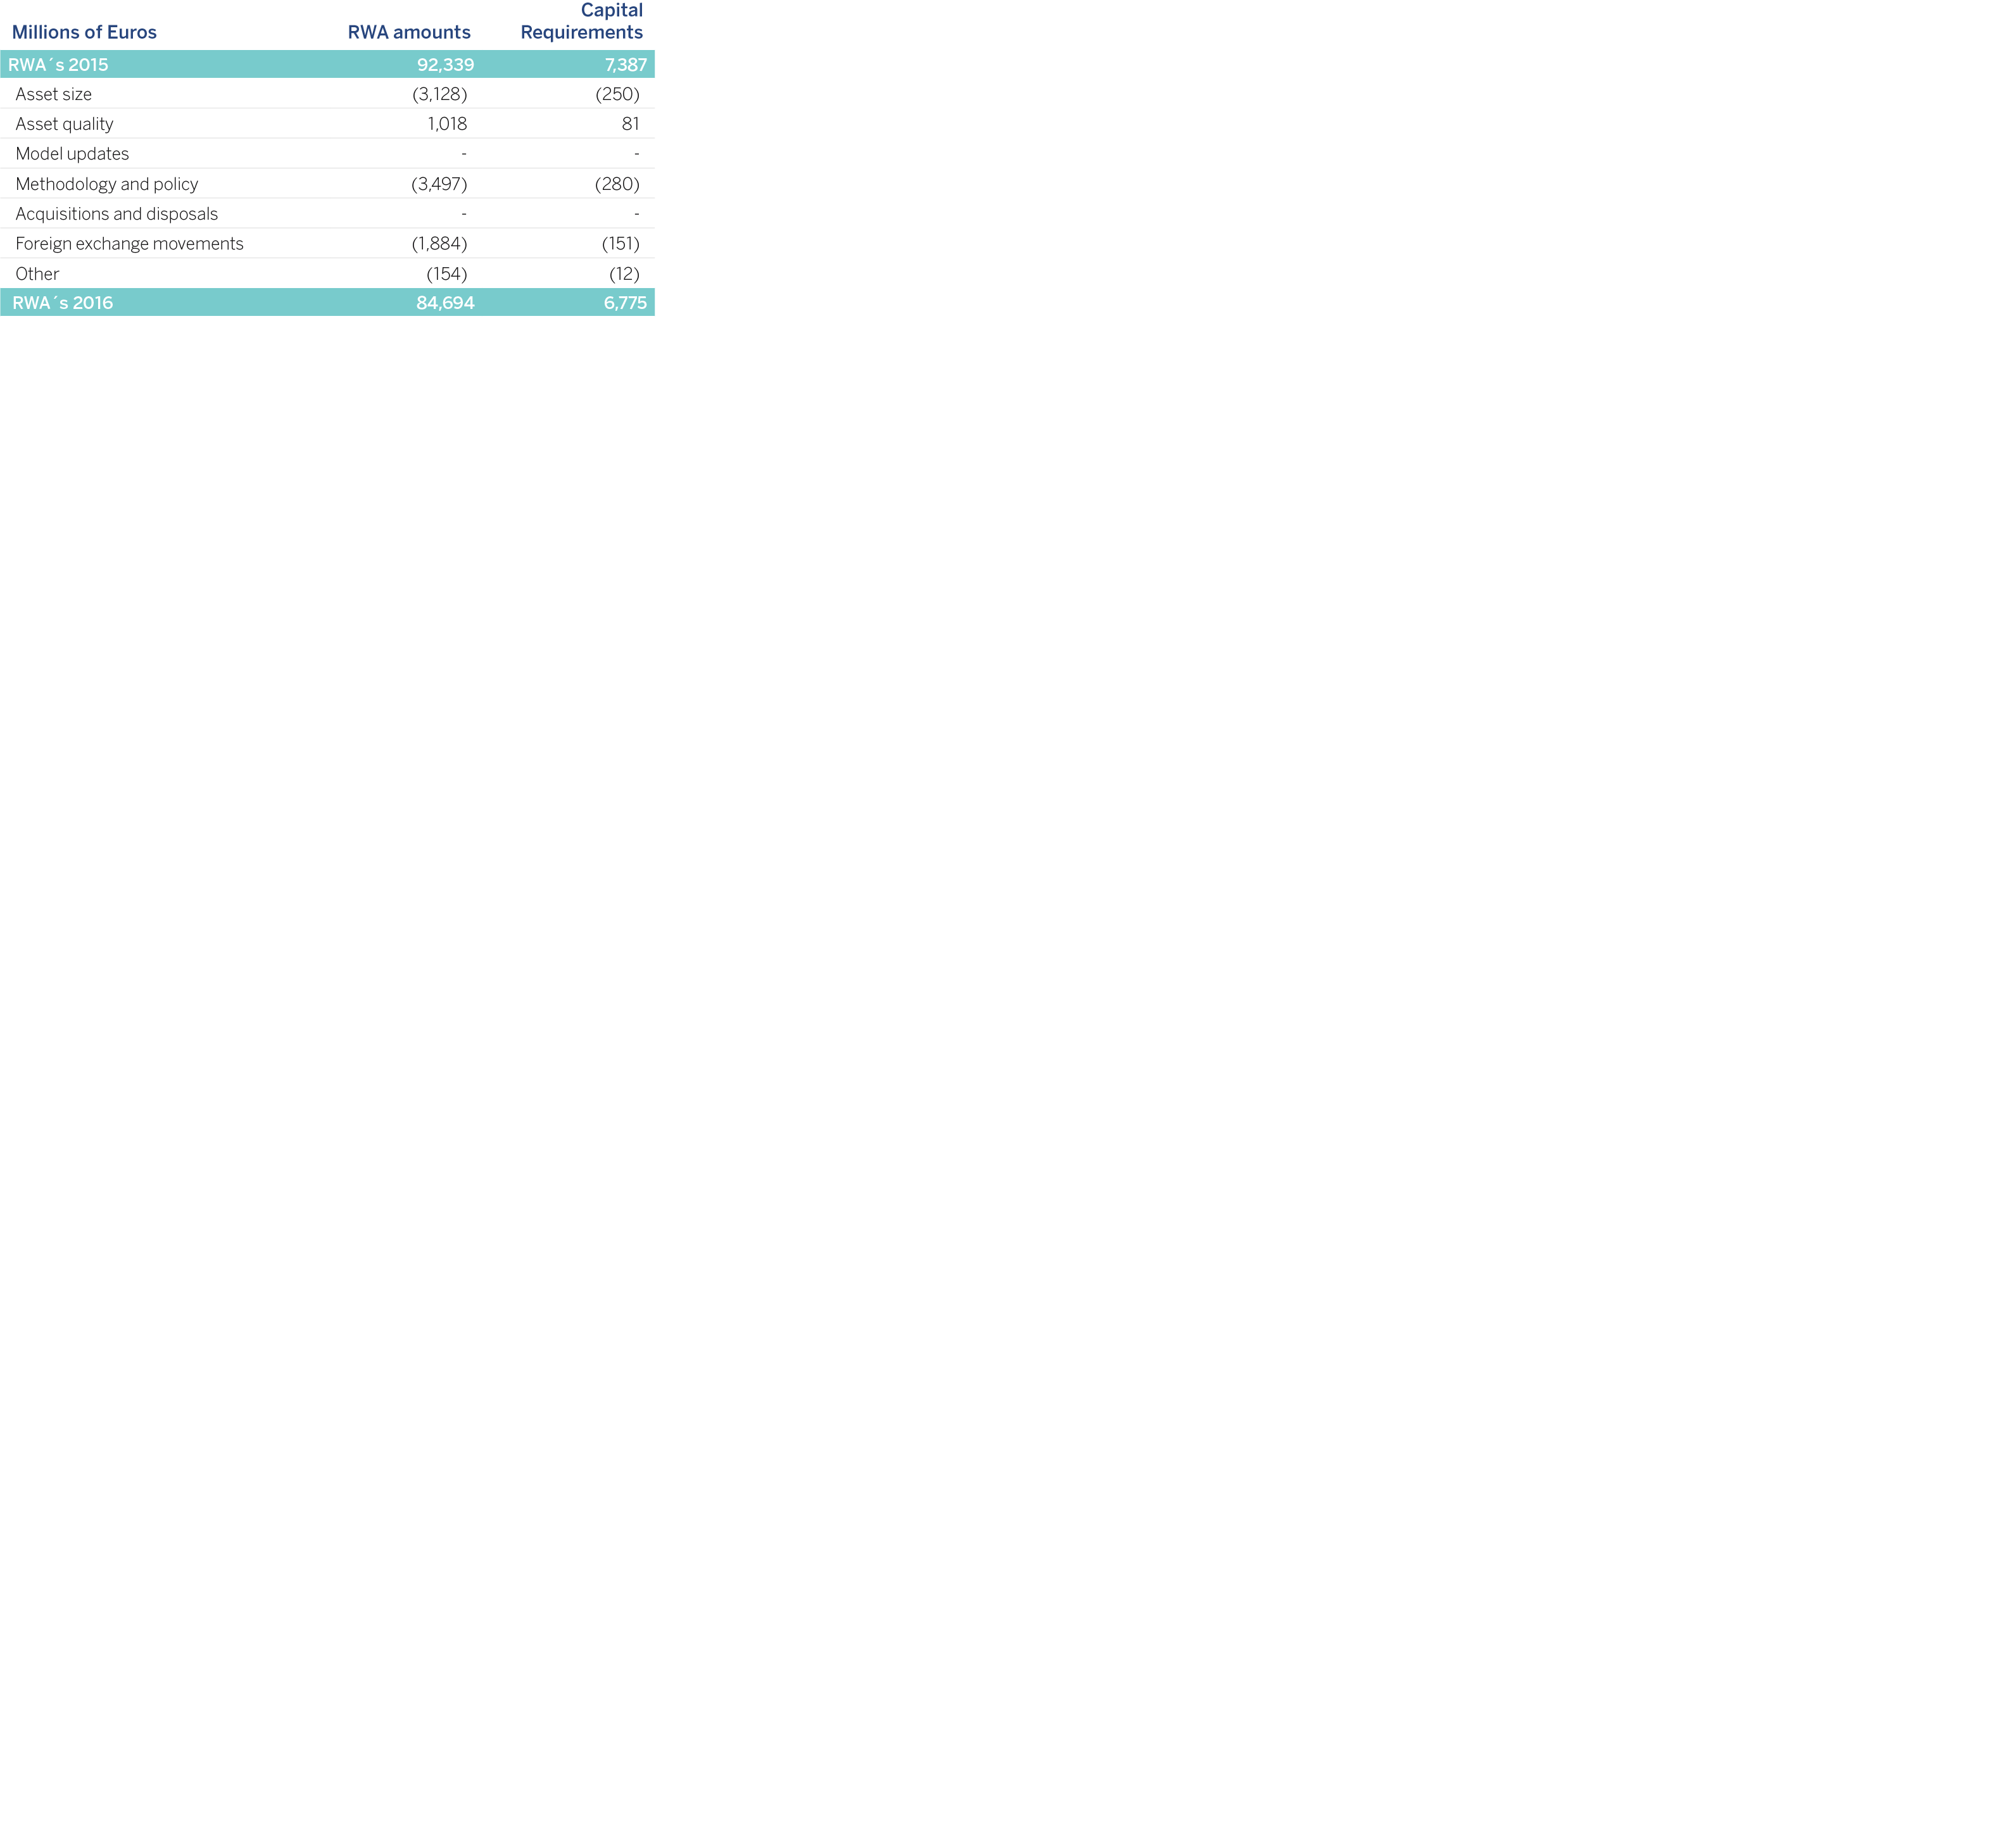
The following are the main variations in the credit risk-weighted assets in 2016, determined by the advanced measurement approach:
Asset size:There has been a drop in the exposures calculated by the advance measurement approach owing to the general deleveraging of credit exposure that has occurred in Spain, particularly in retail exposure secured by real estate collateral, which has in part been offset by the good loan-book behavior in Bancomer.
Methodology and policies:There has been a drop of approximately 3.6 million euros in exposure to Autonomous Communities and Local Authorities in Spain, which have sovereign guarantees, in accordance with article 56 of Royal Decree 84/2015 dated February 13, which implements Act 10/2014, dated June 26, on the regulation, supervision and solvency of credit institutions. This reduction includes the part from integrating Catalunya Caixa.
Currency movements:There has been a general depreciation of currencies that has reduced the amount of risk exposure for the corresponding Group subsidiaries. In this case, the exposure reduction in currency movements can practically entirely be put down to the depreciation of the Mexican peso against the euro.
The following charts compare the expected loss adjusted to the cycle calculated according to the Group’s core internal models approved by the Bank of Spain, with the effective loss incurred between 2001 and 2016. They also present the average effective loss between 2001 and 2016 in accordance with the following:
Estimated expected loss calculated with the internal models calibrated to 2016 2, and adjusted to the economic cycle (light green line), i.e. the annual average expected loss in an economic cycle.
Effective loss (light blue dotted line) calculated as the ratio of gross additions to NPA over the average observed exposure multiplied by the estimated point in time severity3.
Effective average loss (2001-2016), which is the average of effective losses for each year (light blue solid line).
The effective loss is the annual loss incurred. It must be less than the expected loss adjusted to the cycle in the best years of an economic cycle, and greater during years of crisis.
The comparison has been made for the portfolios of Mortgages, Consumer Finance Credit Cards and (2004-2015) Autos (retail), and SMEs and Developers (2009-2015), all of them in S&P. In Mexico, the comparison has been carried out for the Credit Card portfolio (2005-2016 window) and SMEs and Large Companies (2005-2016 window). Regarding the categories of Institutions (Public and Financial Institutions) and Corporate, historical experience shows that there is such a small number of defaulted exposures (Low Default Portfolios) that it is not statistically significant, and hence the reason the comparison is not shown.
The charts show that during the years of biggest economic growth, in general the effective loss was significantly lower than the expected loss adjusted to the cycle calculated using internal models.
The contrary was the case after the start of the crisis. This is in line with the major economic slowdown and the financial difficulties of households and companies, above all in the case of developers and construction companies.
The fact that in some portfolios the average observed loss is greater than the estimated loss is coherent with the fact that the observed time window may be worse than what would be expected in a complete economic cycle. In fact, this window has fewer expansive years (6) than crisis years (10). This is not representative of a complete economic cycle.
Starting in 2007, the effective losses are above the expected loss adjusted to the cycle, as they are losses incurred in years of crisis. The effective losses are slightly greater than the cycle-adjusted figures given the sampled number of years entailing more years of crisis than growth.

The chart shows that during the years of biggest economic growth the effective loss was lower than the expected loss adjusted to the cycle calculated using internal models. The contrary was the case starting in 2007. This is in line with the major economic slowdown and the financial difficulties of households. For 2016 a loss is expected in accordance with the loss adjusted to the cycle.

As in the case of Mortgages and Consumer Finance, the observed loss is lower than the Expected Loss adjusted to the cycle calculated using internal models at best periods of the cycle, and higher during its worst periods.

In the case of the Automobile portfolio, the expected loss adjusted to the cycle continues to be higher than the average effective losses for the last fifteen years, which suggests the conservative nature of the estimate.

Due to a methodological change in the estimate of LGD, only the expected loss for the 2009-2015 window is shown for the SME and Developer portfolios. It can be seen that since 2009 the observed losses are much higher than the average expected losses in the cycle. This is because the major difficulties suffered by companies in the years of crisis, particularly those in the Construction and Developer businesses.

The PD series is shown below for these very same portfolios, with the data from 2002 to 2016. Similar to the remaining portfolios, the observed series is much lower than the one adjusted to the cycle until 2007, calculated with the internal models in the best moments of the cycle, and greater during the lowest moments.

In the case of Bancomer's credit cards portfolio we can see how the average Expected Loss for the cycle calculated using internal models is below the average observed losses. The reason is the use of an observation window which is unrepresentative of a complete economic cycle (the estimate would be considering comparatively more years of crisis than of economic growth).

In the case of Bancomer's Corporates portfolio we can see how the average Expected Loss for the cycle calculated using internal models is below the average observed losses. The reason is the use of an observation window which is different from the window of a complete economic cycle (the estimate would be considering comparatively more years of crisis than of economic growth). The expected loss for 2012 is influenced by the recovery management carried out in 2015. This management particularly affects the 2012 defaults resulting in LGDs lower than in previous years. In Mexico it is defined as the complete cycle for the period 2002-2011.

The table below shows the balances of provisions for credit and counterparty credit risks, by exposure categories, as of December 31, 2016 and December 31, 2015.
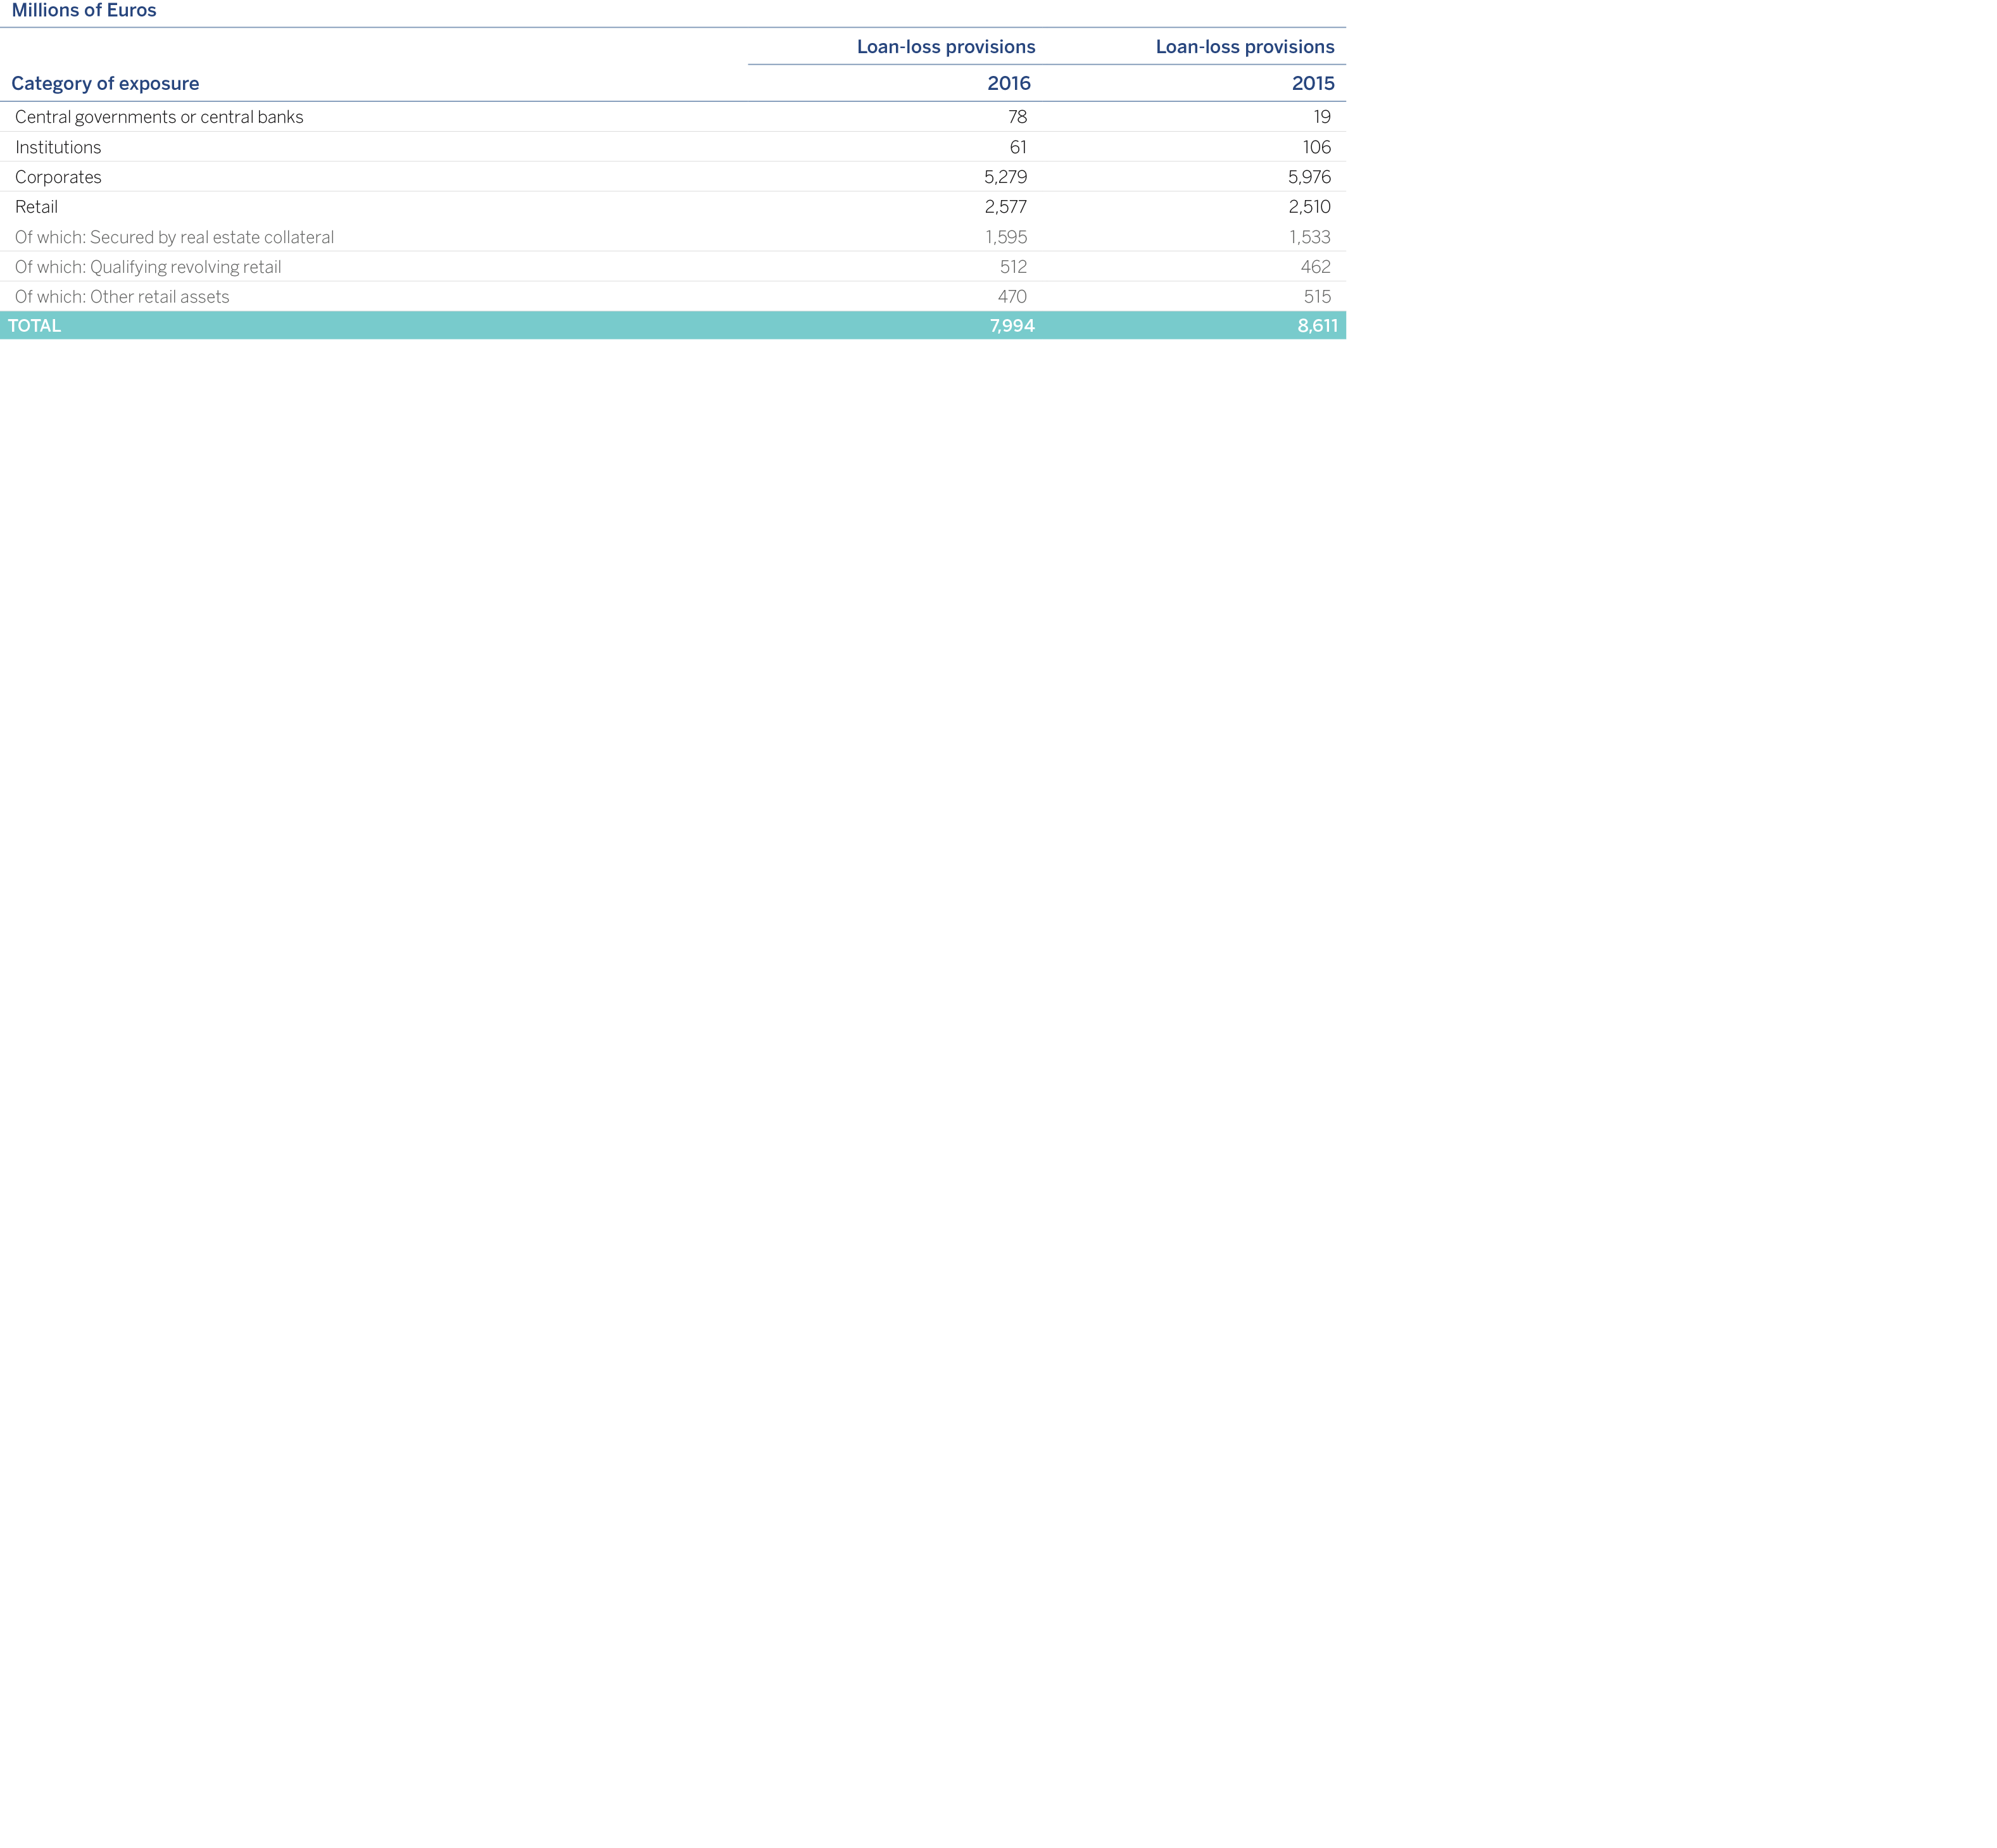
The solvency regulation stipulates that the consideration of specialized lending companies is to apply to legal entities with the following characteristics:
The exposure is to an entity created specifically to finance and/or operate physical assets
The contractual arrangements give the lender a substantial degree of control over the assets and income they generate.
The primary source of repayment of the obligation is the income generated by the assets being financed, rather than the independent capacity of the borrower.
The table below shows the exposure assigned to each of the risk weightings of exposure to specialized lending (including counterparty credit risk) as of December 31, 2016, broken down into exposures in HVCRE (high volatility commercial real estate) and other than HVCRE; and by type of finance (project finance, object finance, commodities finance and income producing real state), respectively:
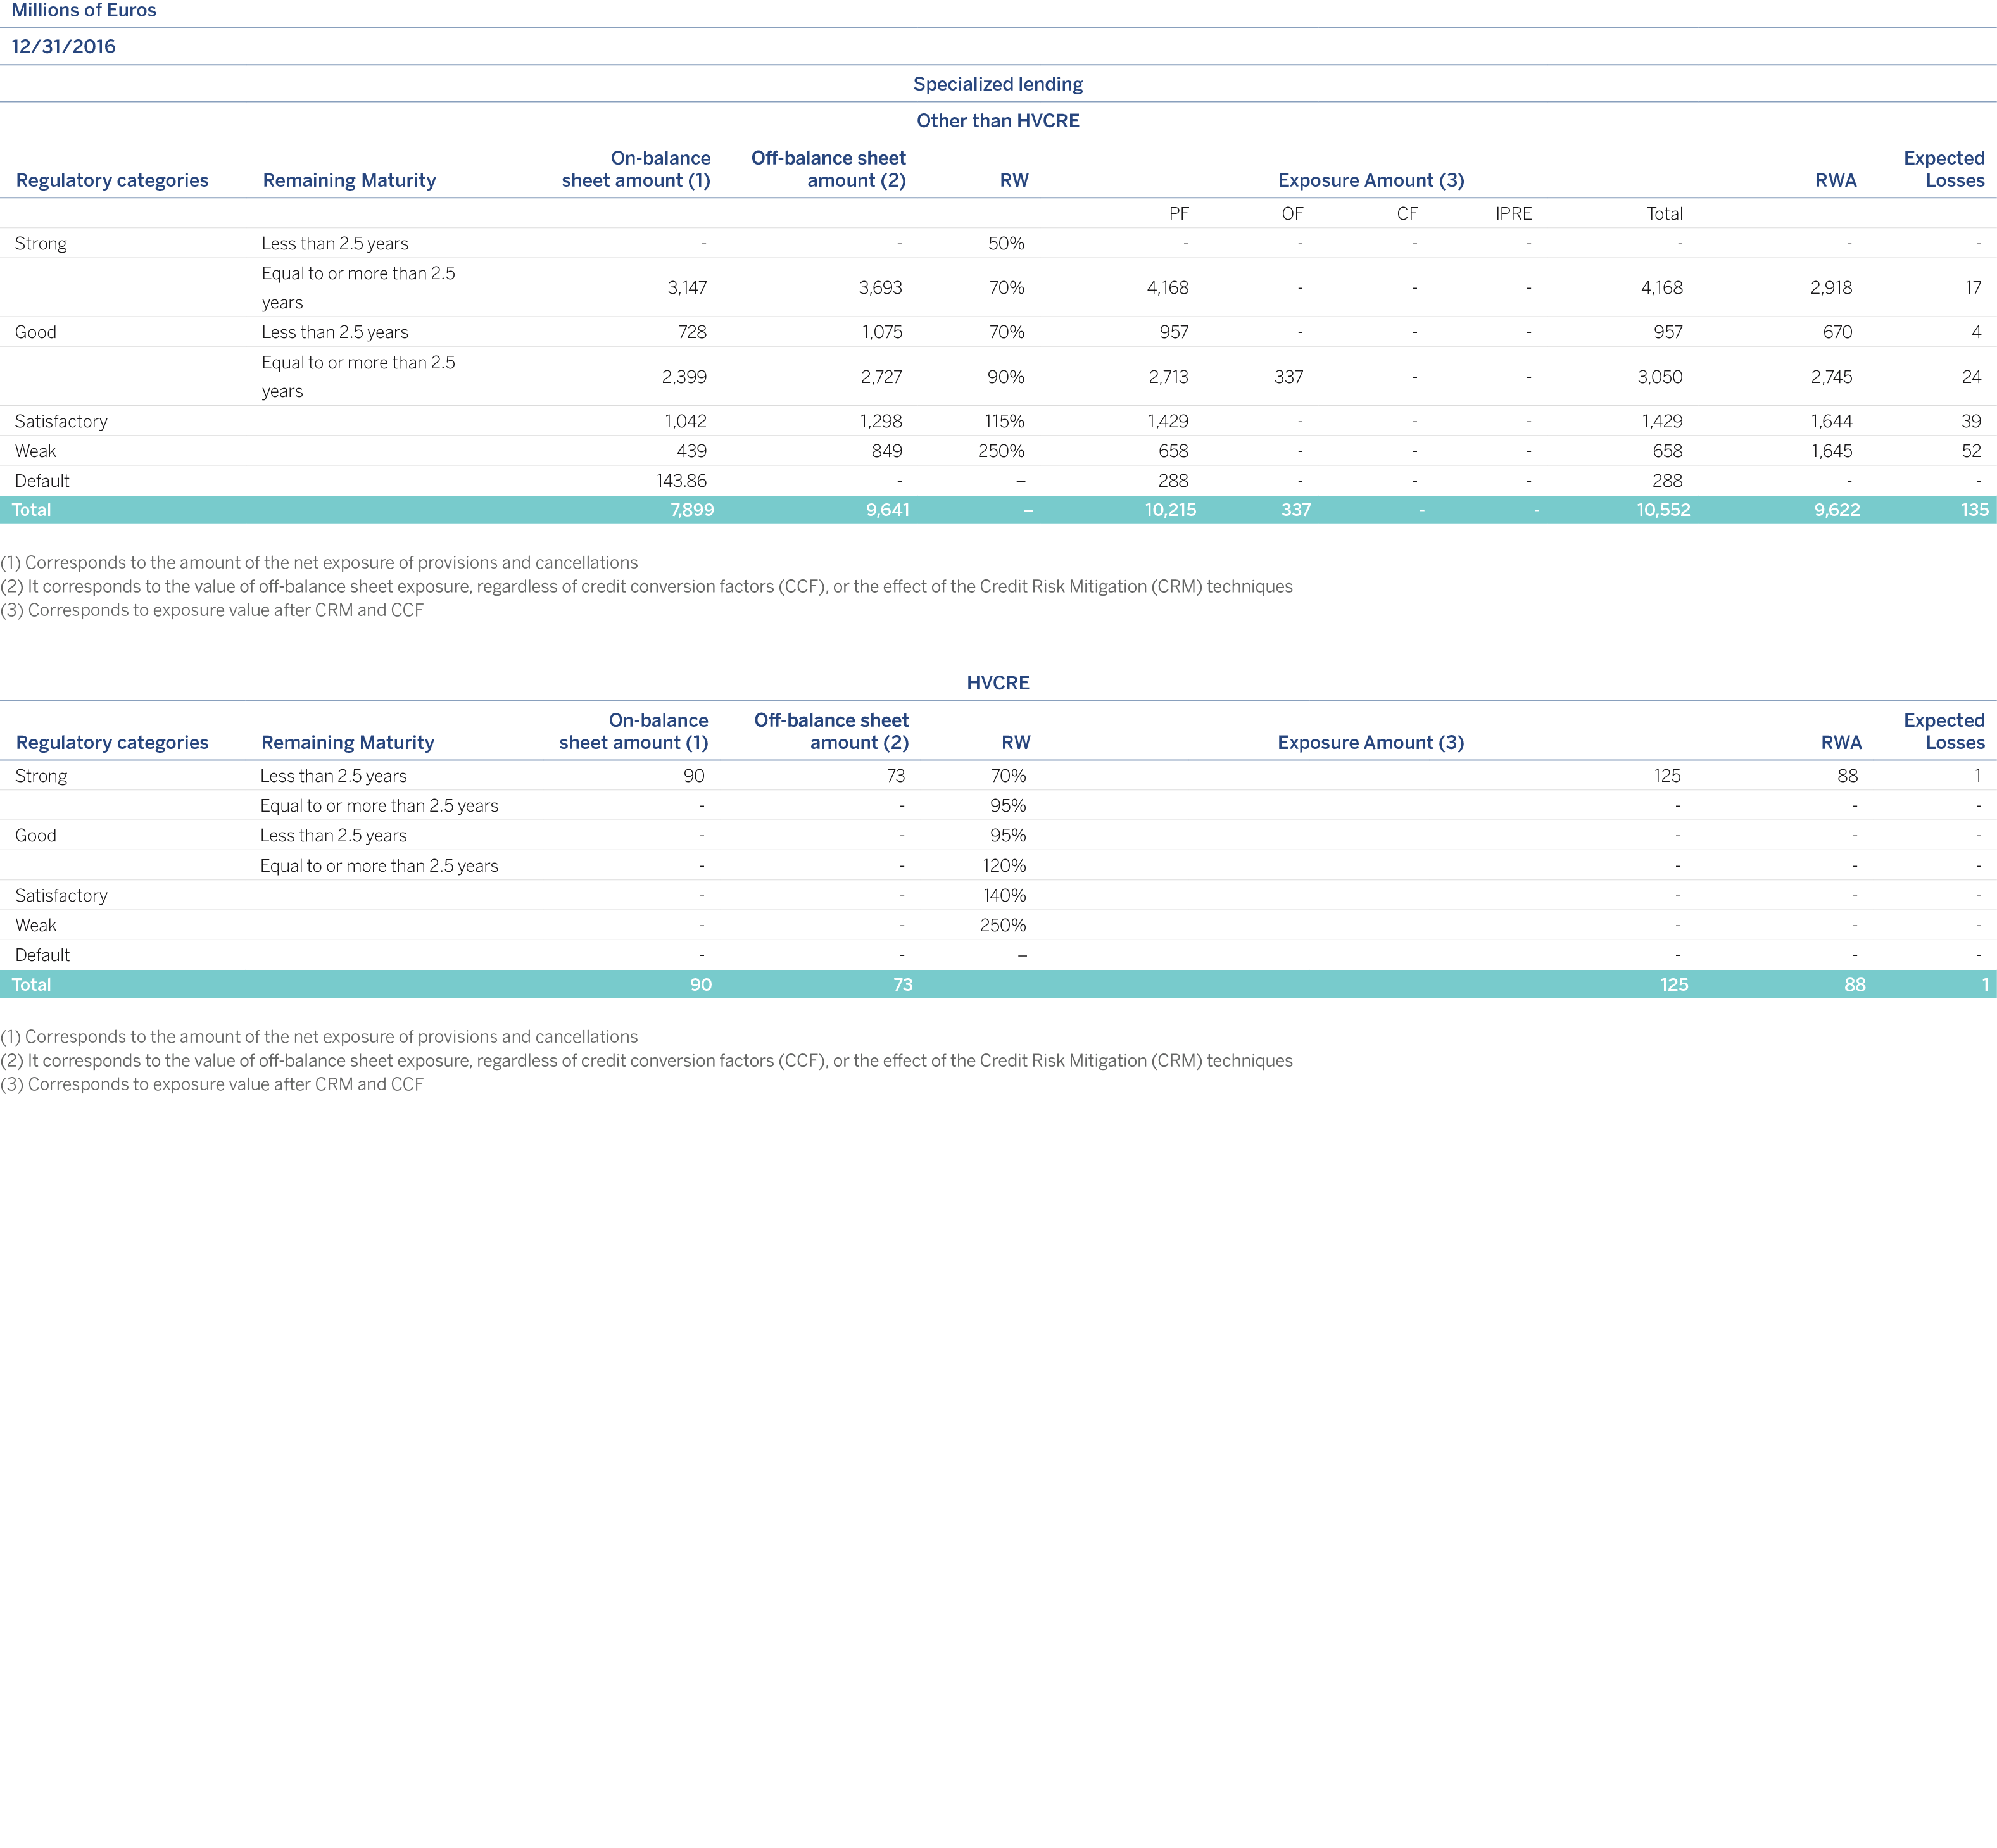
The following table presents the exposures assigned to each one of the risk weightings of equity exposures as of December 31, 2016.
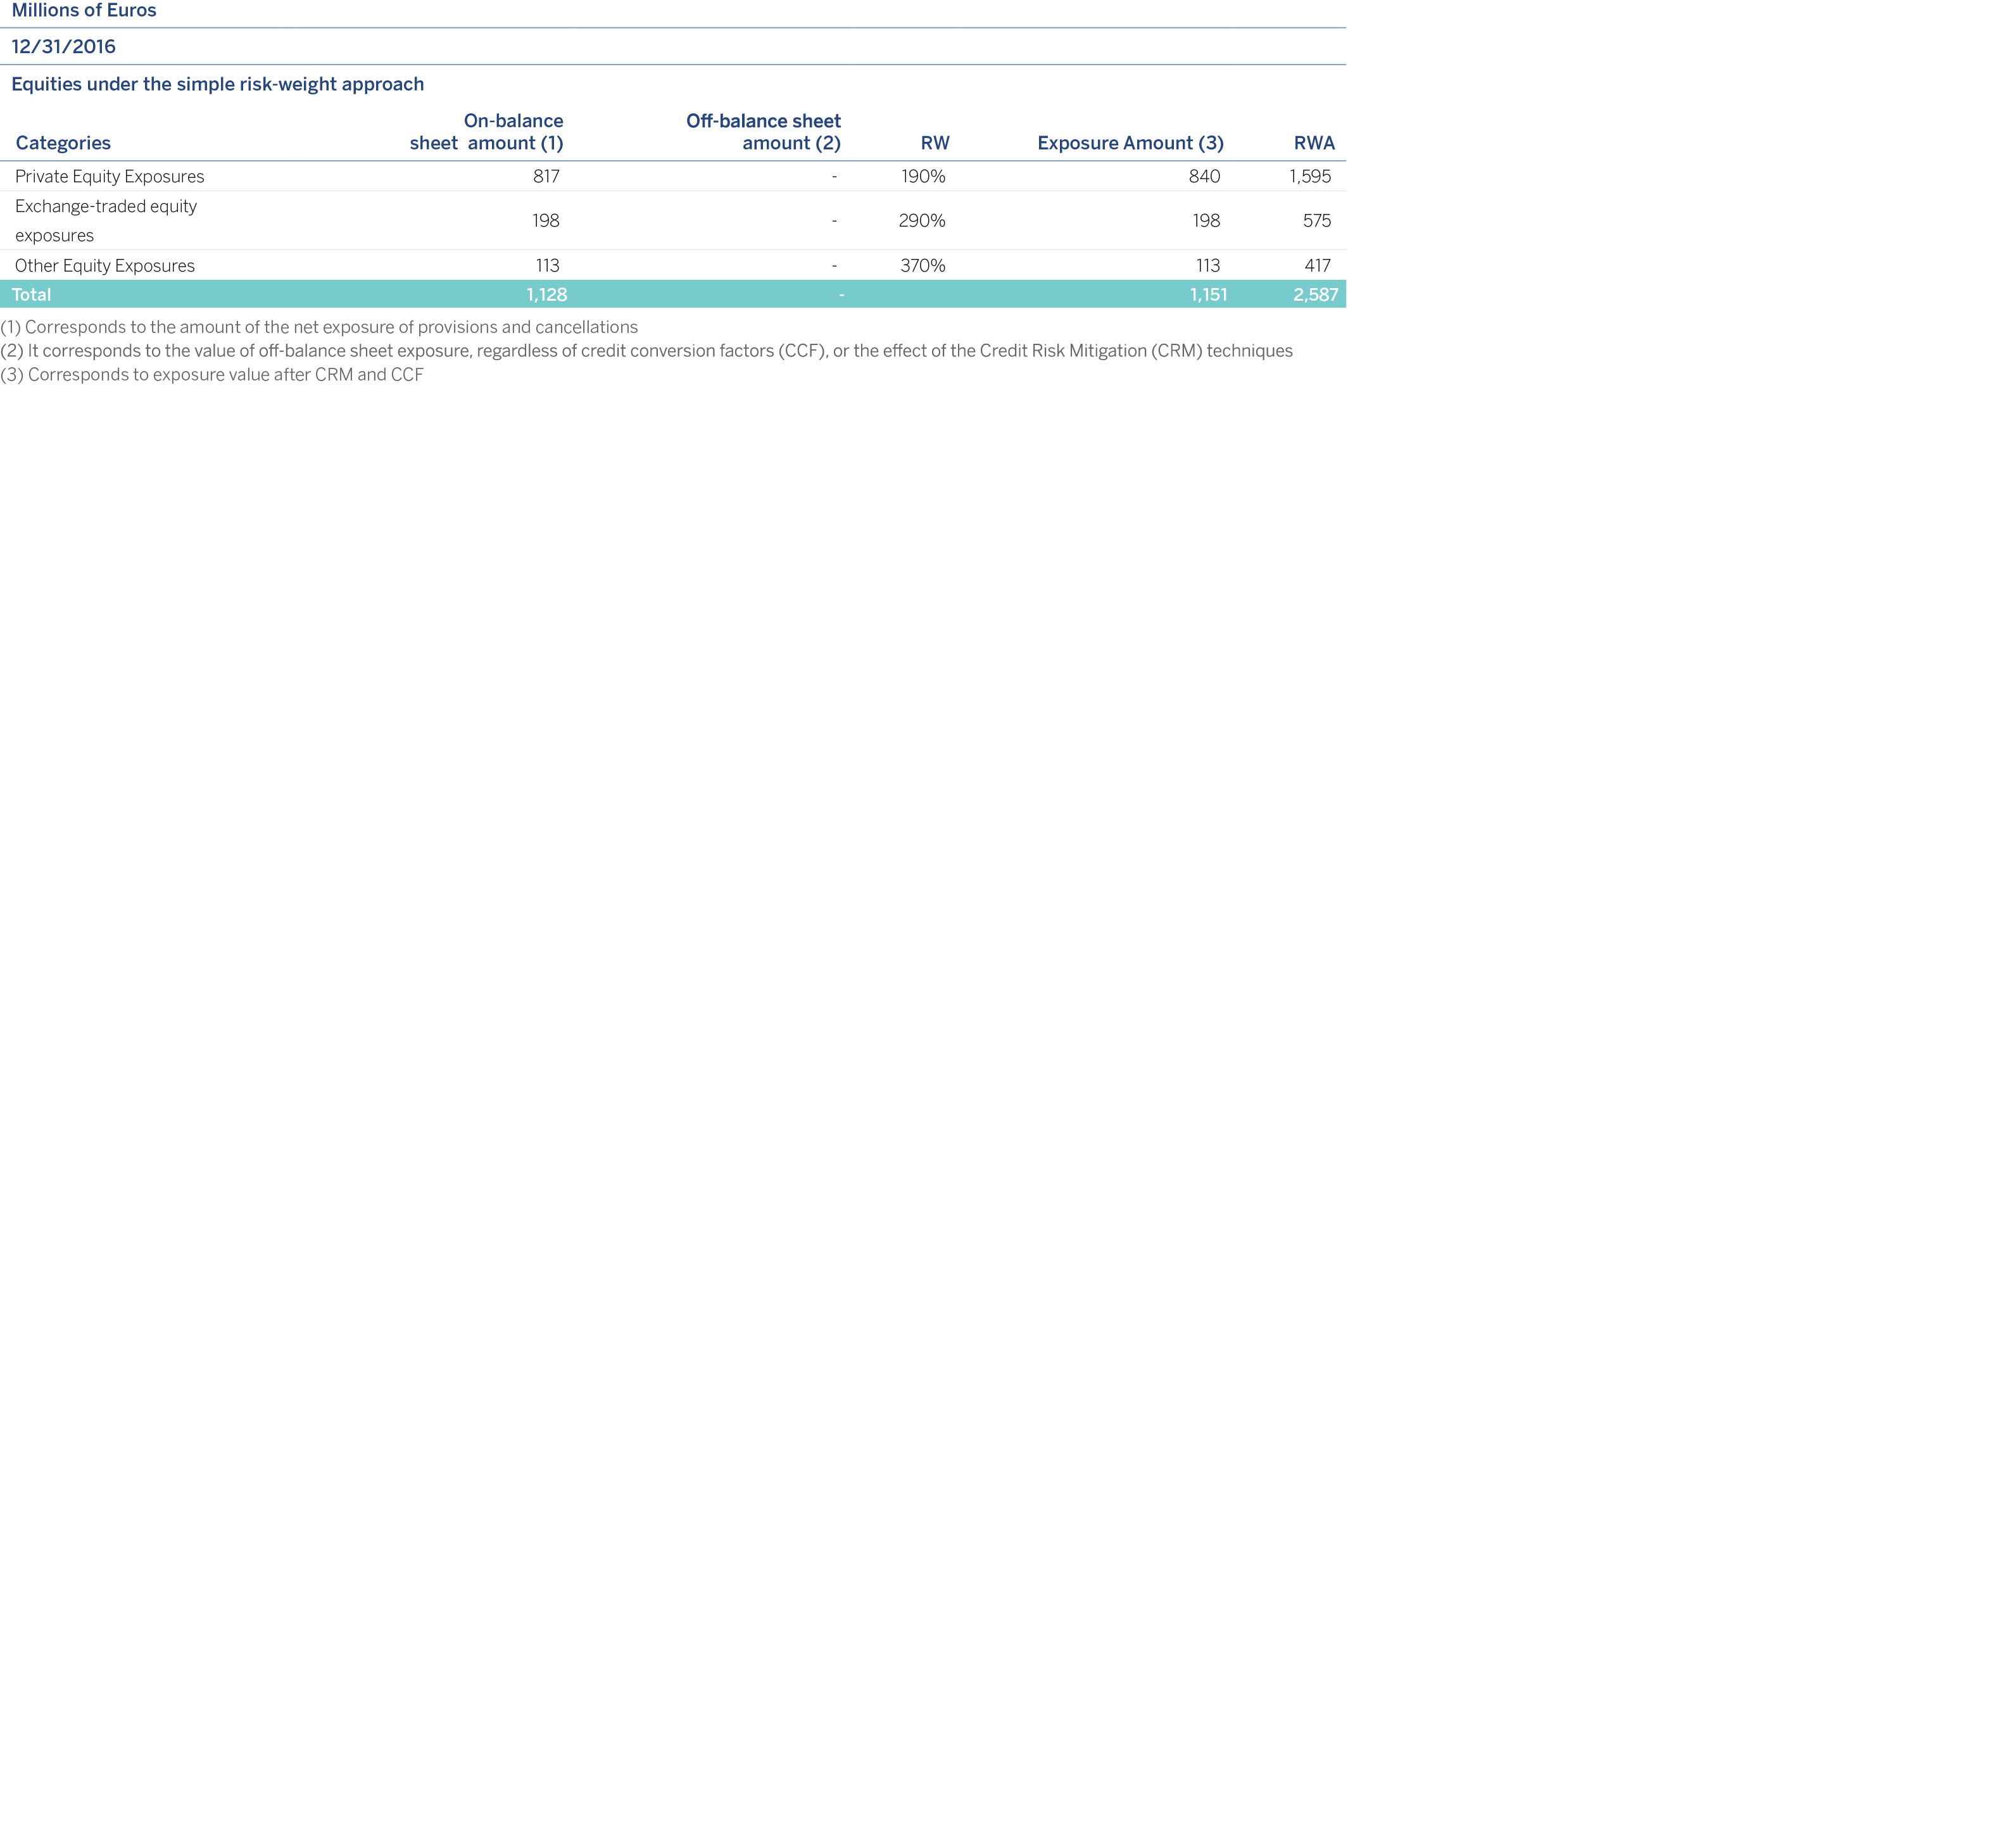
In addition, section 3.4 shows detailed information on structural equity risk.
Counterparty exposure involves that part of the original exposure corresponding to derivative instruments, repurchase and resale transactions, securities or commodities lending or borrowing transactions and deferred settlement transactions.
The following chart illustrates the amount in terms of EAD of the counterparty credit risk, broken down by product and risk:
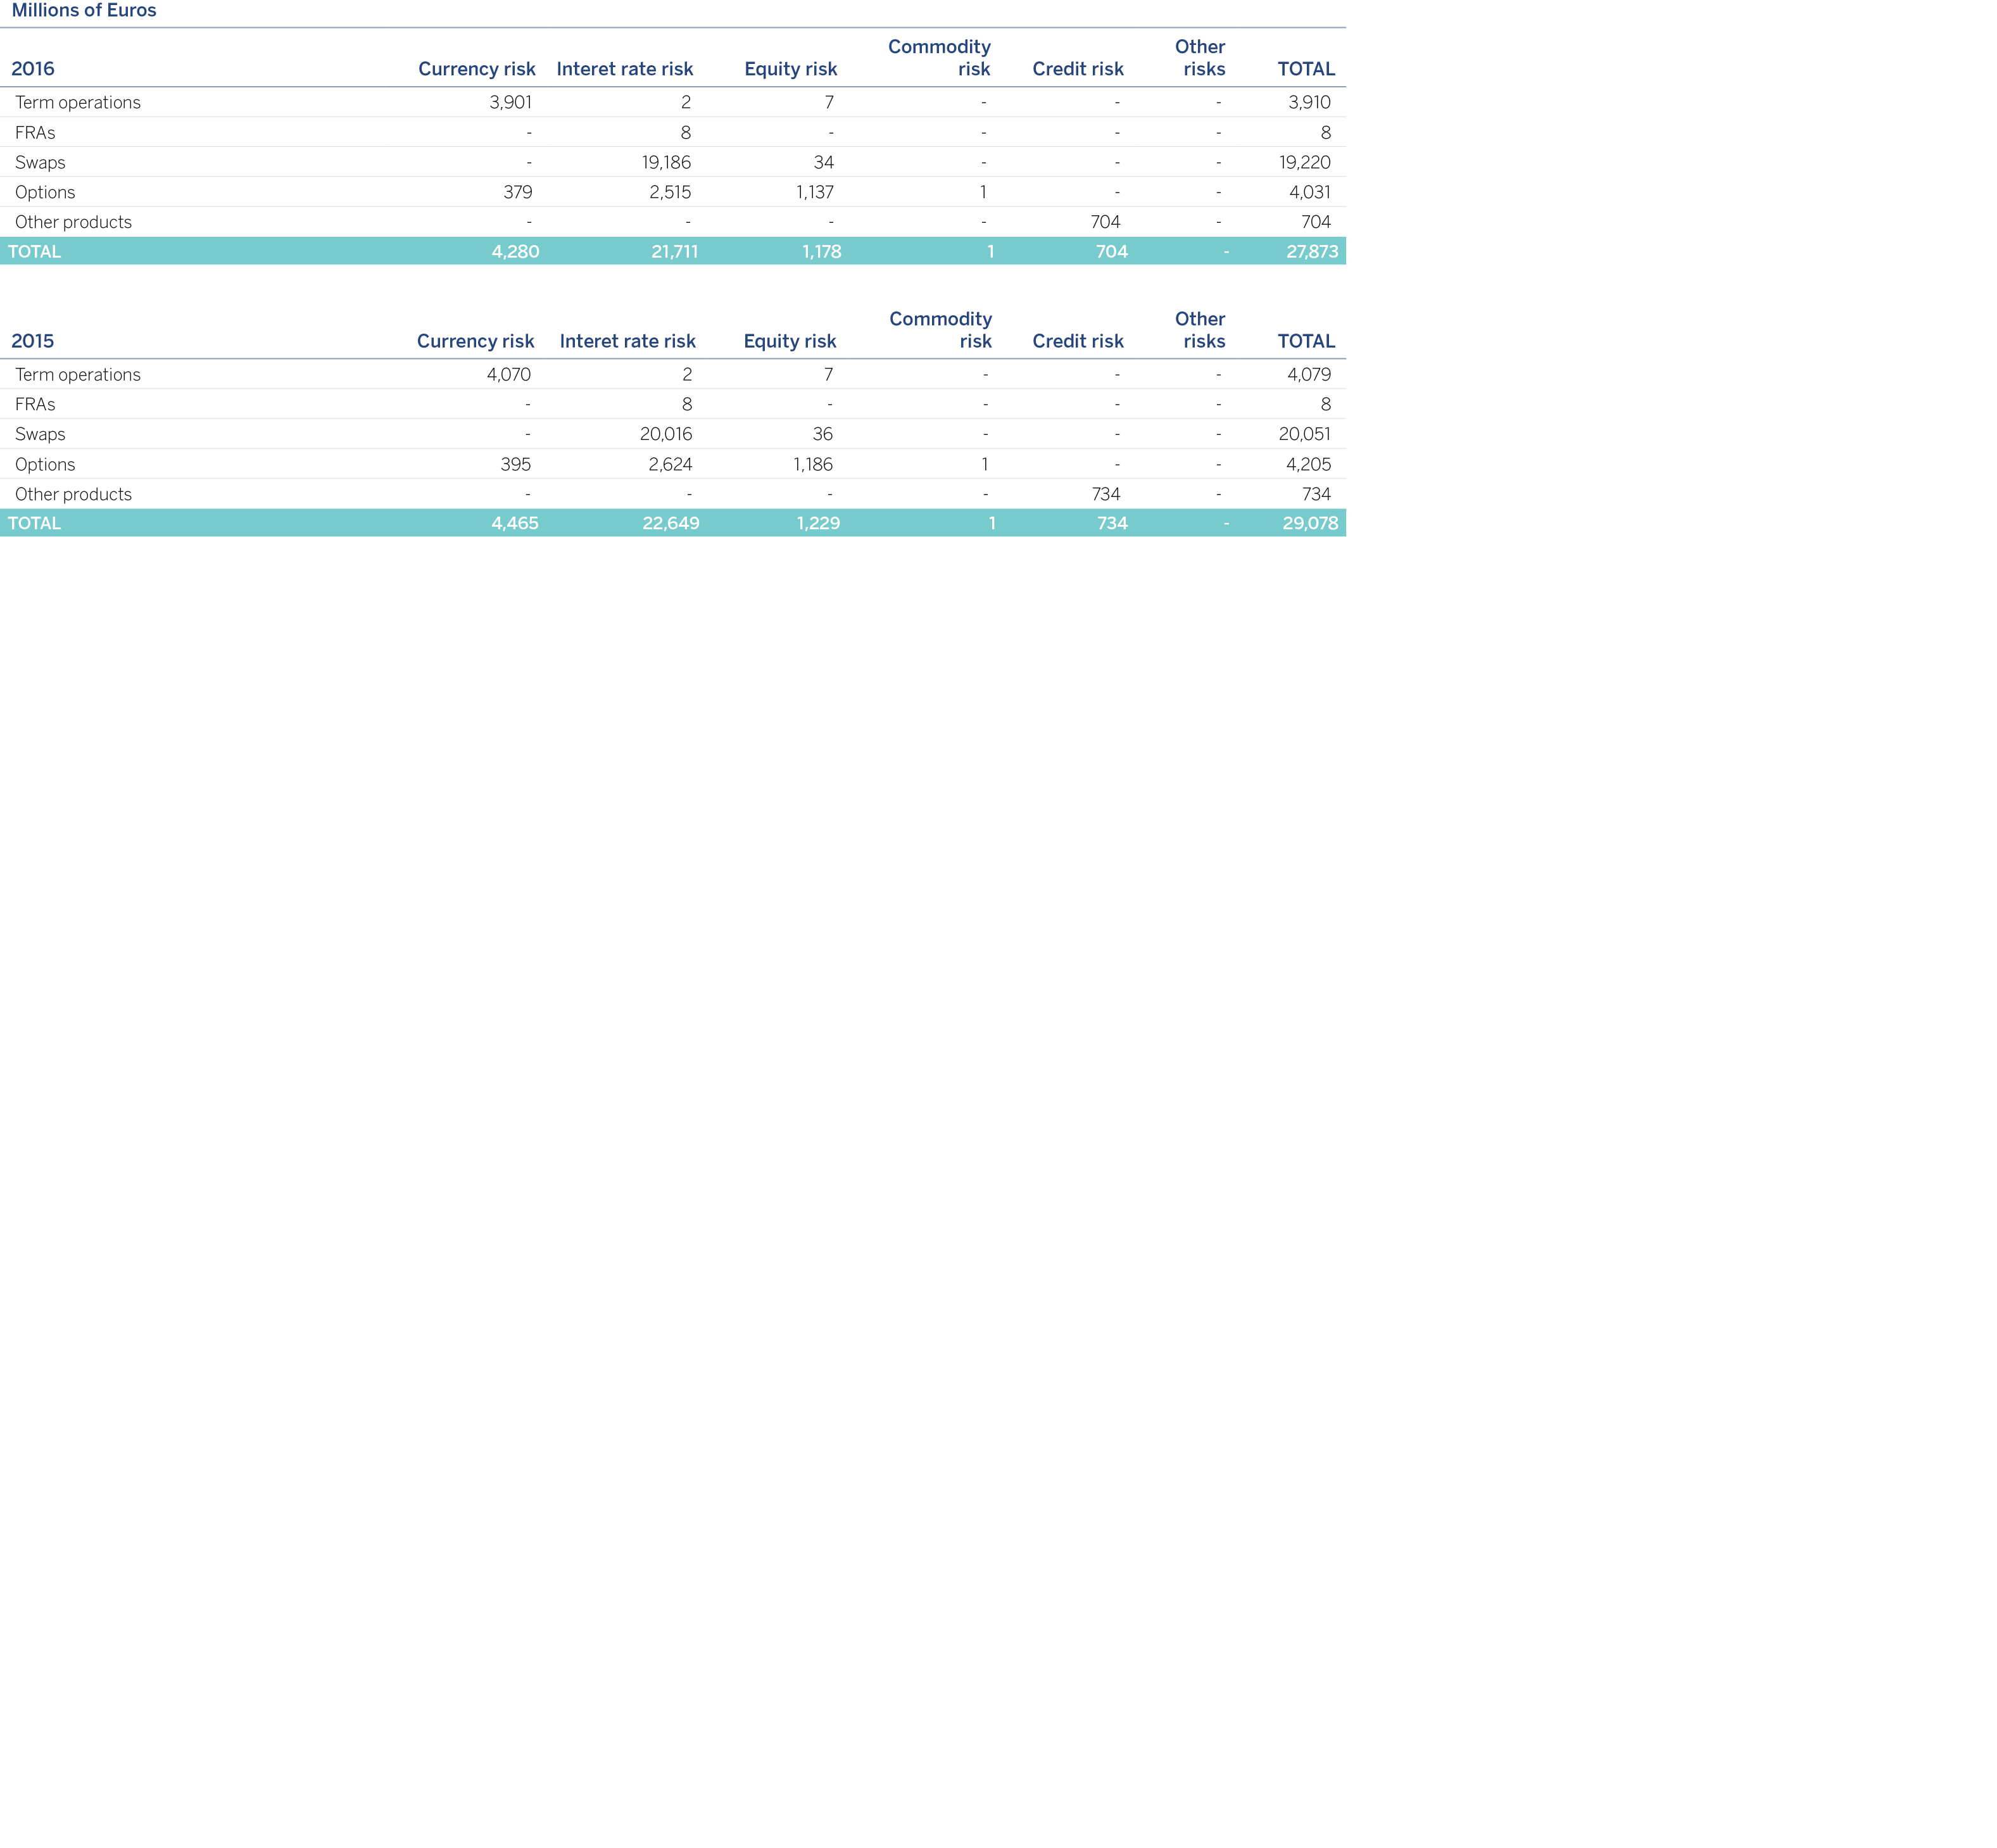

The Group has an economic model for calculating internal capital through exposure to counterparty credit risk in treasury operations. This model has been implemented in the Risk unit systems in Market areas. It is used to measure the credit exposures for each of the counterparties for which the entity operates.
The generation of exposures is undertaken in a manner that is consistent with those used for the monitoring and control of credit risk limits. The time horizon is divided up into intervals, and the market risk factors (interest rates, exchange rates, etc.) underlying the instruments that determine their valuation are simulated for each interval.
The exposures are generated from 500 different scenarios using the Monte Carlo method for risk factors (subject to counterparty credit risk) and applying the corresponding mitigating factors to each counterparty (i.e. applying collateral and/or netting agreements as applicable).
The correlations, loss given defaults, internal ratings and associated probabilities of default are consistent with the Group’s economic model for general credit risk.
The capital for each counterparty is then calculated using the exposure profile and taking into account the analytical formula adopted by Basel. This figure is modified by an adjustment factor for the possible maturity subsequent to one year of the operations in a similar vein to the general approach adopted by Basel for the treatment of credit risk.
Counterparty limits are specified within the financial programs authorized for each subsidiary within the line item of treasury limits. It stipulates both the limit and the maximum term for the operation.
The businesses that generate counterparty credit risk are subject to risk limits that control both bilateral risk and risk with CCPs. When setting these limits for each business area, and to ensure their correct application, the corresponding capital consumption and revenue generated by this operation are taken into account.
There is also a risks committee that analyzes individually the most significant transactions to evaluate (among other aspects) the relationship between profitability and risk.
The use of transactions within the limits is measured in terms of mark-to-market valuation plus the potential risk using the Monte Carlo Simulation methodology (95% confidence level) and bearing in mind possible mitigating factors (such as netting, break clauses or collateral contracts).
Management of consumption by lines in the Markets area is carried out through a corporate platform that enables online monitoring of the limits and availabilities established for the different counterparties and clients. This control is completed by independent units of the business area to guarantee proper segregation of functions.
The Group negotiates agreements with its customers to mitigate counterparty credit risk within the legal frameworks applicable in each of the countries where it operates. These agreements regulate the exchange of guarantees as a mechanism to reduce exposure derived from transactions that generate counterparty credit risk.
The assets covered by these agreements include cash, as well as financial assets with a high asset quality. In addition, the agreements with customers include mechanisms that allow the immediate replacement of the collateral if its quality is impaired (for example, a reduction in the market value or adverse changes in the asset rating).
Mitigation by netting transactions and by collateral only reduces the consumption of limits and capital if there is a positive opinion on their immediate effectiveness in case of the counterparty's default or insolvency.
The MENTOR tool has been specifically designed to store and process the collateral contracts concluded with counterparties. This application enables the existence of collateral to be taken into account at the transaction level (useful for controlling and monitoring the status of specific operations) as well as at the counterparty level. Furthermore, said tool feeds the applications responsible for estimating counterparty credit risk by providing all the necessary parameters for considering the impact of mitigation in the portfolio due to the agreements signed.
Likewise, there is also an application that reconciles and adjusts the positions serving the Collateral and Risks units.
In order to guarantee the effectiveness of collateral contracts, the Group carries out a daily monitoring of the market values of the operations governed by such contracts and of the deposits made by the counterparties. Once the amount of the collateral to be delivered or received is obtained, the collateral demand (margin call), or the demand received, is carried out at the intervals established in the contract, usually daily.
If significant variations arise from the process of reconciliation between the counterparties, after a reconciliation in economic terms they are reported by the Collateral unit to the Risks unit for subsequent analysis and monitoring. Within the control process, the Collateral unit issues a daily report on the guarantees which includes a description by counterparty of the exposure and collateral, making special reference to those guarantee deficits at or beyond the set warning levels.
Financial assets and liabilities may be the object of netting, in other words presentation for a net amount in the balance sheet, only when the Group's entities comply with the provisions of IAS 32 - Paragraph 42, and thus have the legally obliged right to offset the amounts recognized, and the intention to settle the net amount or to divest the asset and pay the liability at the same time.
In addition, the Group has assets and liabilities on the balance sheet that are not netted and for which there are master netting agreements, but for which there is neither the intention nor the right to settle. The most common types of events that trigger netting of reciprocal obligations include the bankruptcy of the credit institution in question, swiftly accumulating indebtedness, default, restructuring or the winding up of the entity.
In the current market context, derivatives are contracted under different framework contracts, with the most general being those developed by International Swaps and Derivatives Association (ISDA), and for the Spanish market the Framework Financial Operations Contract (FAFT). Practically all portfolio derivative operations have been concluded under these master contracts, including in them the netting clauses referred to in the above point as Master Netting Agreements, considerably reducing the credit exposure in these instruments. In addition, in the contracts concluded with professional counterparties, annexes are included with collateral agreements called Credit Support Annexes (CSA), thus minimizing exposure to a possible counterparty insolvency.
At the same time, the Group has a high volume of assets bought and sold under repurchase agreements traded through clearing houses that use mechanisms to reduce counterparty credit risk, as well as through various master contracts in bilateral operations, the most common being the Global Master Repurchase Agreement (GMRA), which is published by the International Capital Market Association (ICMA). This tends to have clauses added relating to the exchange of collateral within the main body of the master contract itself.
The following summary table presents the potential effects of netting and collateral agreements in derivative operations as of December 31, 2016:
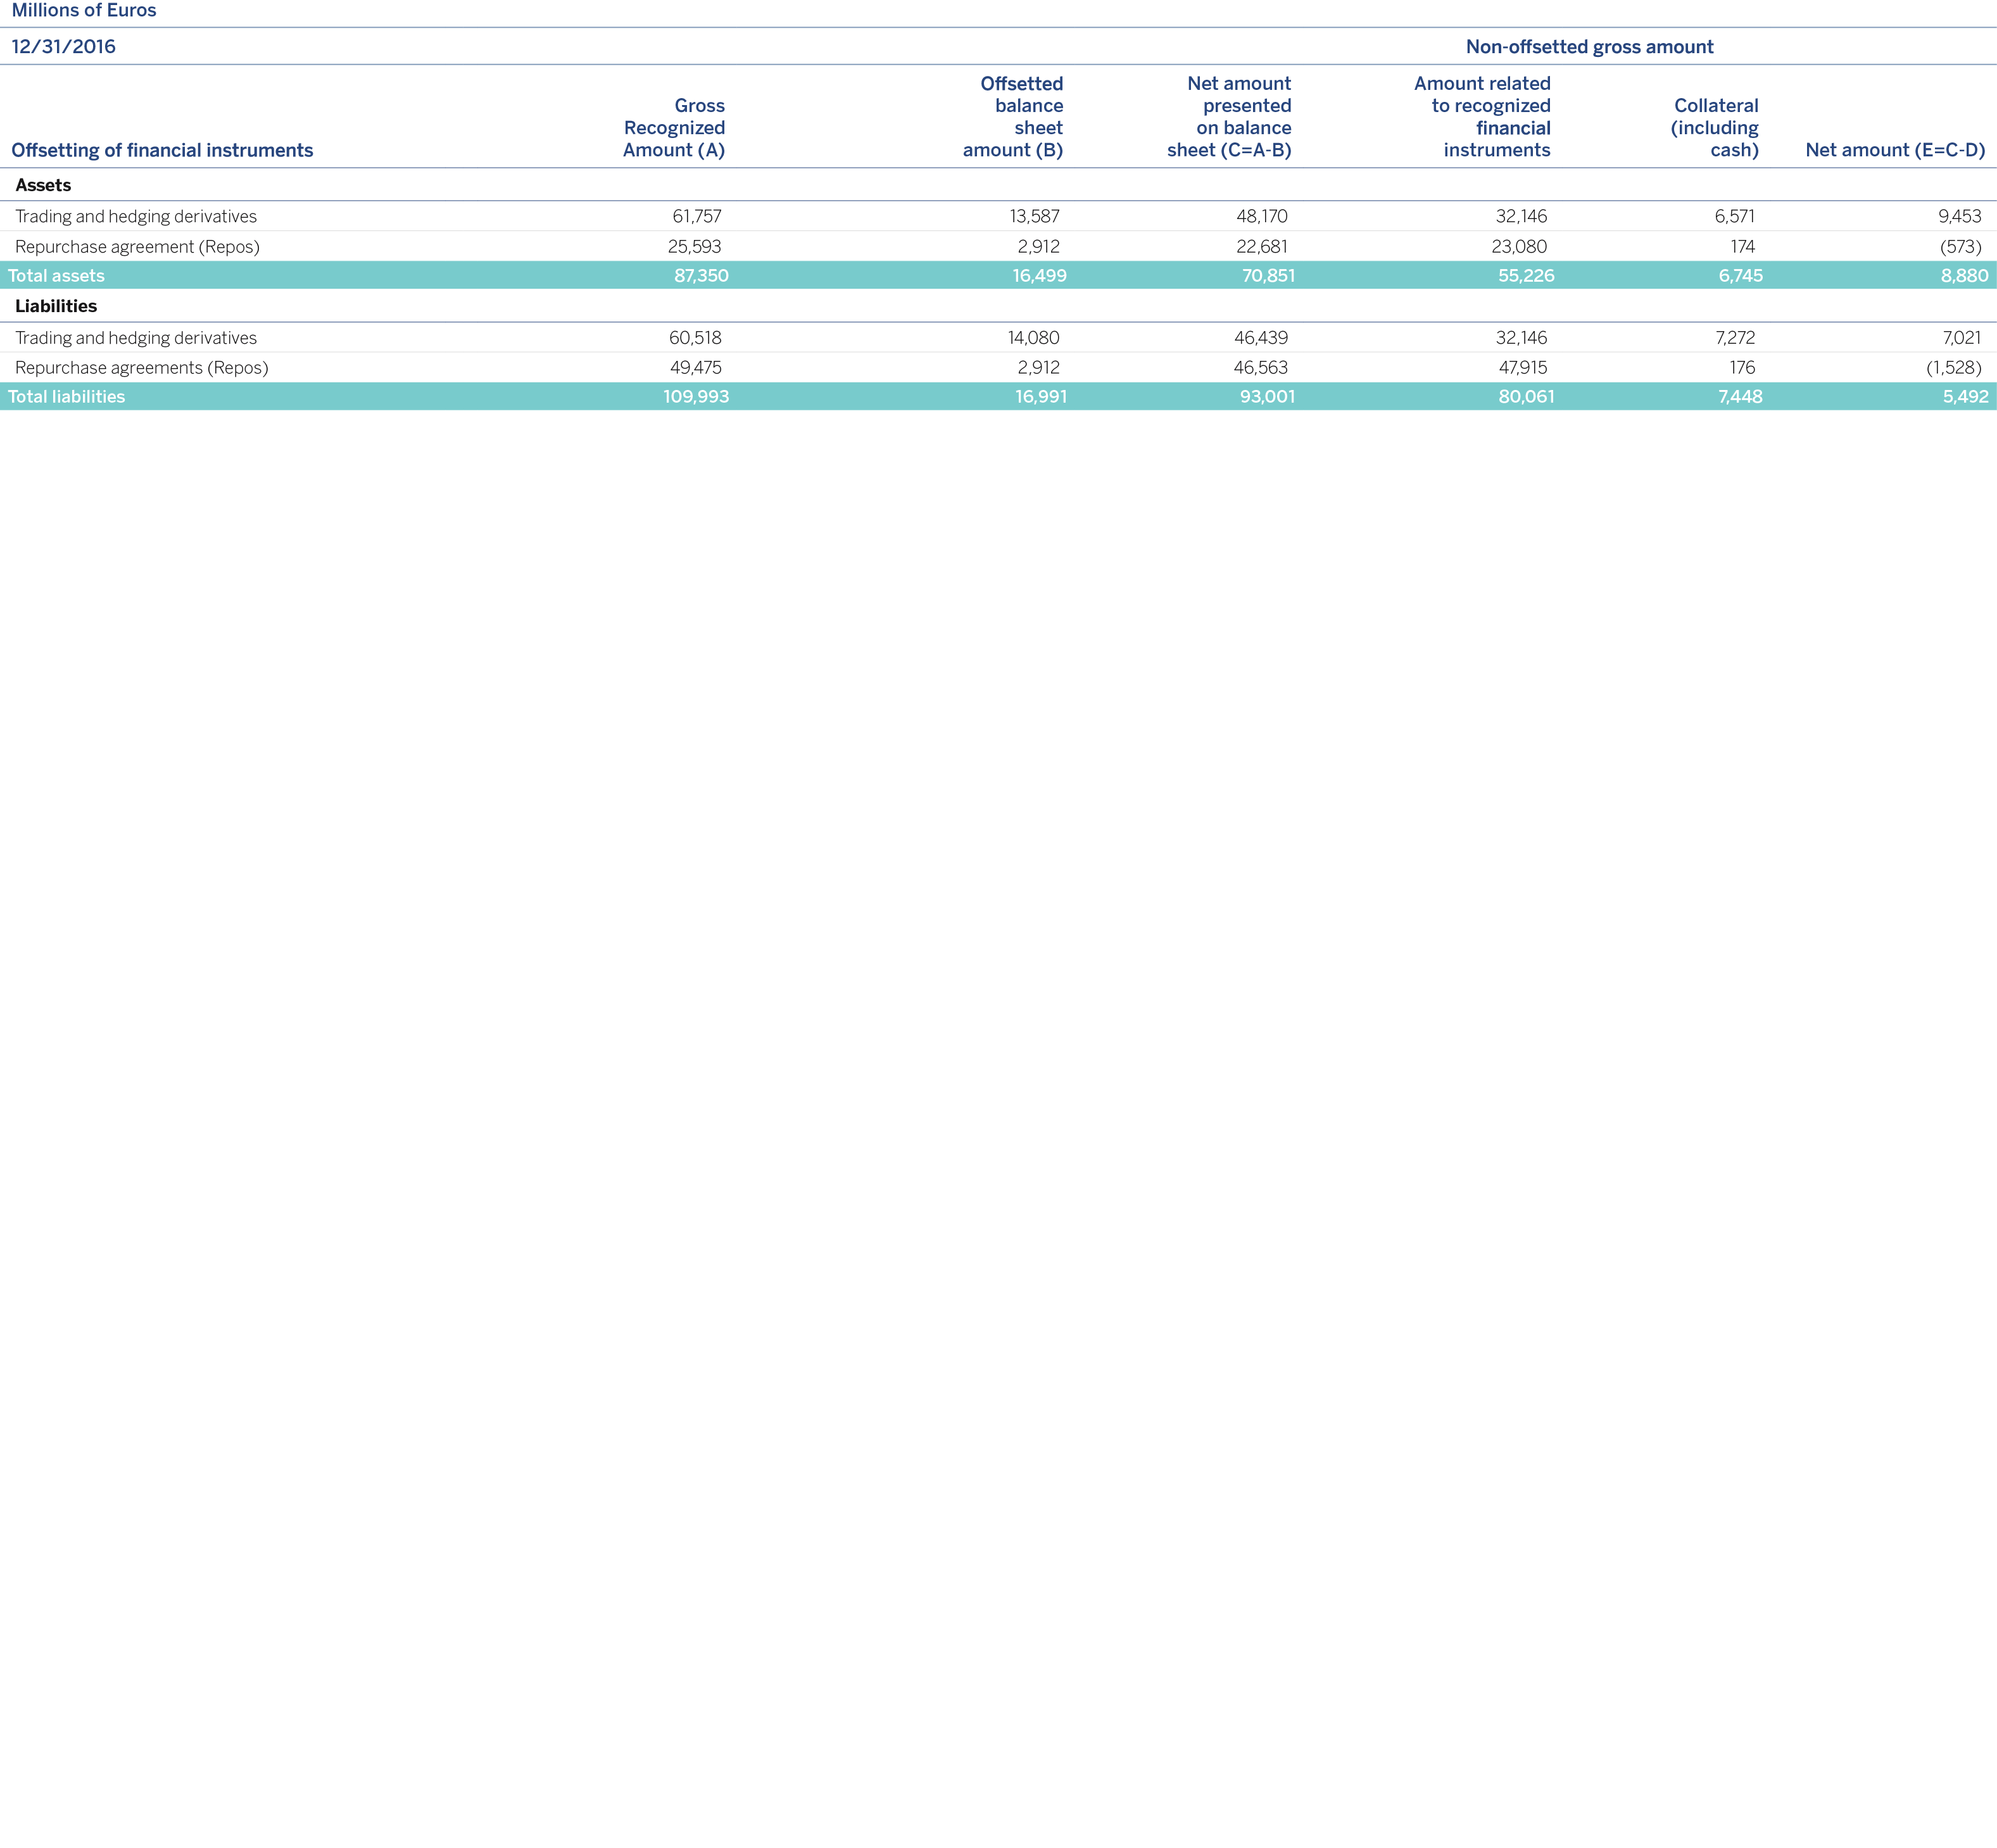
Derivatives contracts may give rise to potential adverse correlation effects between the exposure to the counterparty and its credit quality me (wrong-way-exposures).
The Group has specific policies for treating these kinds of exposures, which establish:
How to identify transactions subject to adverse correlation risk.
A specific admission procedure transaction by transaction.
Measurements appropriate to the risk profile with adverse correlation.
Control and monitoring of the operation.
Regarding derivatives operations, as a general policy, the Group does not subscribe collateral contracts that involve an increase in the amount to be deposited in the event of the Group being downgraded.
The general criterion applied to date with banking counterparties is to establish a zero threshold within collateral contracts, irrespective of the mutual rating; provision will be made as collateral of any difference that arises through mark-to-market valuation.
The original exposure for the counterparty credit risk of derivatives, according to Chapter 6 of the CRR, can be calculated using the following methods: original risk, mark-to-market valuation, standardized and internal models.
The Group calculates the value of exposure to risk through the mark-to-market method, obtained as the aggregate of the positive mark-to-market value after contractual netting agreements plus the potential future risk of each transaction or instrument.
Below is a breakdown of the amount in terms of original exposure, EAD and RWAs:
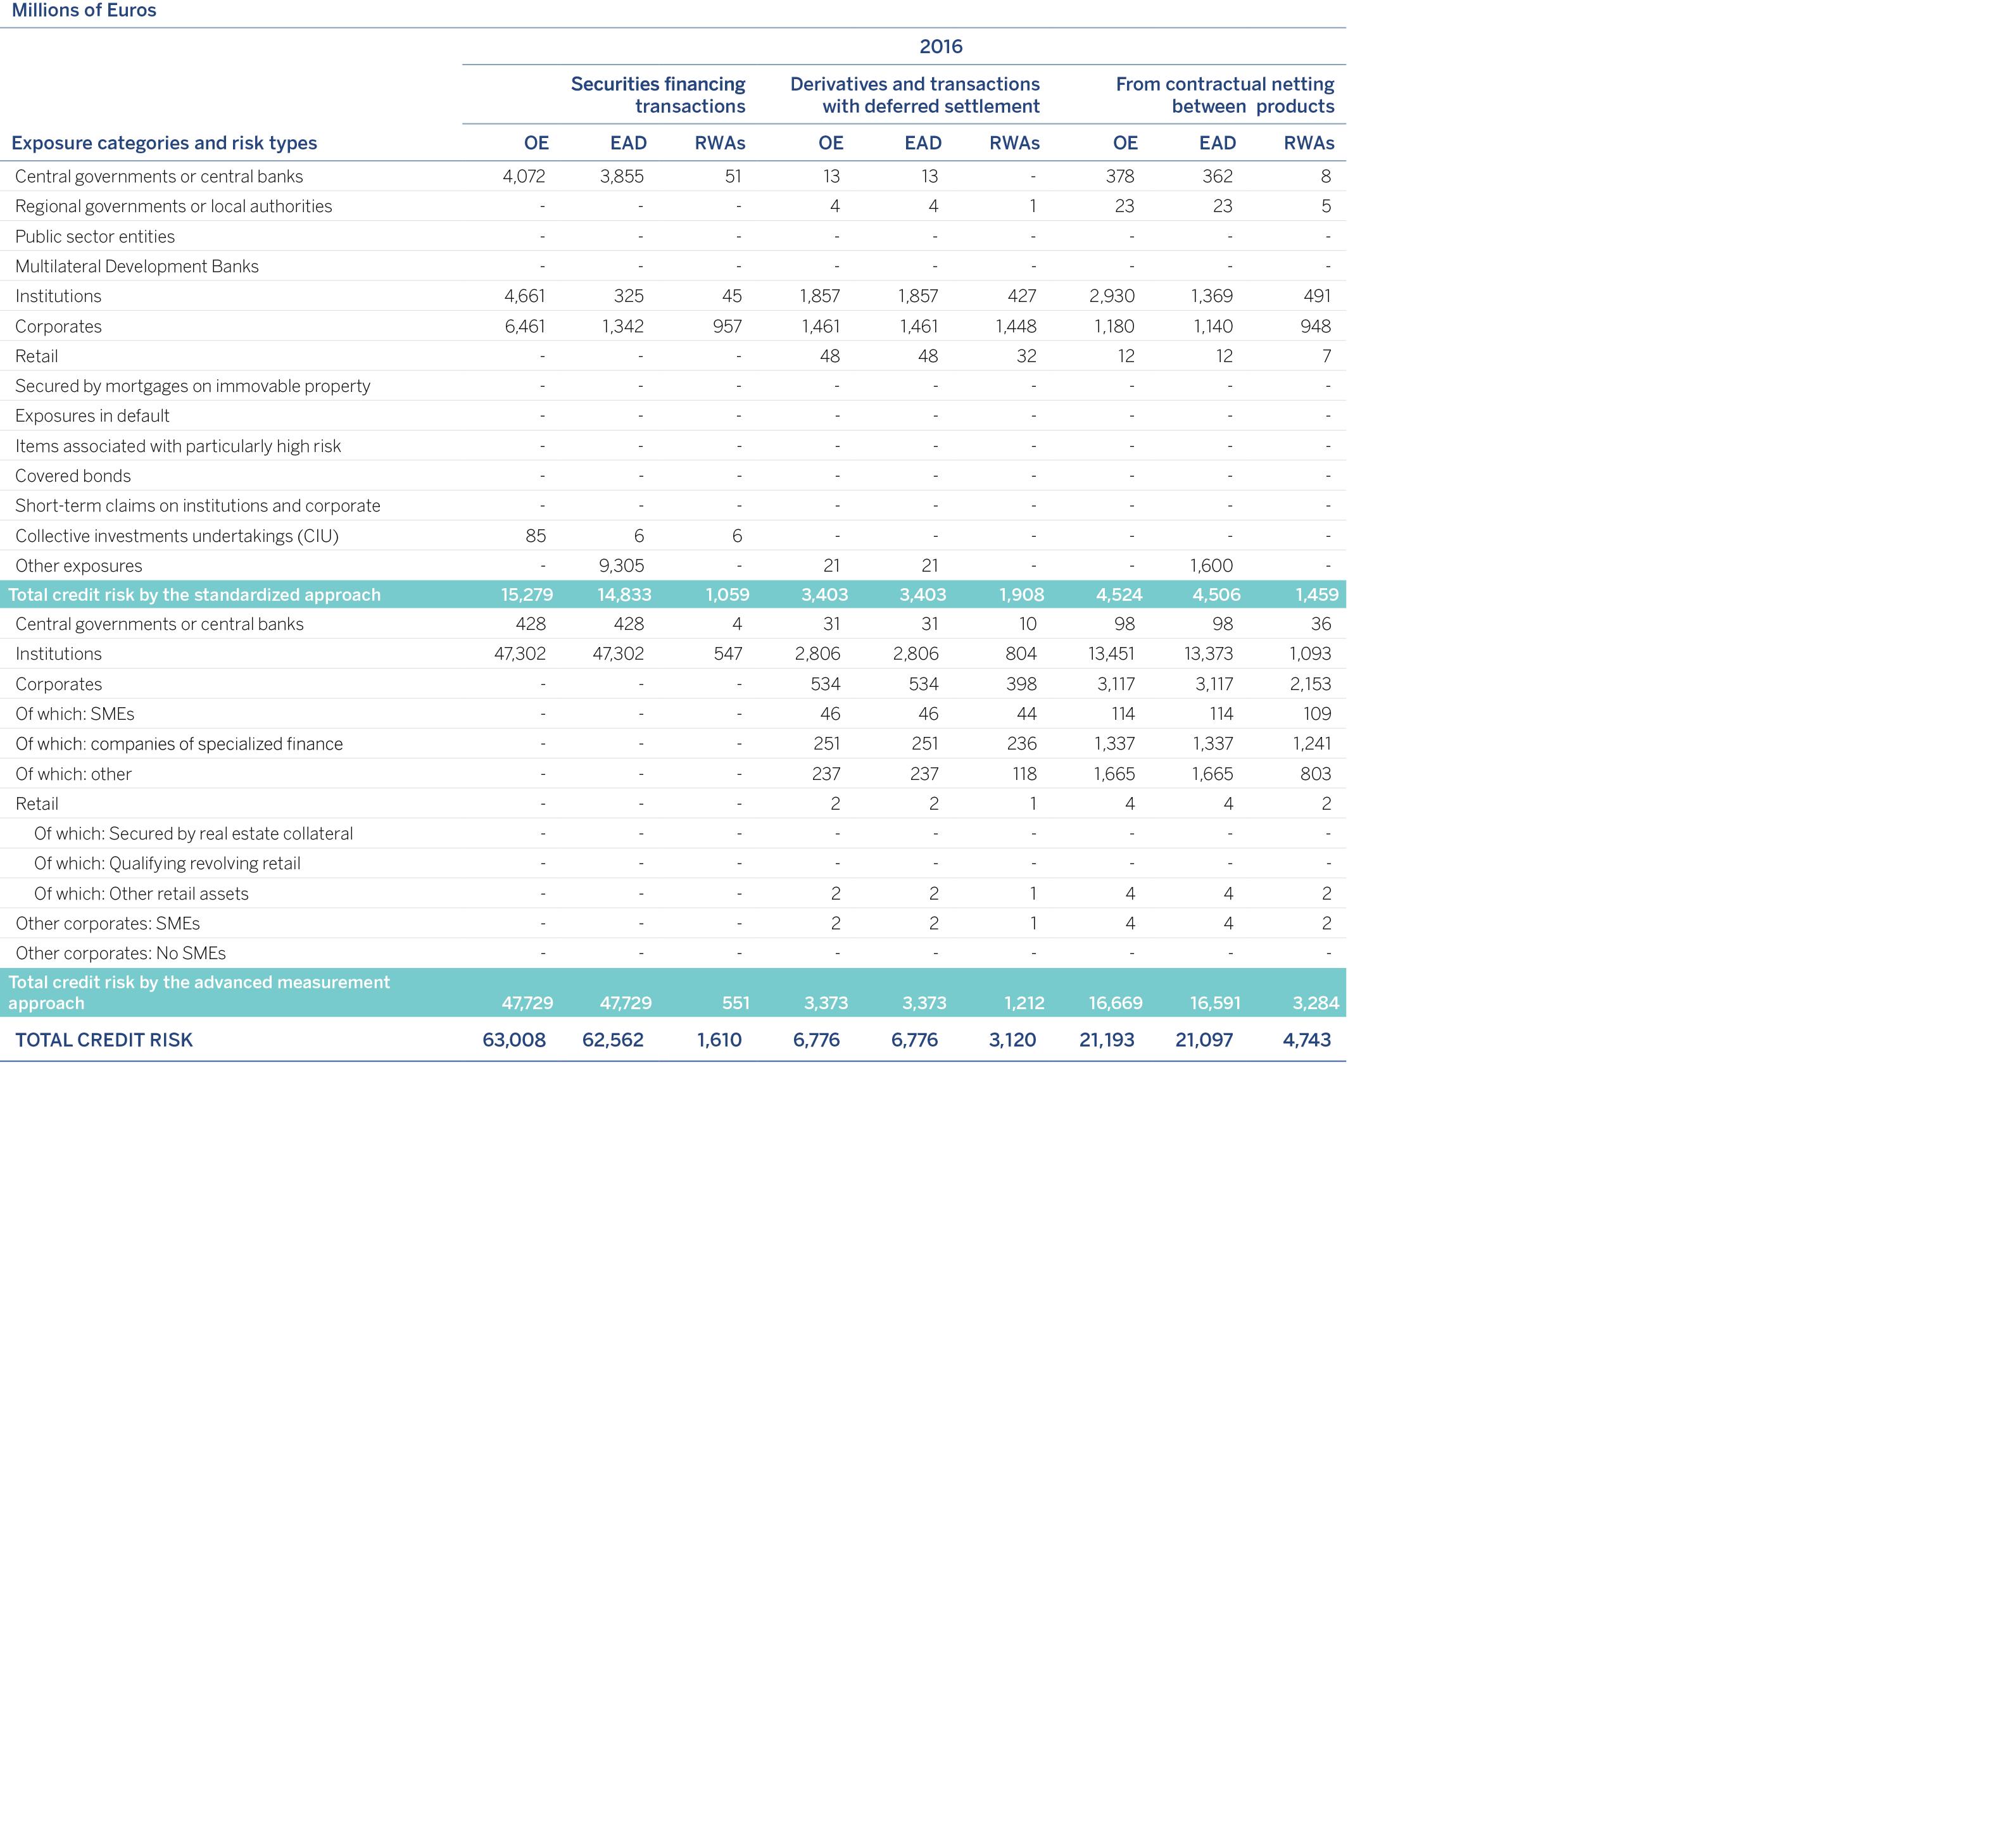
The amounts shown in the table above on credit risk include the counterparty credit risk in trading-book activity as shown below:
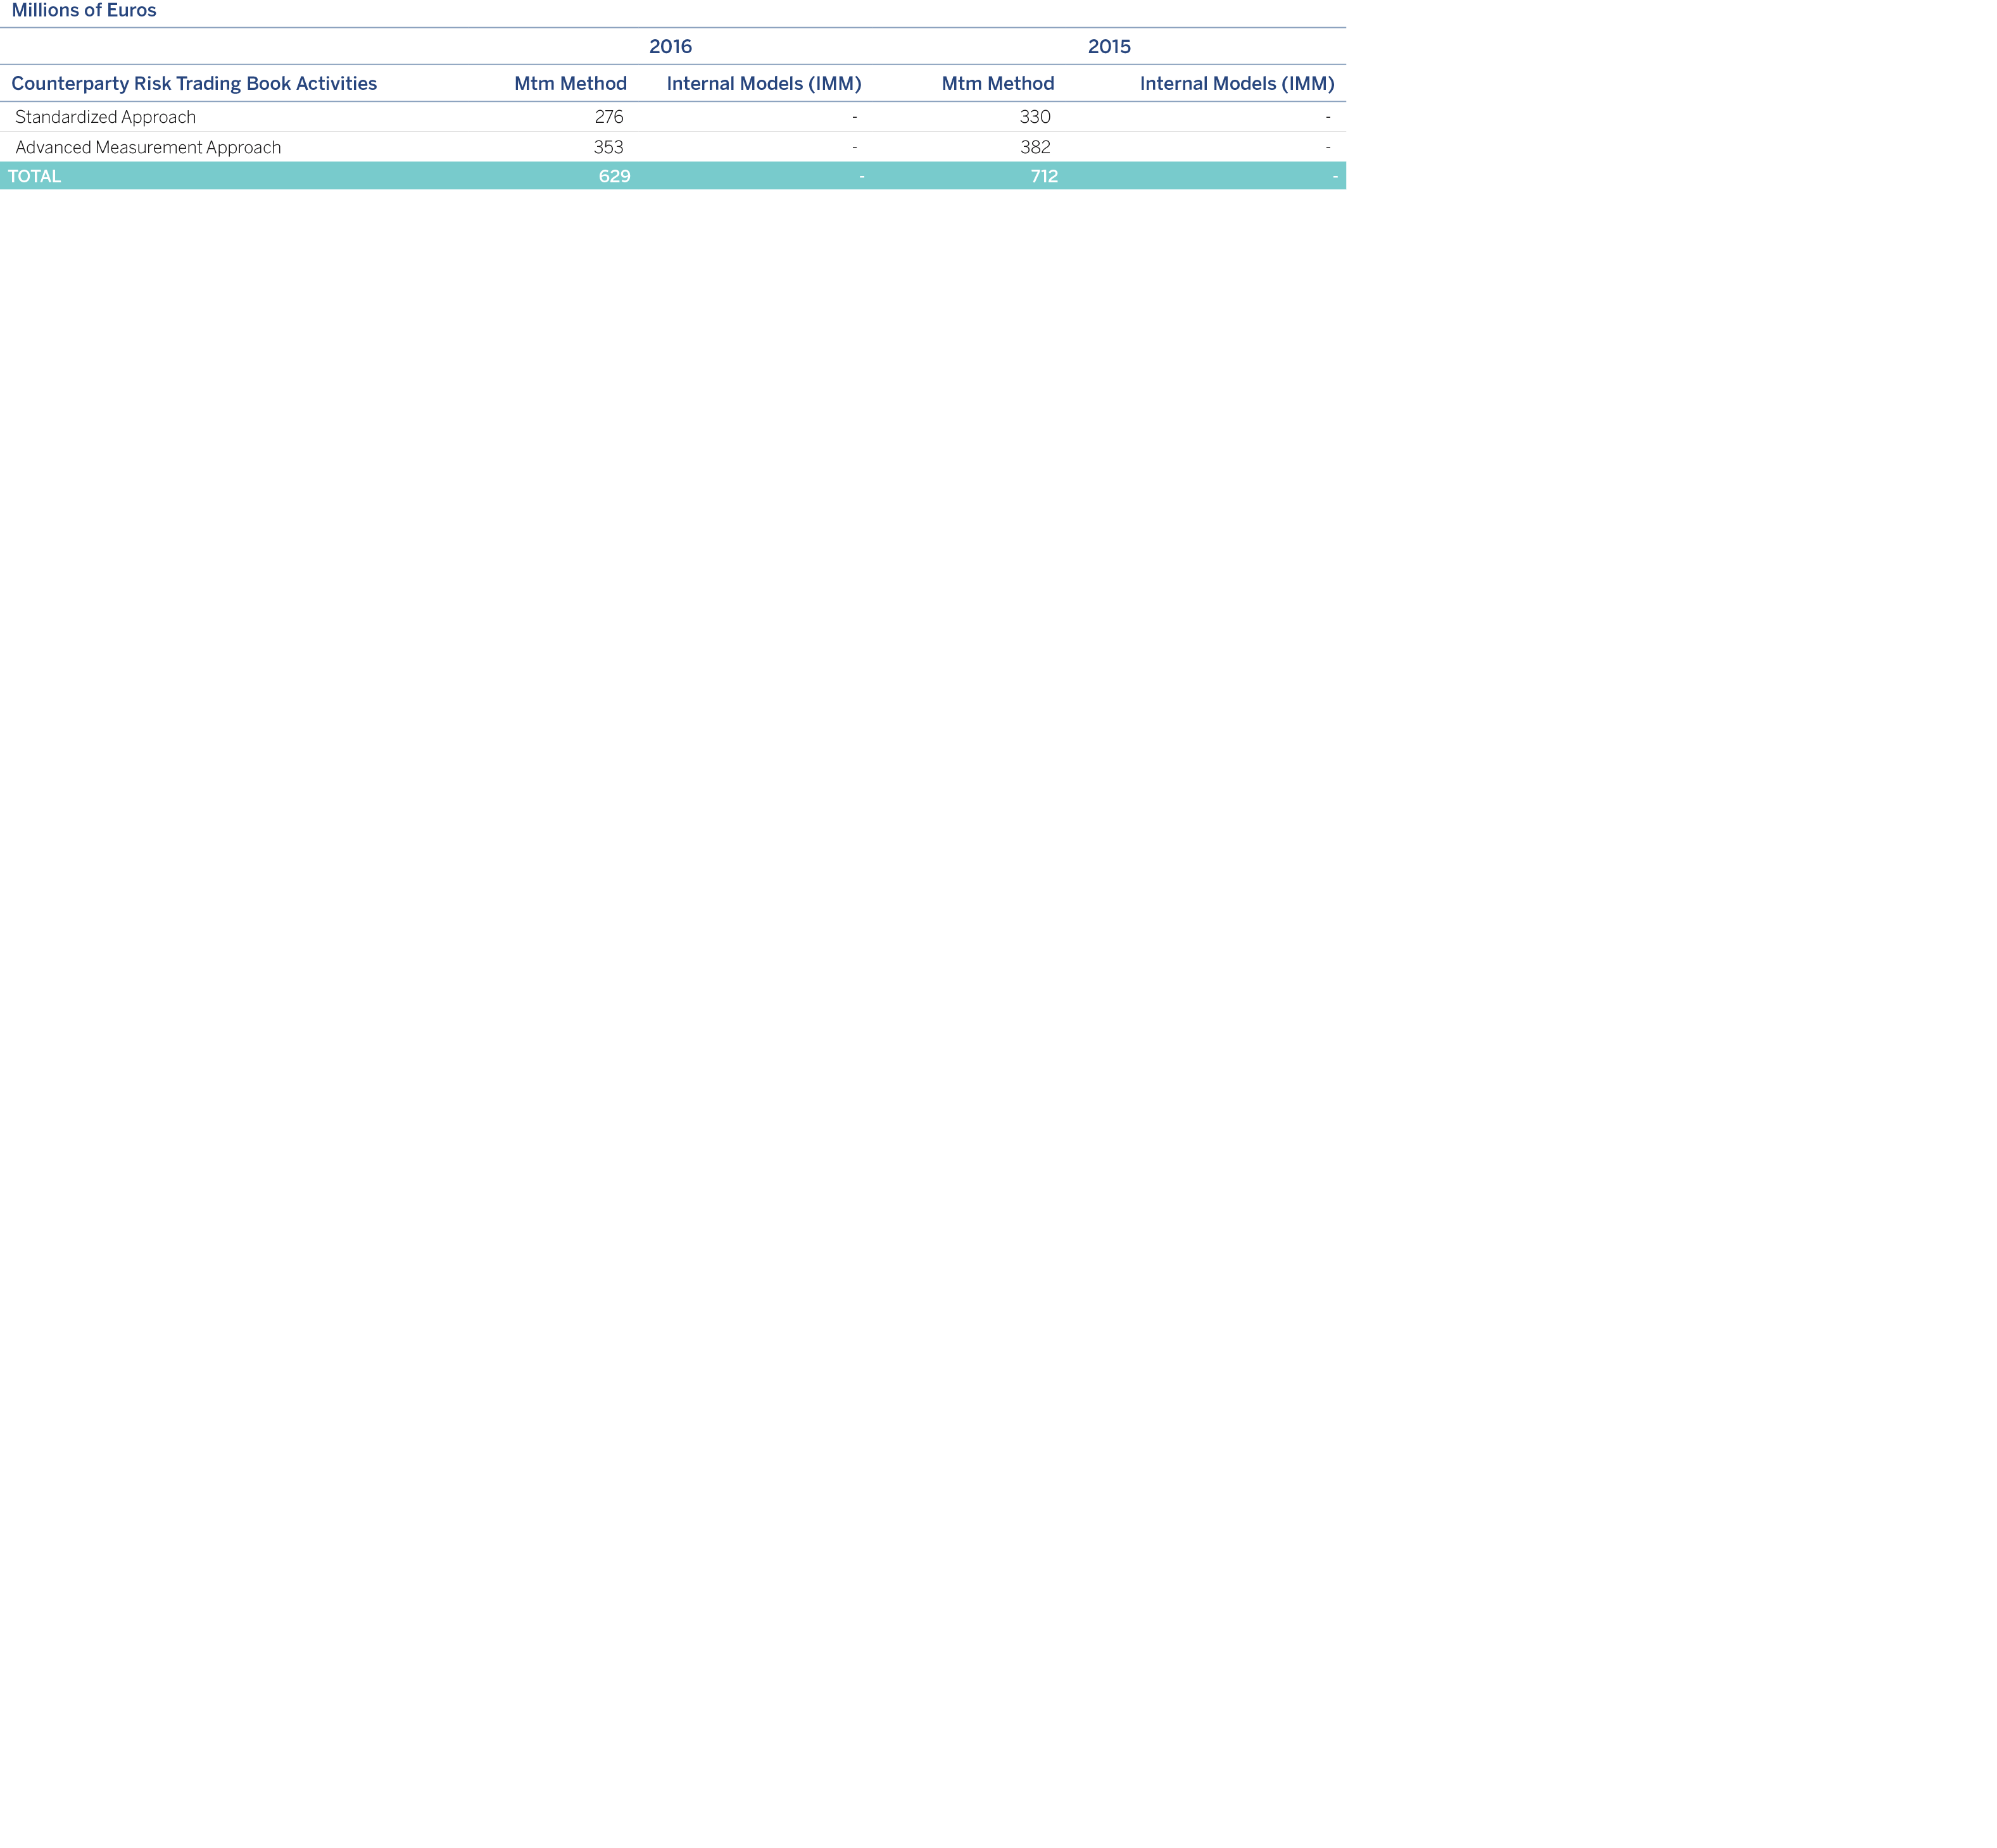
The Group currently has a totally residual amount of capital requirements for trading-book activity liquidation risk.
The following table presents the amounts in million euros involved in the counterparty credit risk of derivatives as of December 31, 2016 and December 31, 2015:
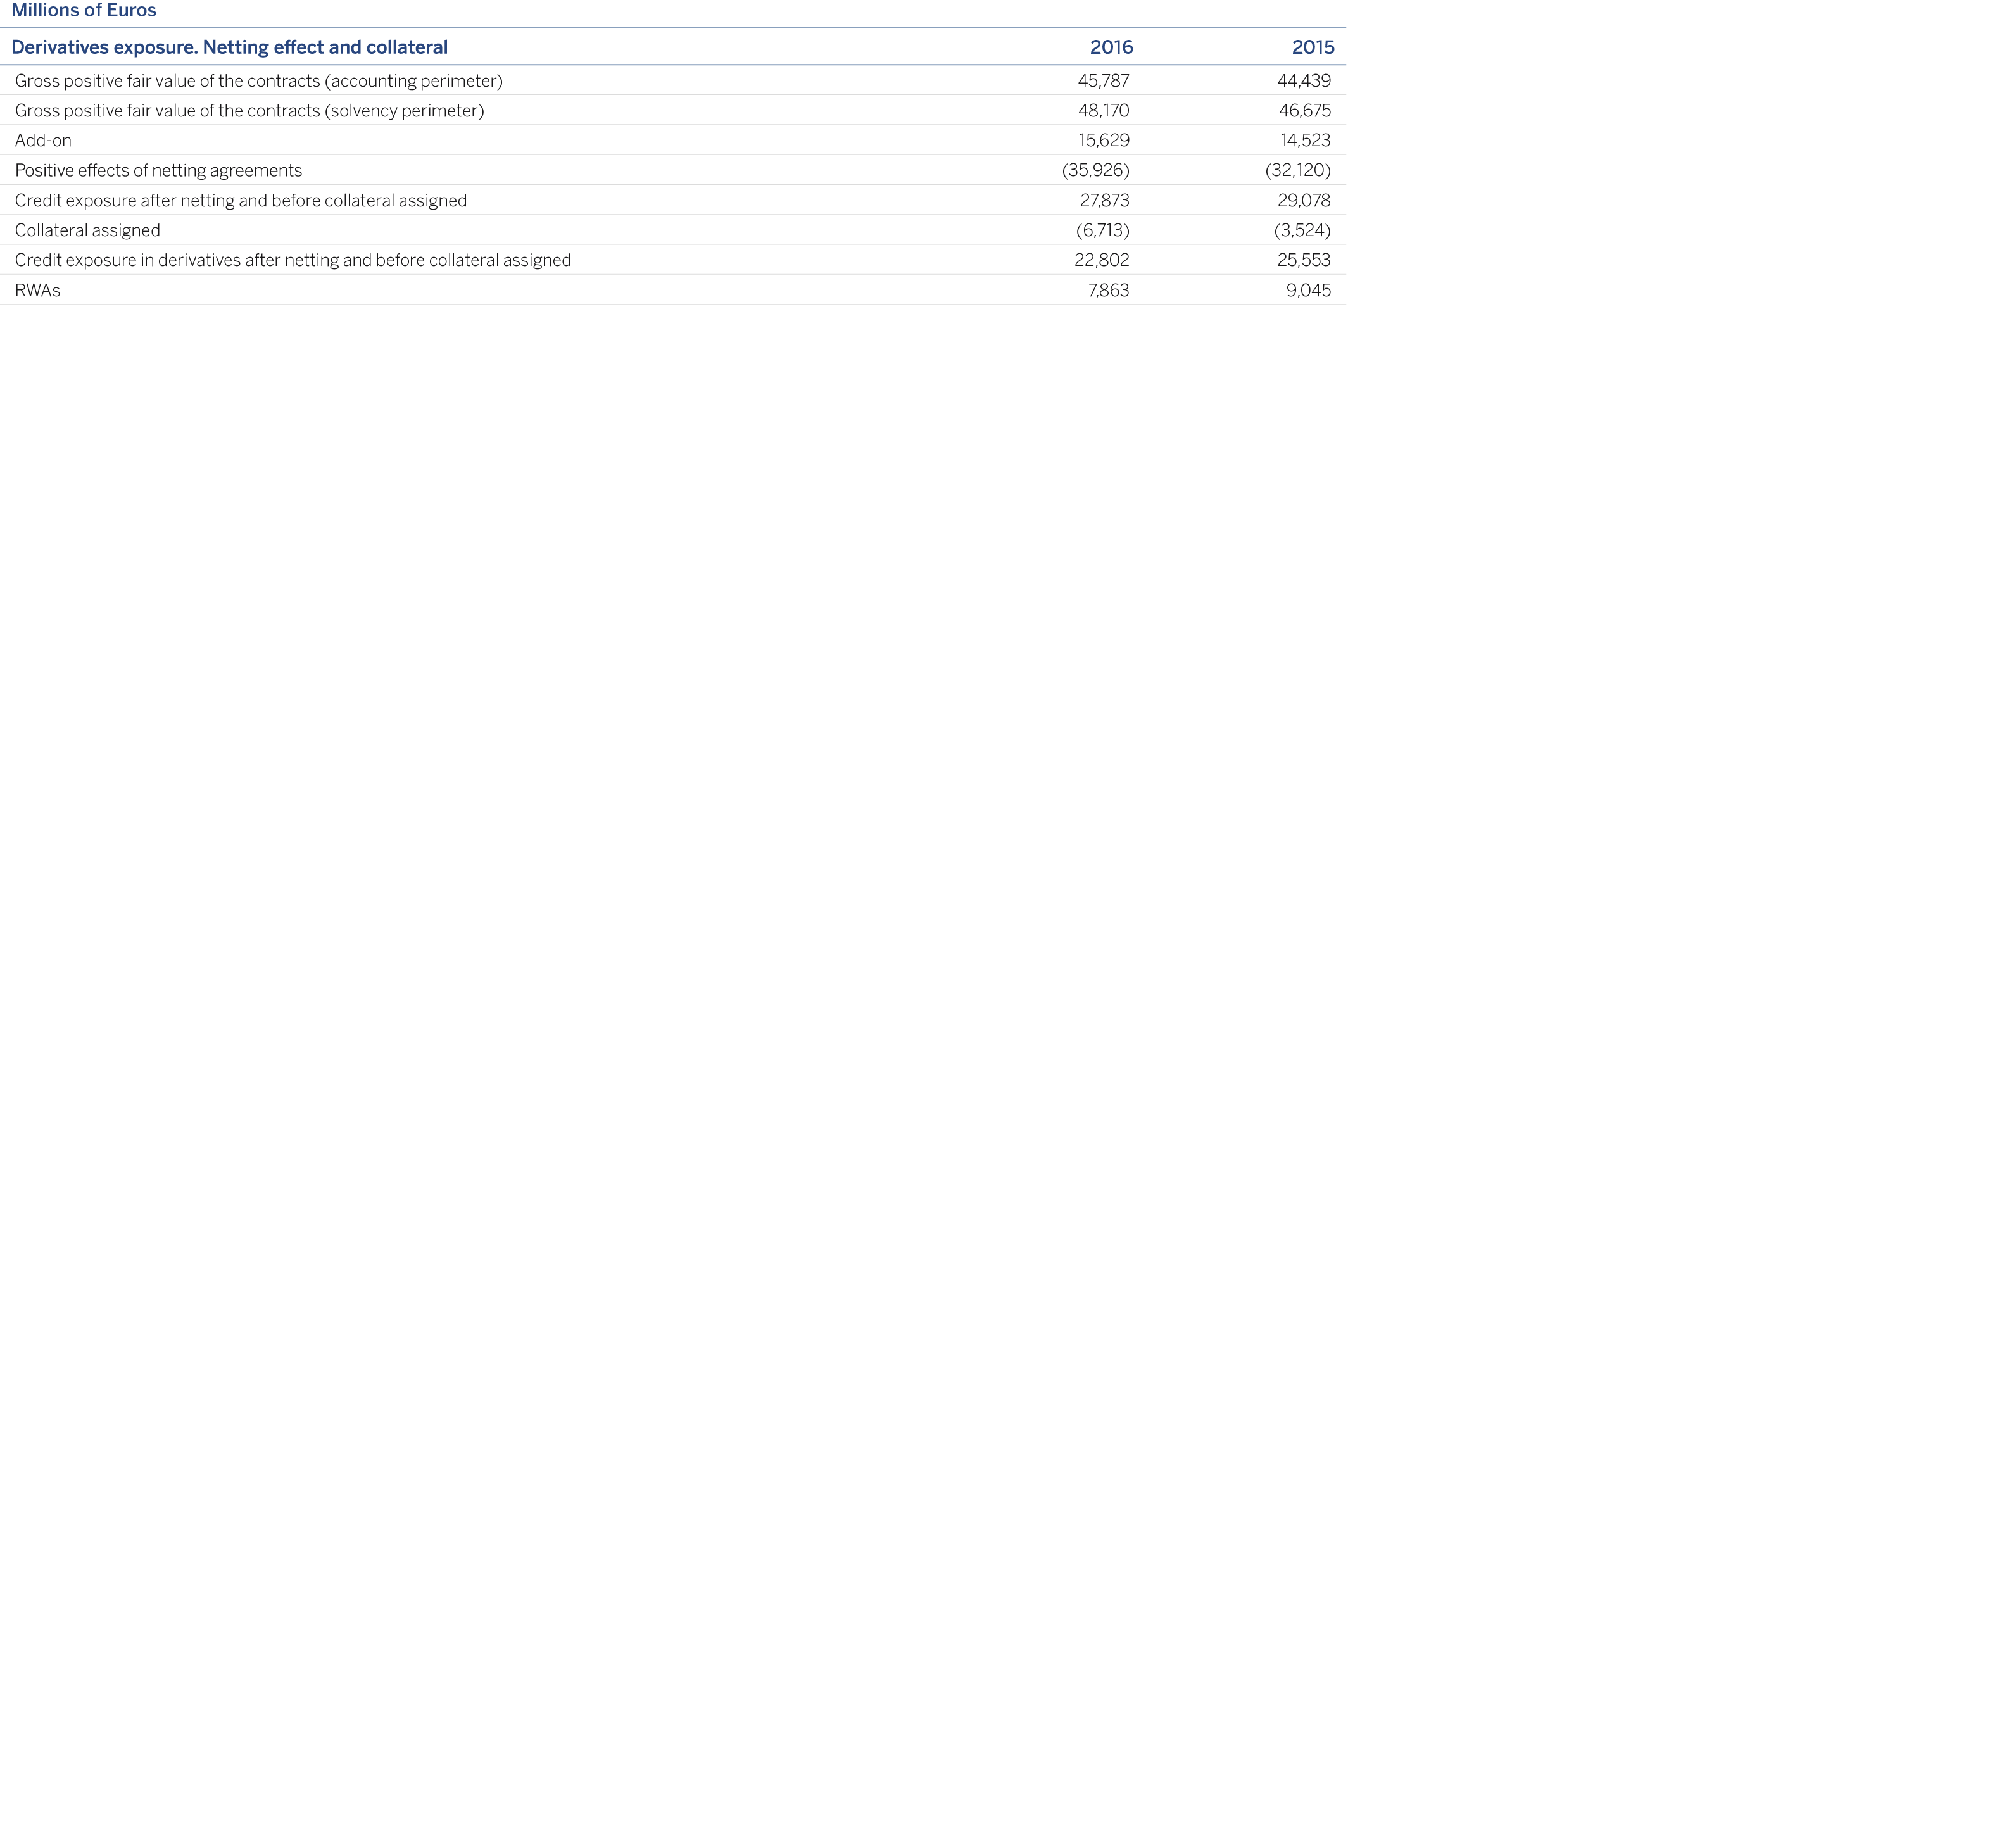
The total exposure to counterparty credit risk, composed basically of repo transactions and OTC derivatives, is €91,435 million and €80,465 million, as of December 31, 2016 and 2015, respectively (after applying any netting agreements applicable).
Below is a complete overview of the methods used to calculate the regulatory requirements for counterparty credit risk and the main parameters of each method (excluding requirements for CVA and exposures offset through a CCP, which are shown in tables CCR2 and CCR8, respectively).
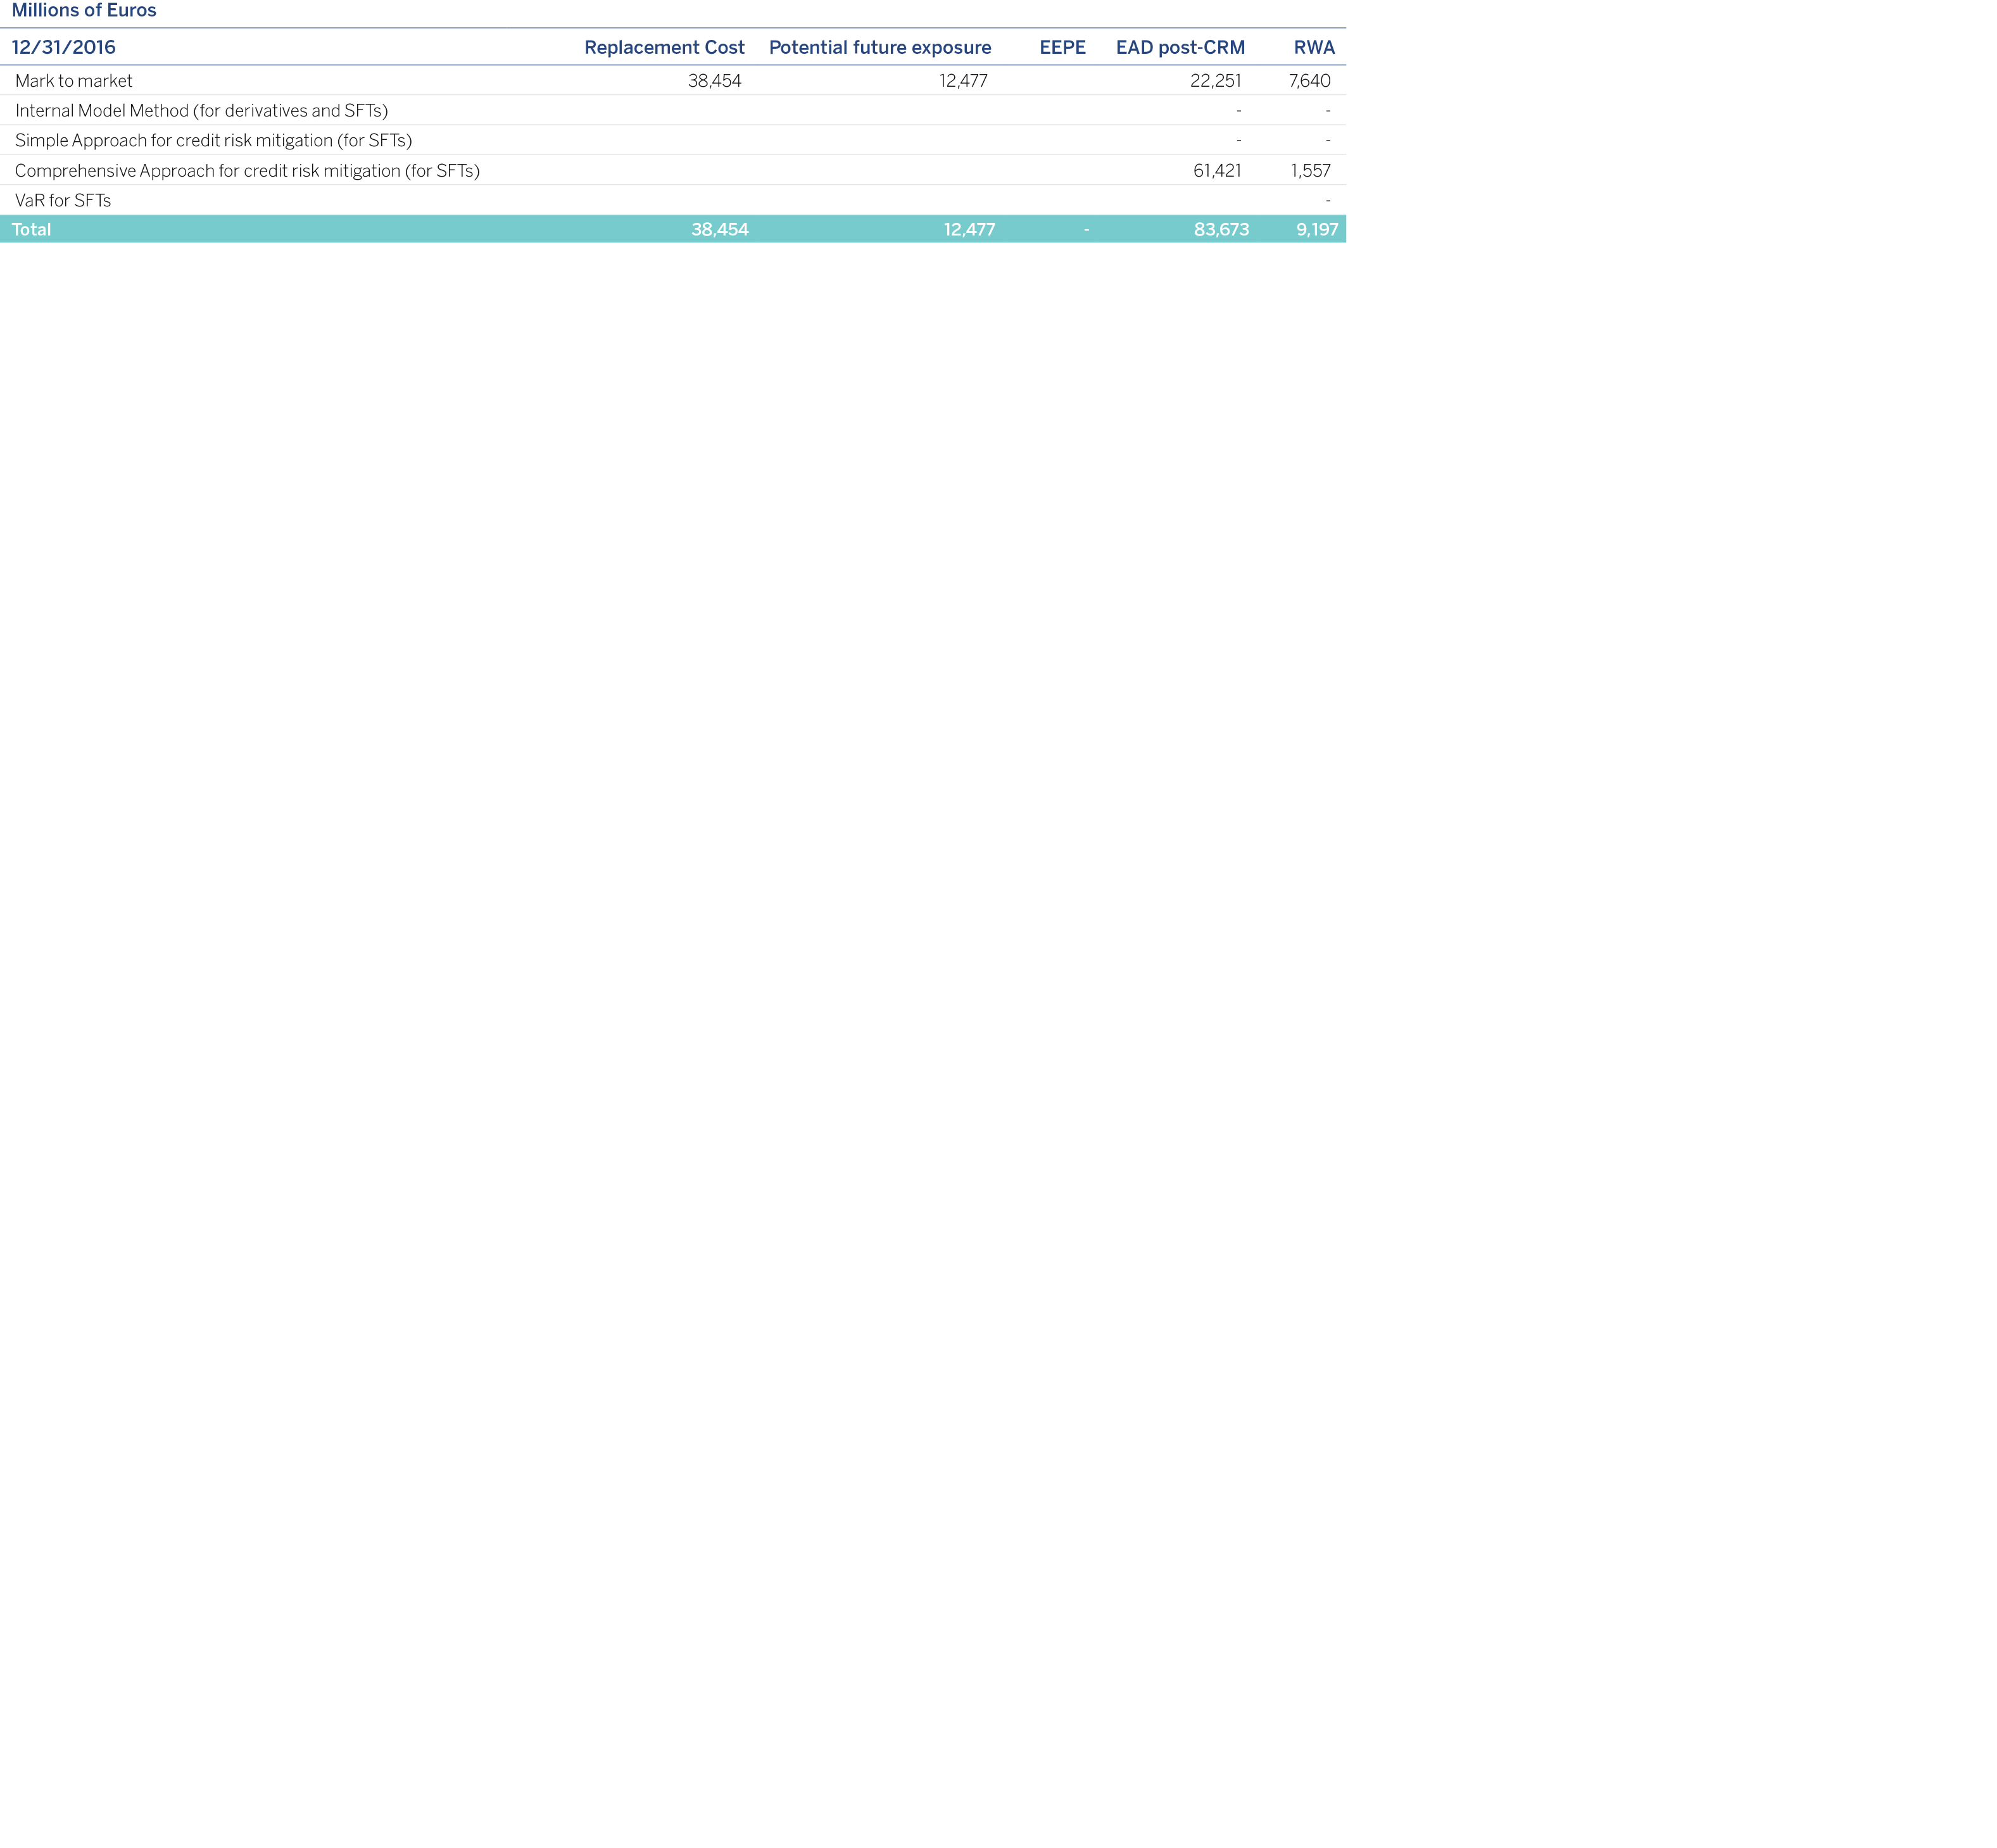
The following table presents a breakdown of exposure to counterparty credit risk (following mitigation and CCF techniques) calculated using the standardized method, by category of exposure and risk weighting:
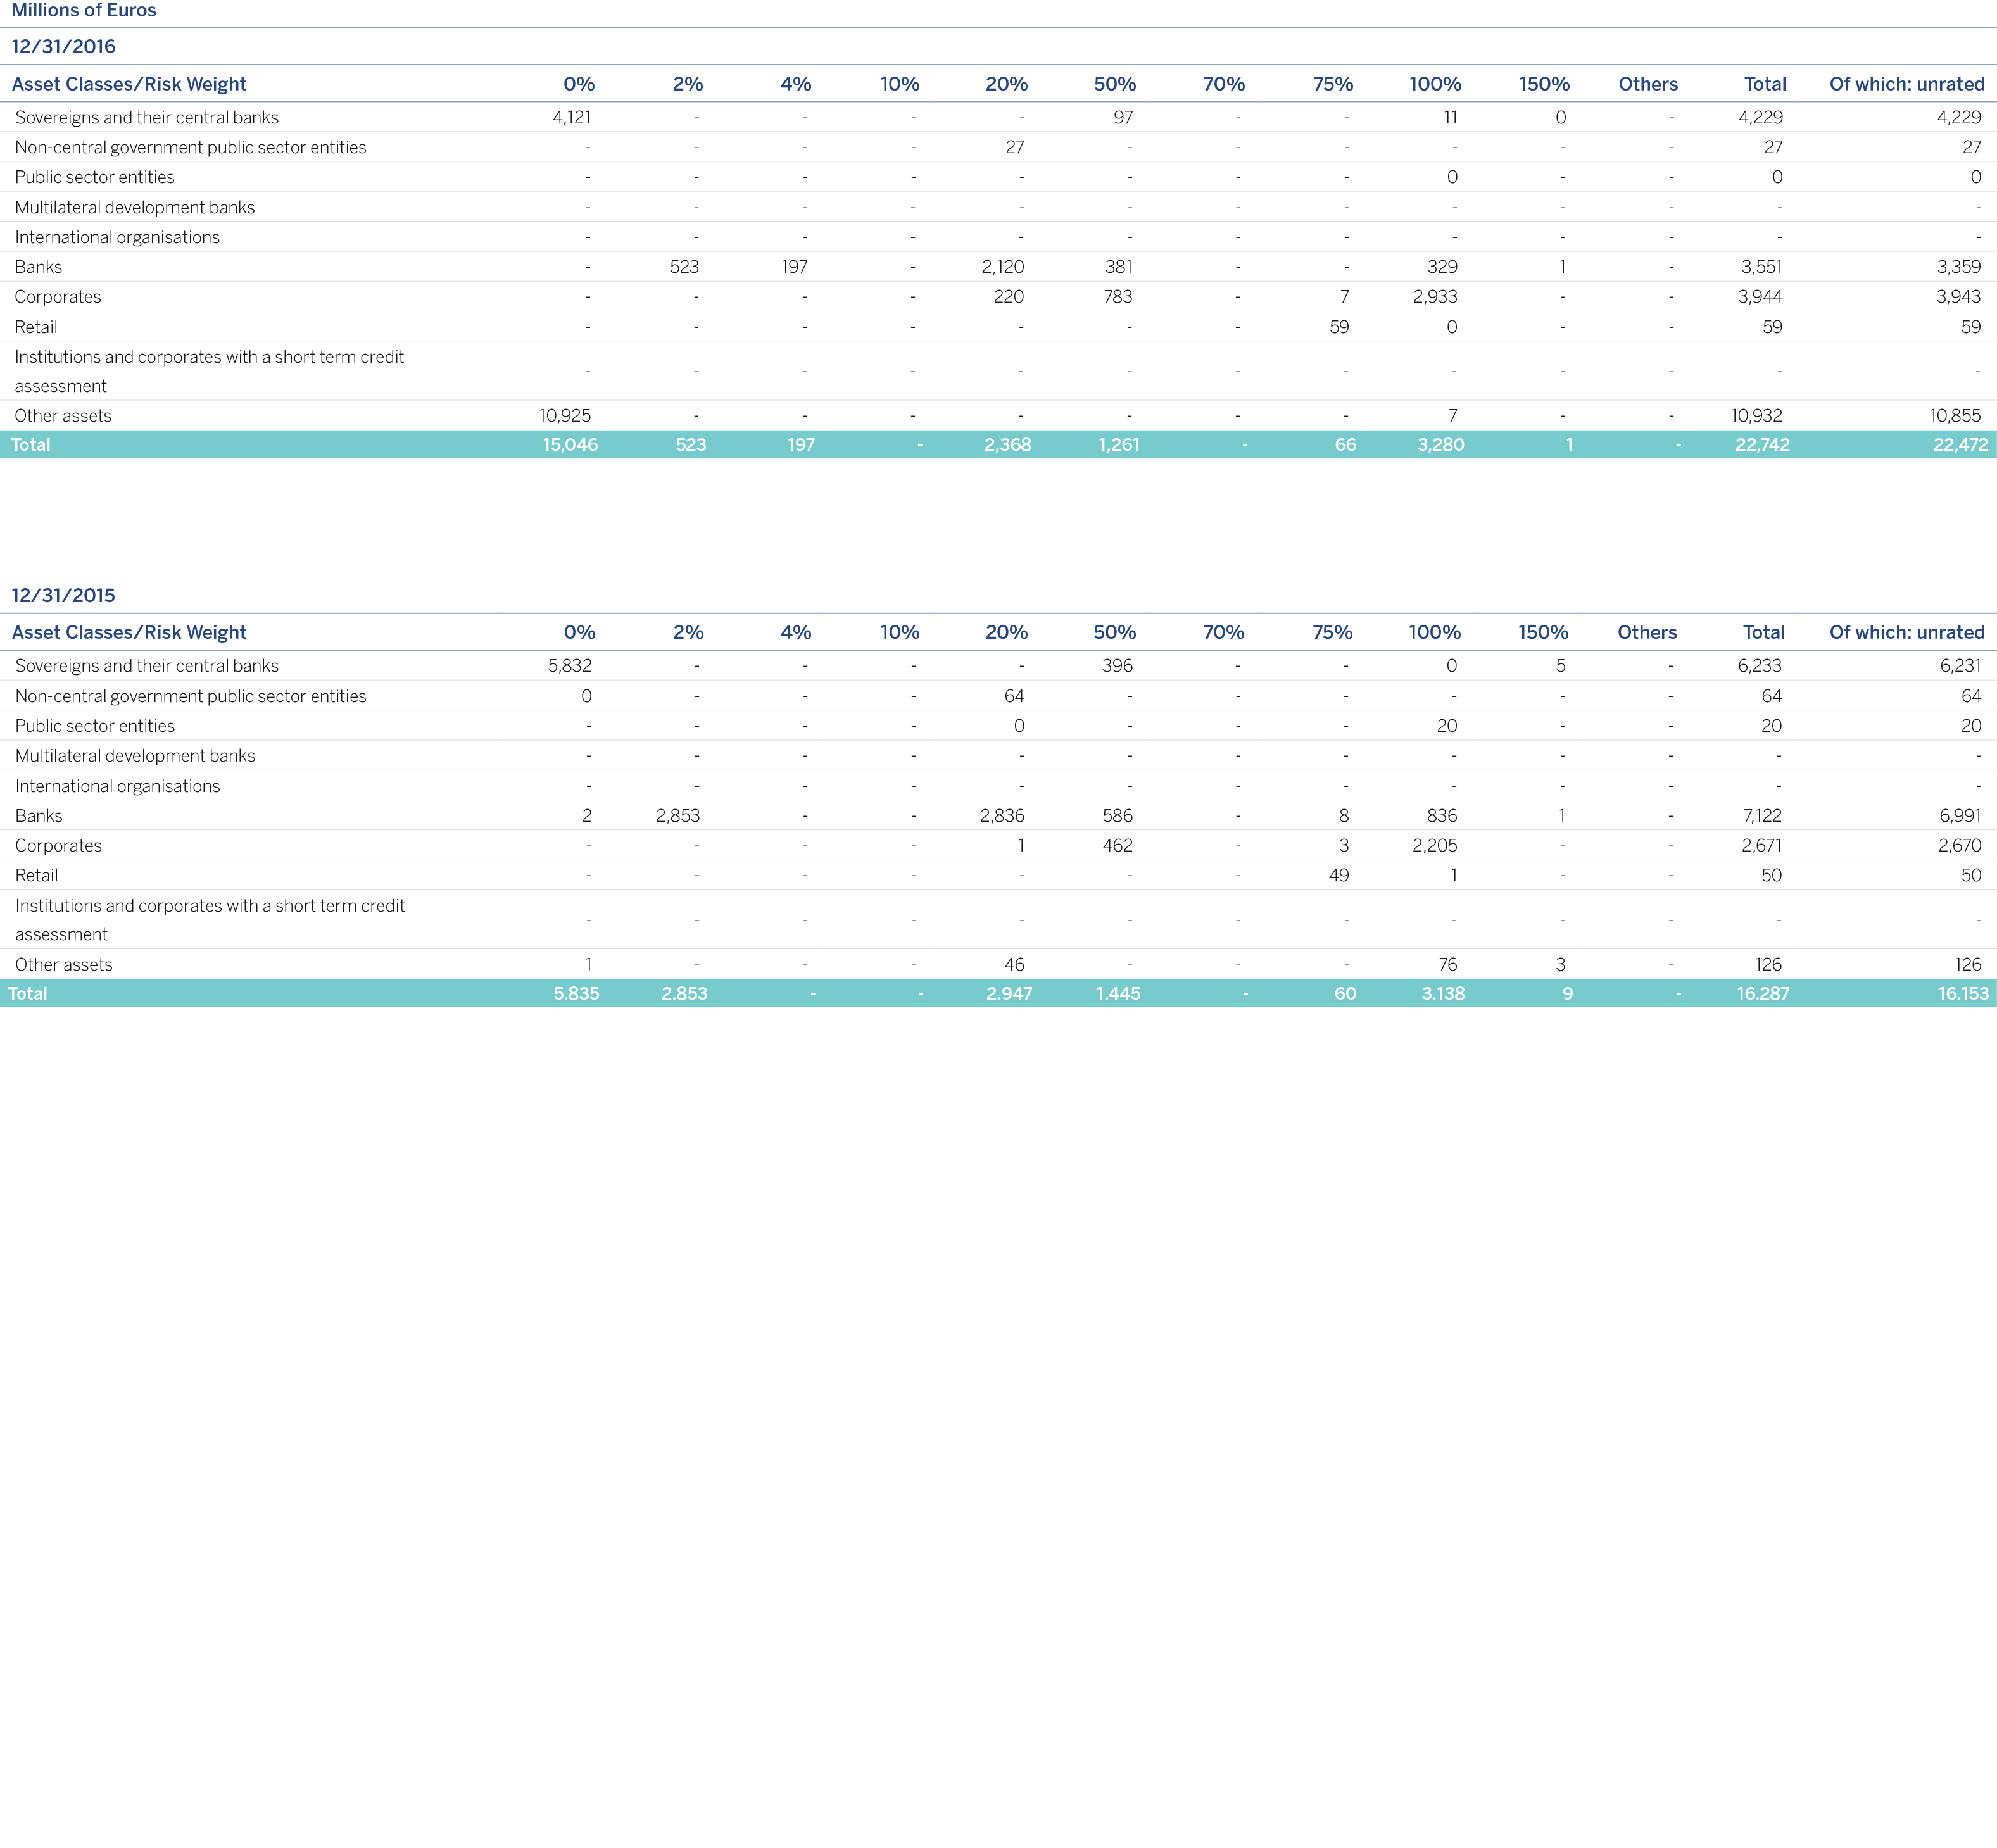
The following table presents the main variations in the period in terms of RWAs for the counterparty credit risk standardized approach:
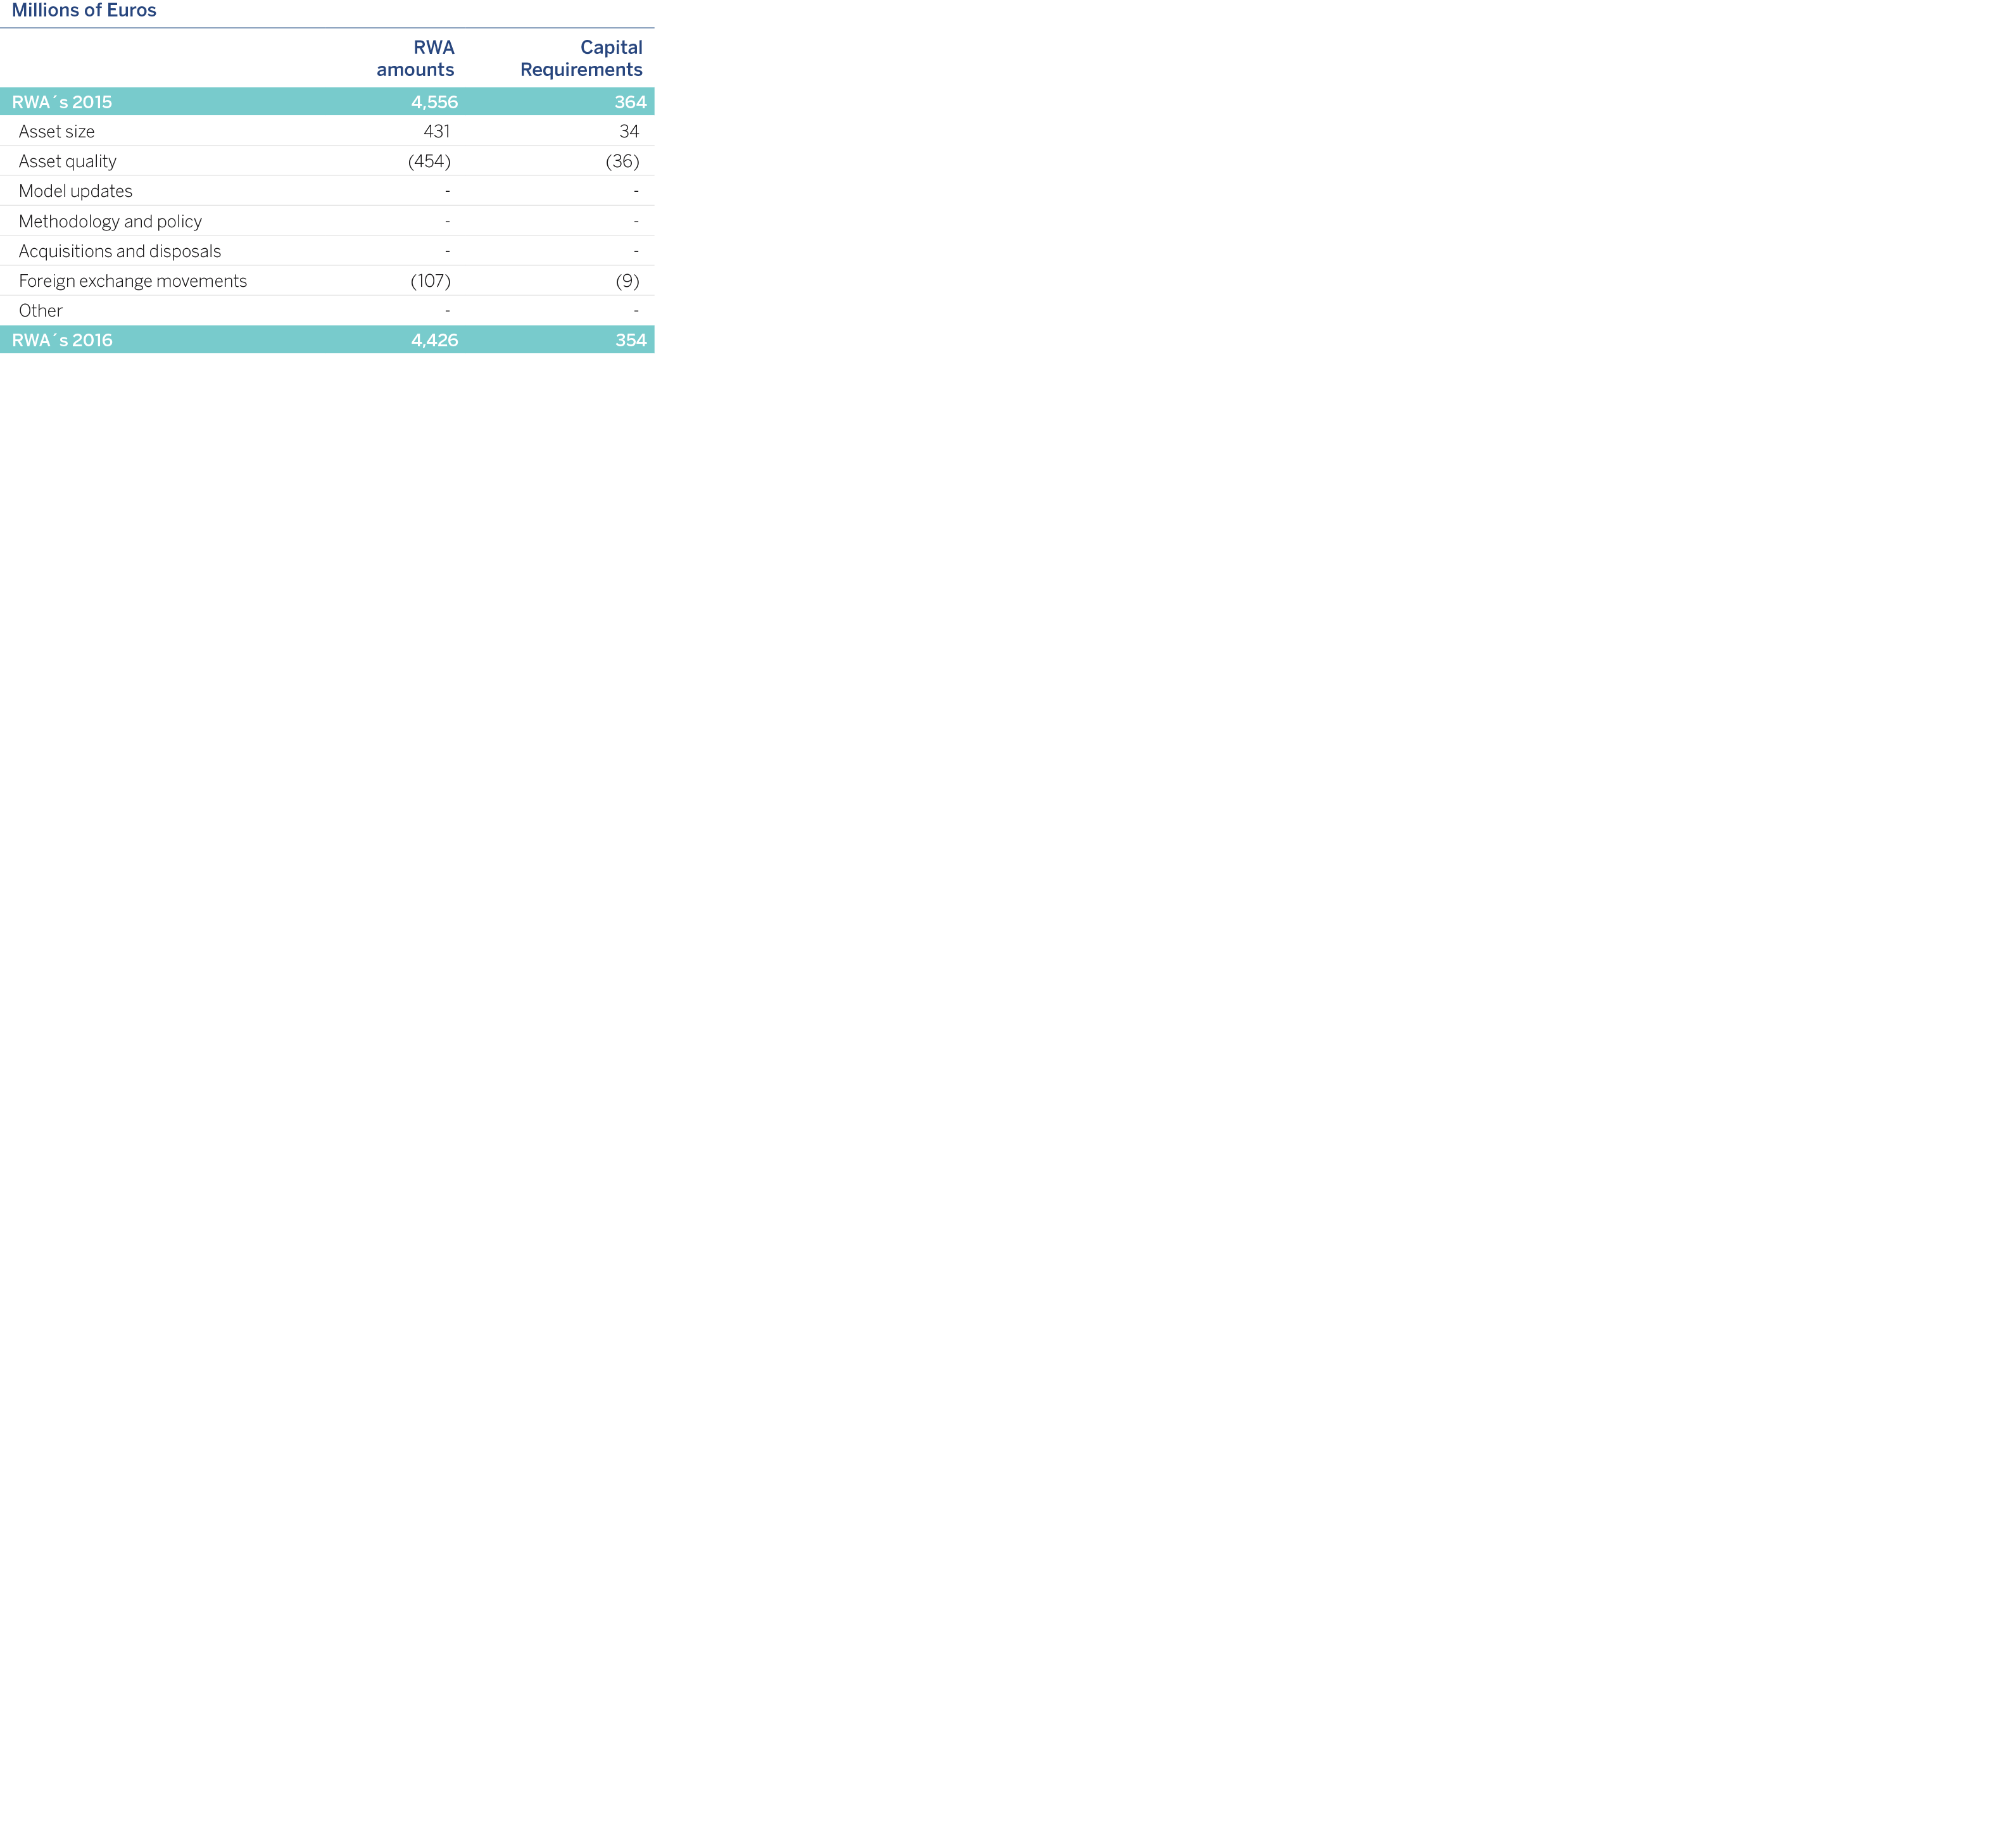
In 2016 there have been no significant variations in counterparty credit risk-weighted assets, and they are in line with the credit risk variations explained in section 3.2.4 (Table 23).
The following table presents the relevant parameters used to calculate the capital requirements for counterparty credit risk in the IRB models as of December 31, 2016:
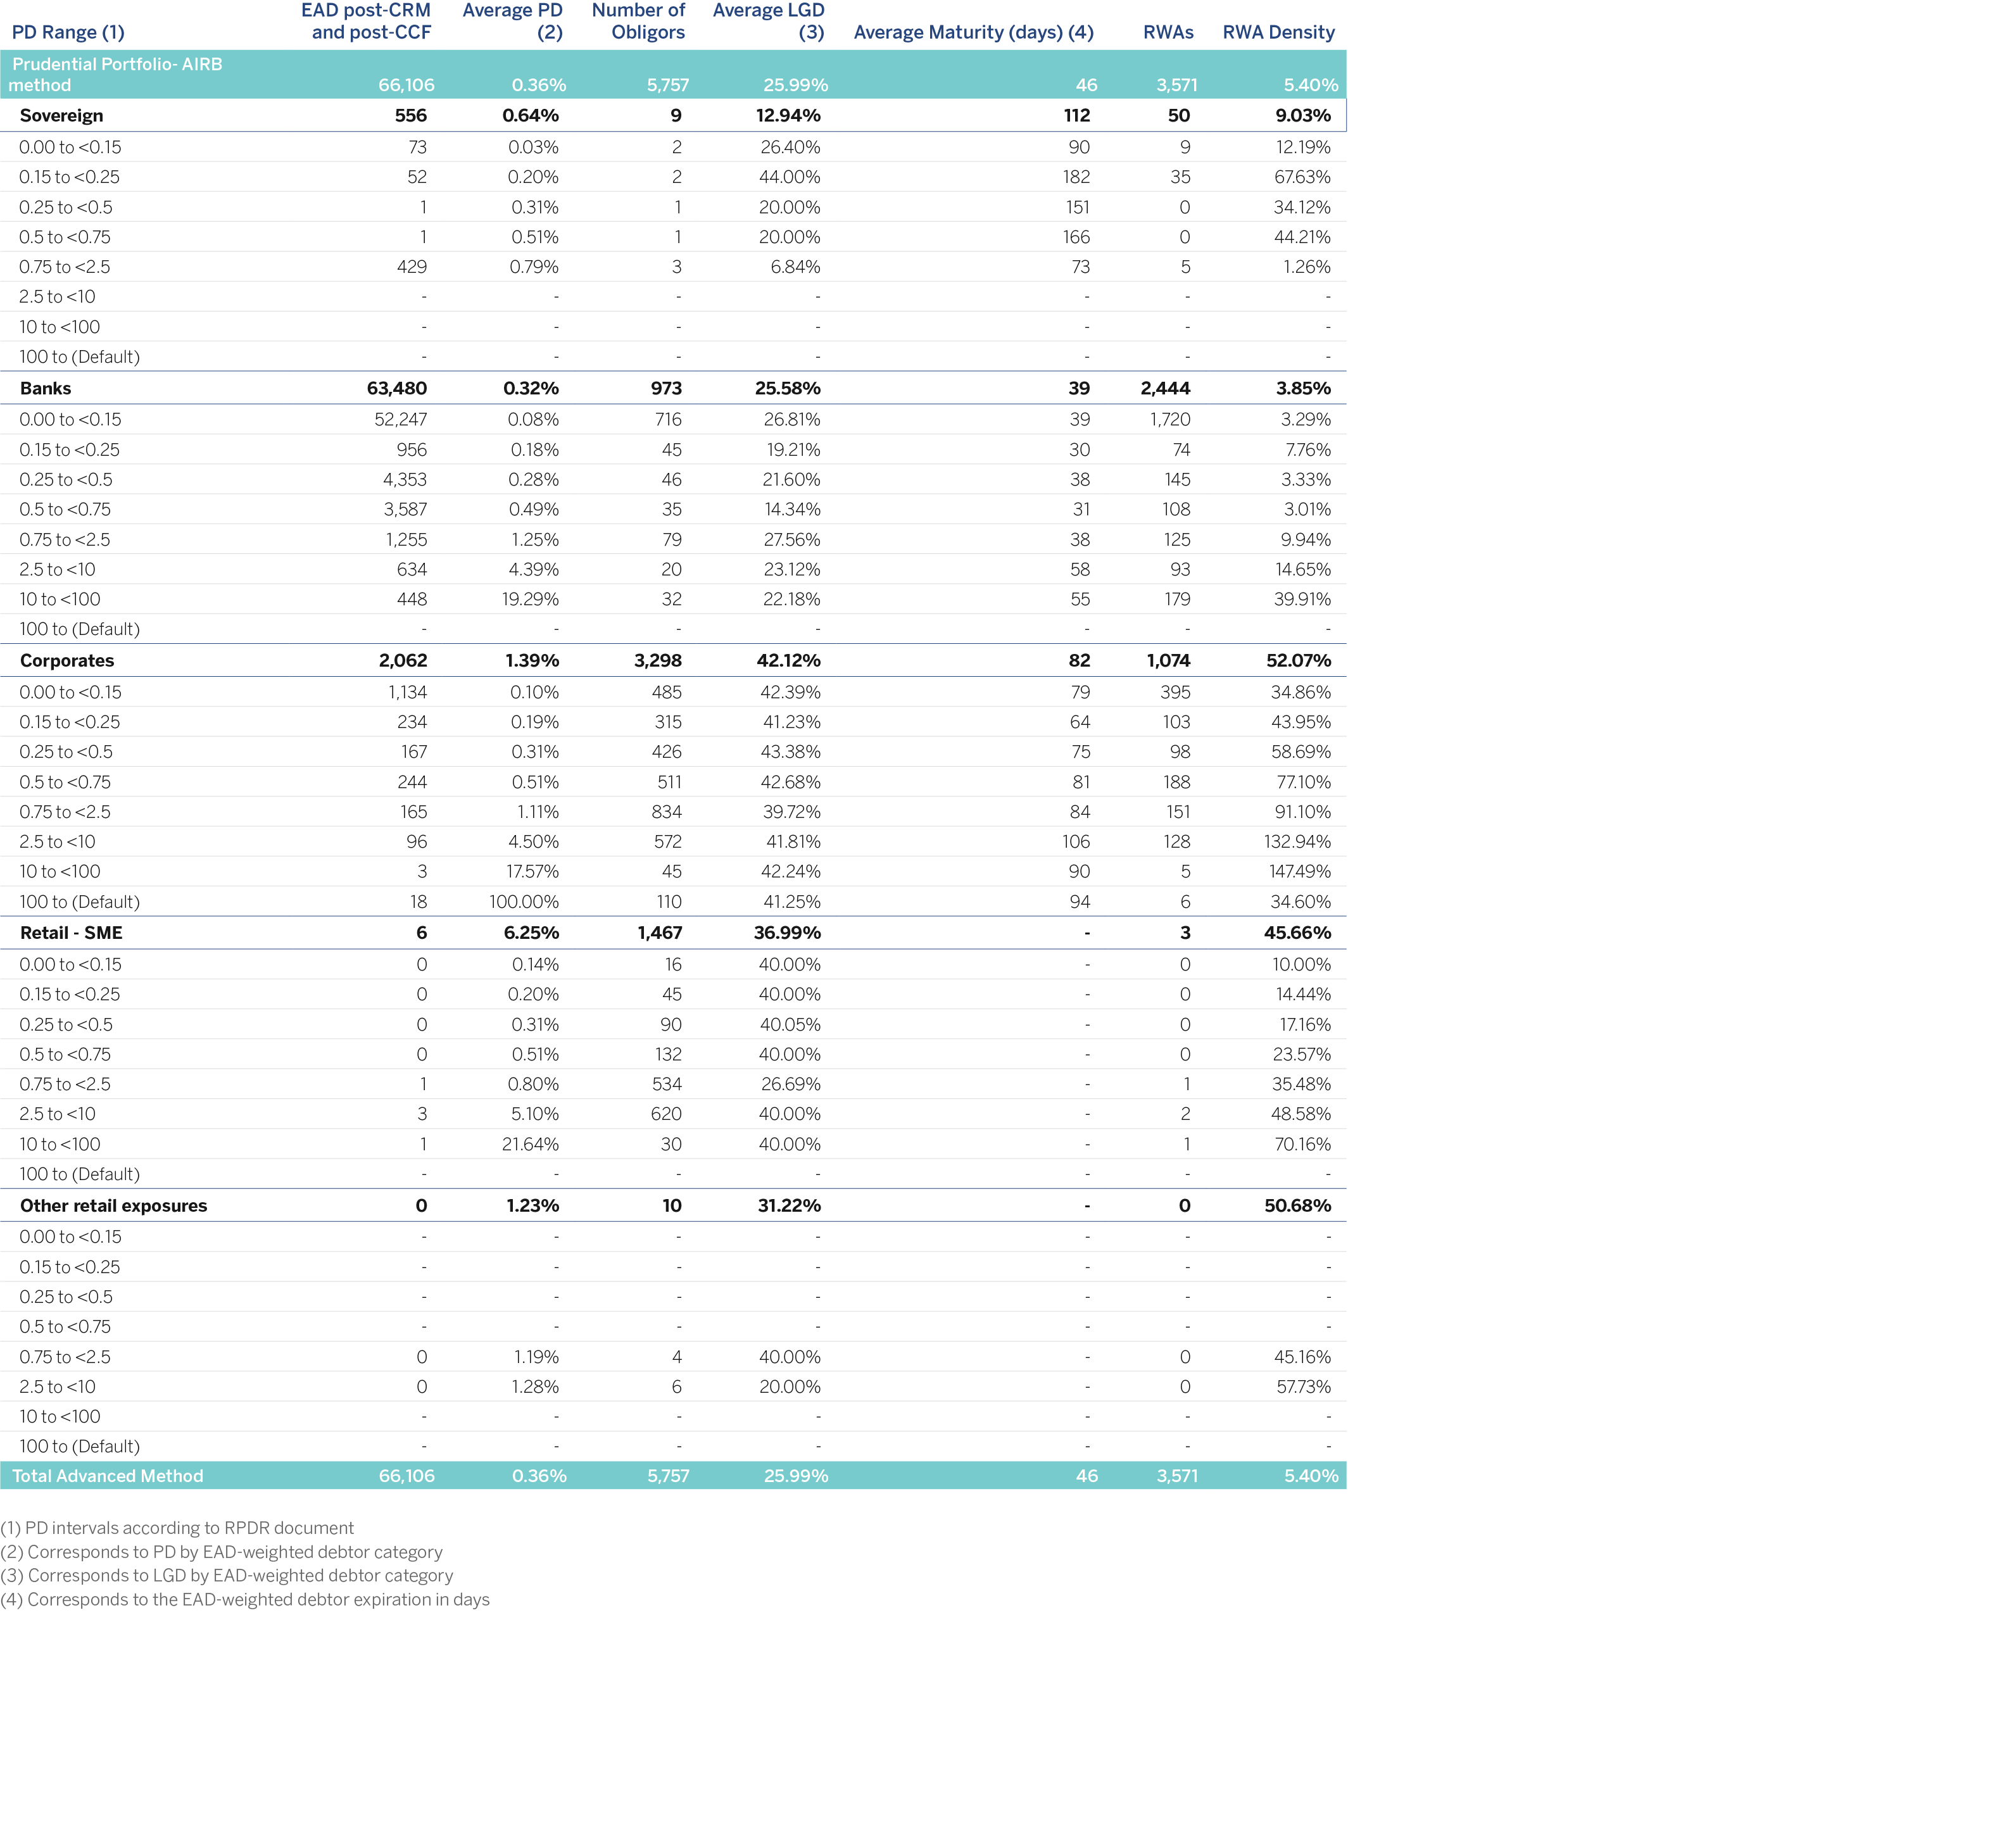
The table below shows the main variations of the counterparty credit risk’s RWA by advanced approach during the period:
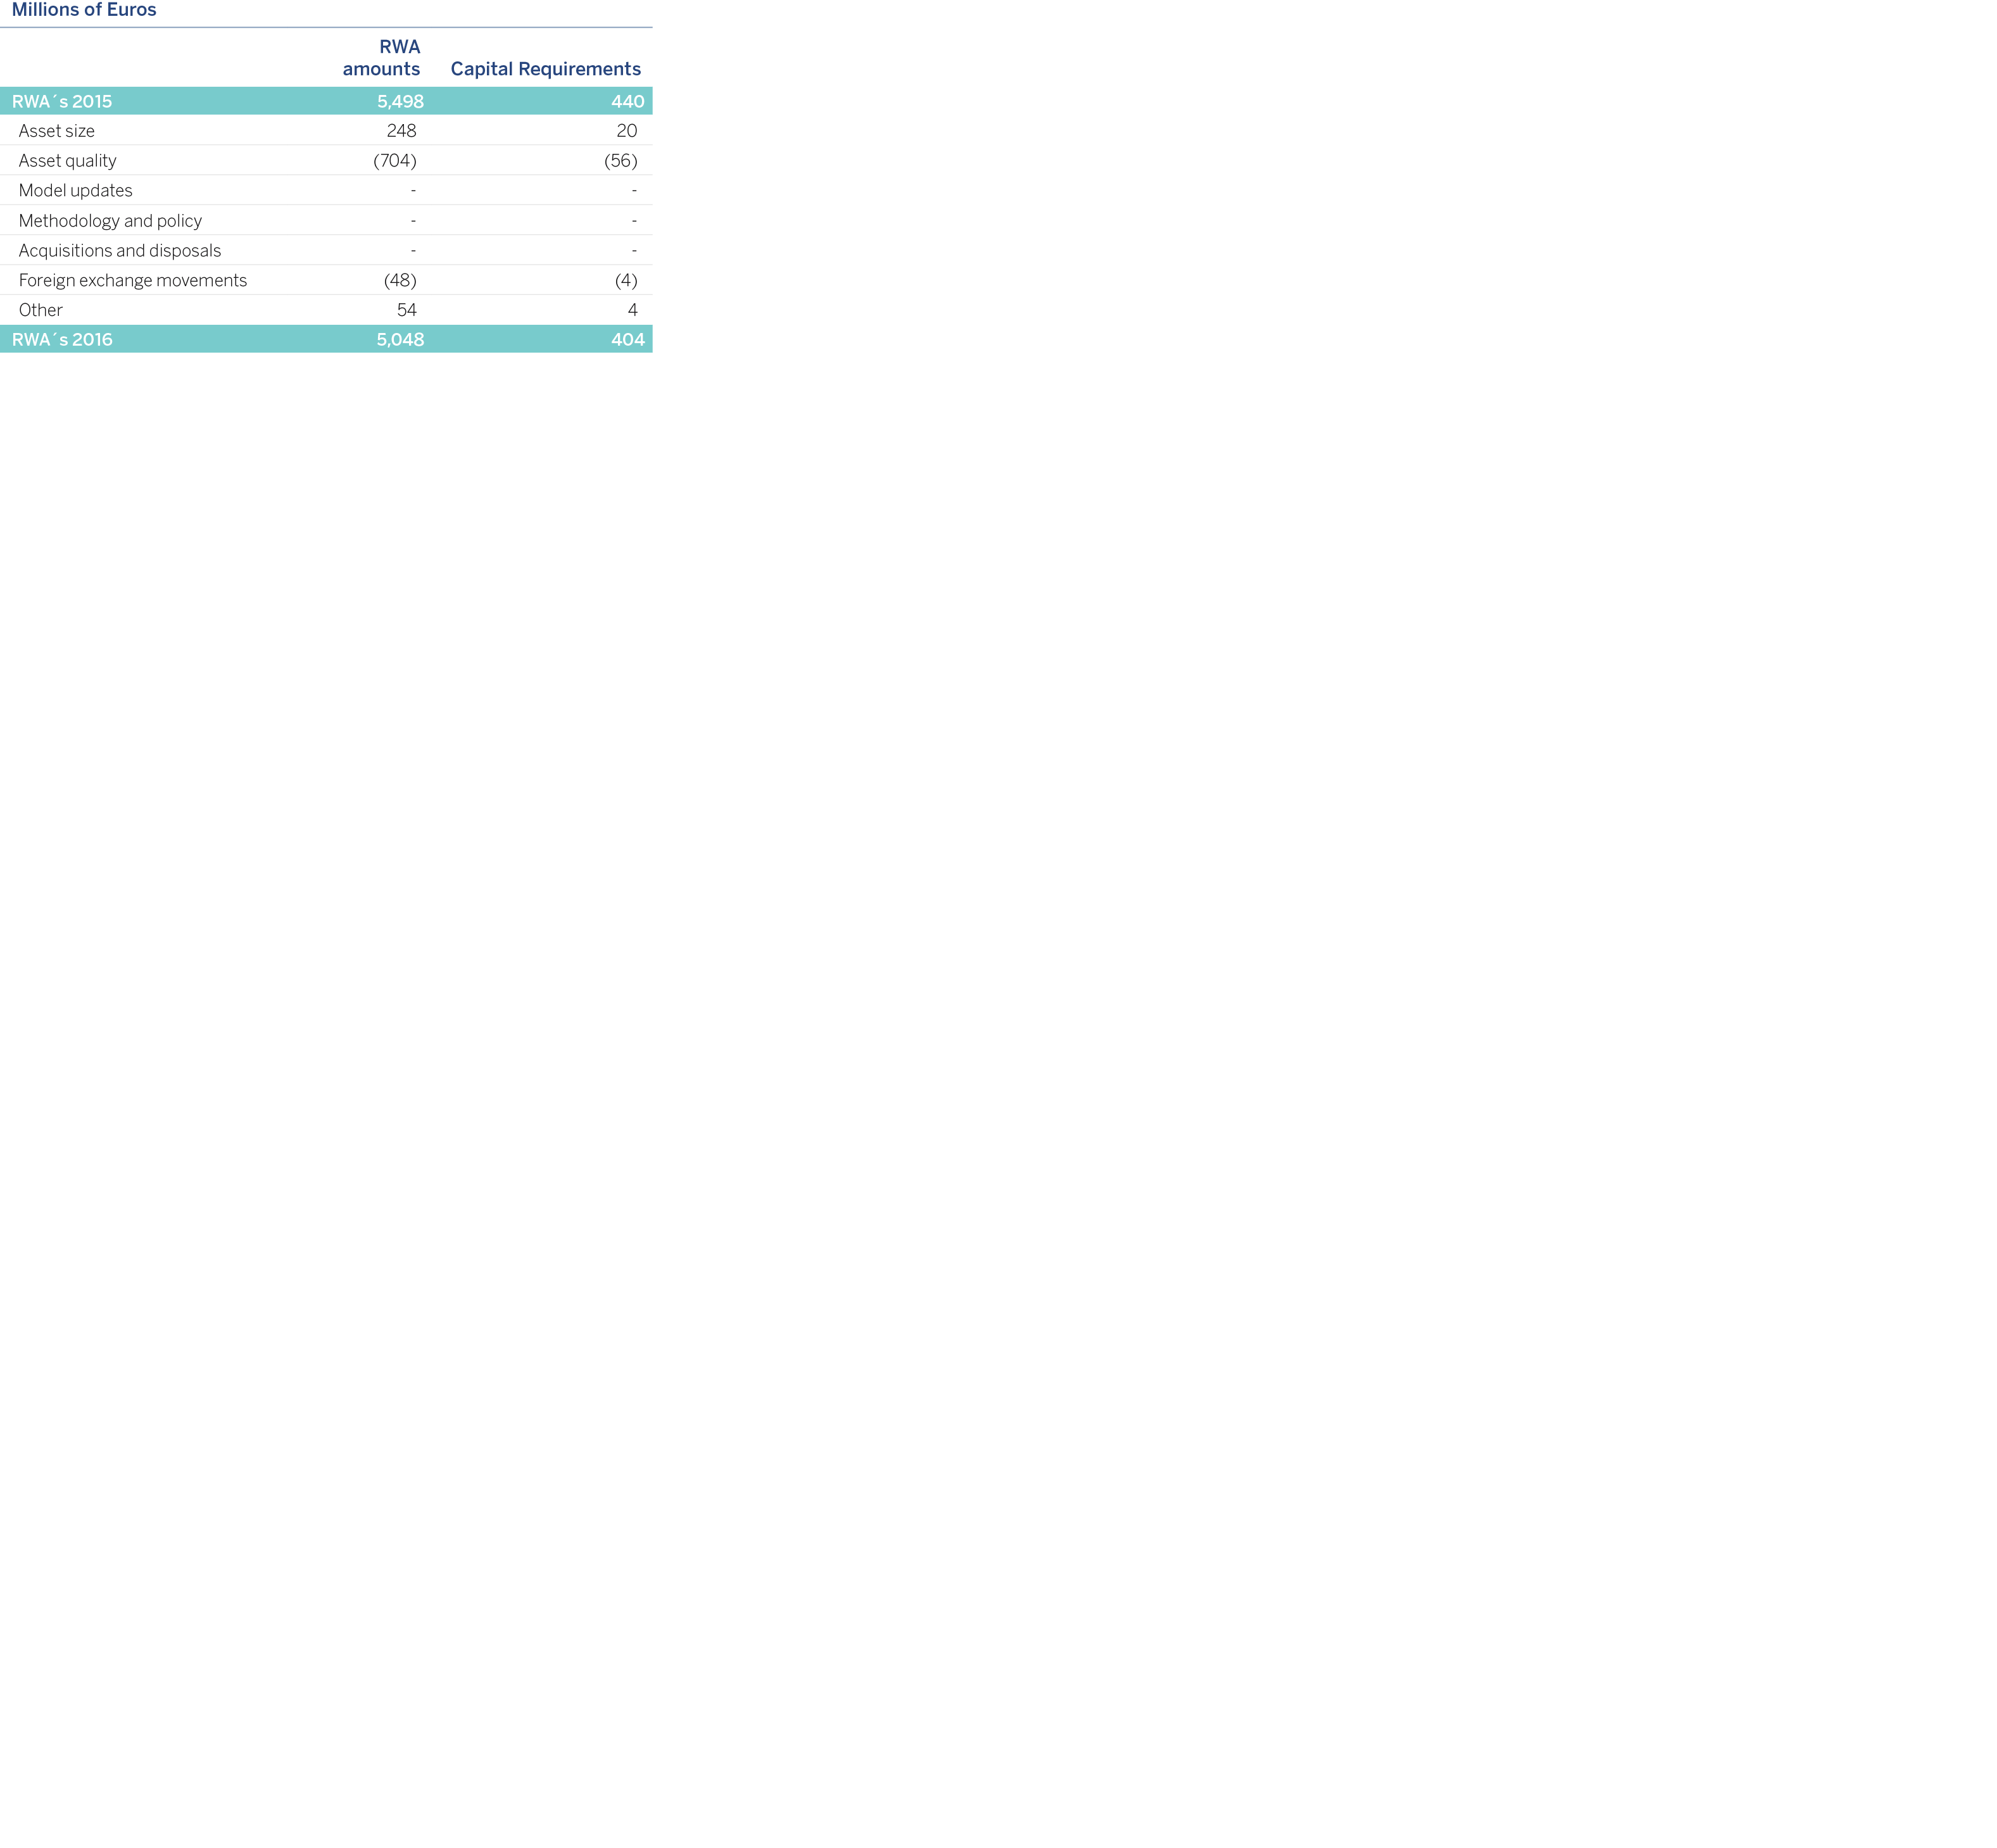
The slight fall in RWAs for counterparty credit risk calculated by the advanced measurement approach can mainly be explained by the exposure quality.
Below is a table with a breakdown of all the types of collateral contributed or received by the Group to strengthen or reduce exposure to counterparty credit risk related to derivative transactions and securities financing transactions as of December 31, 2016:
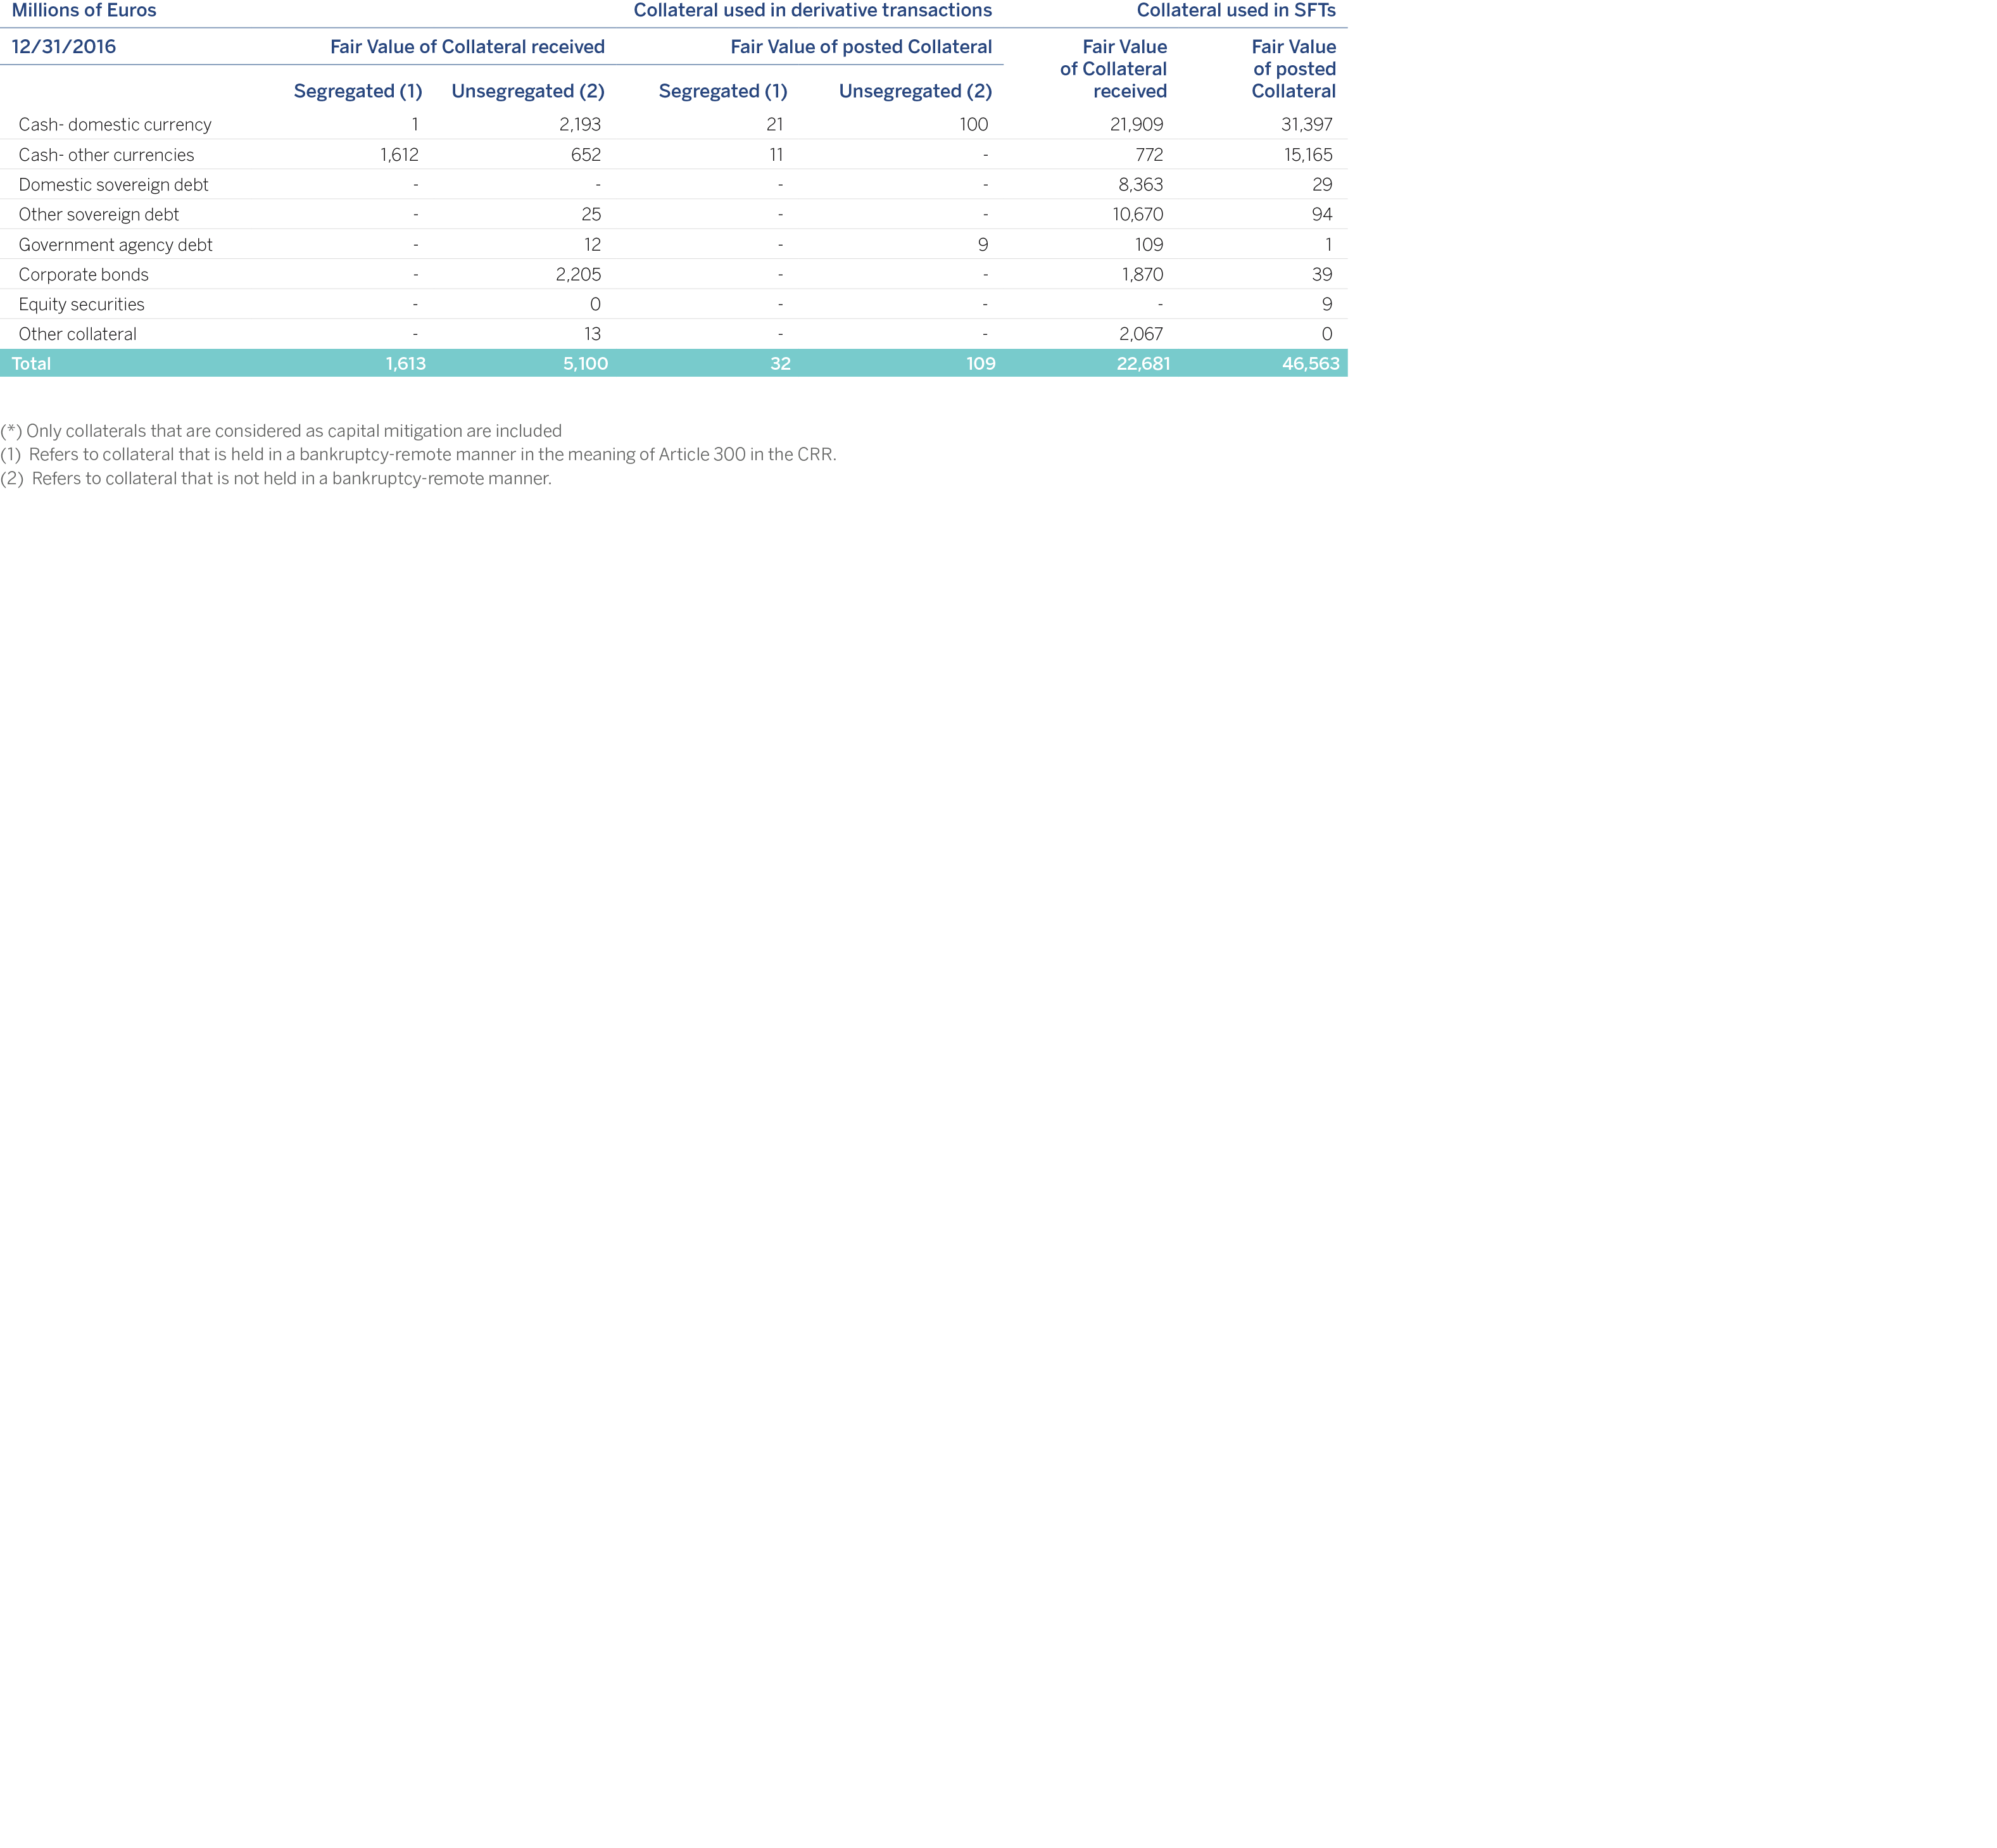
The table below shows the amounts corresponding to transactions with credit derivatives, broken down into bought and sold derivatives:
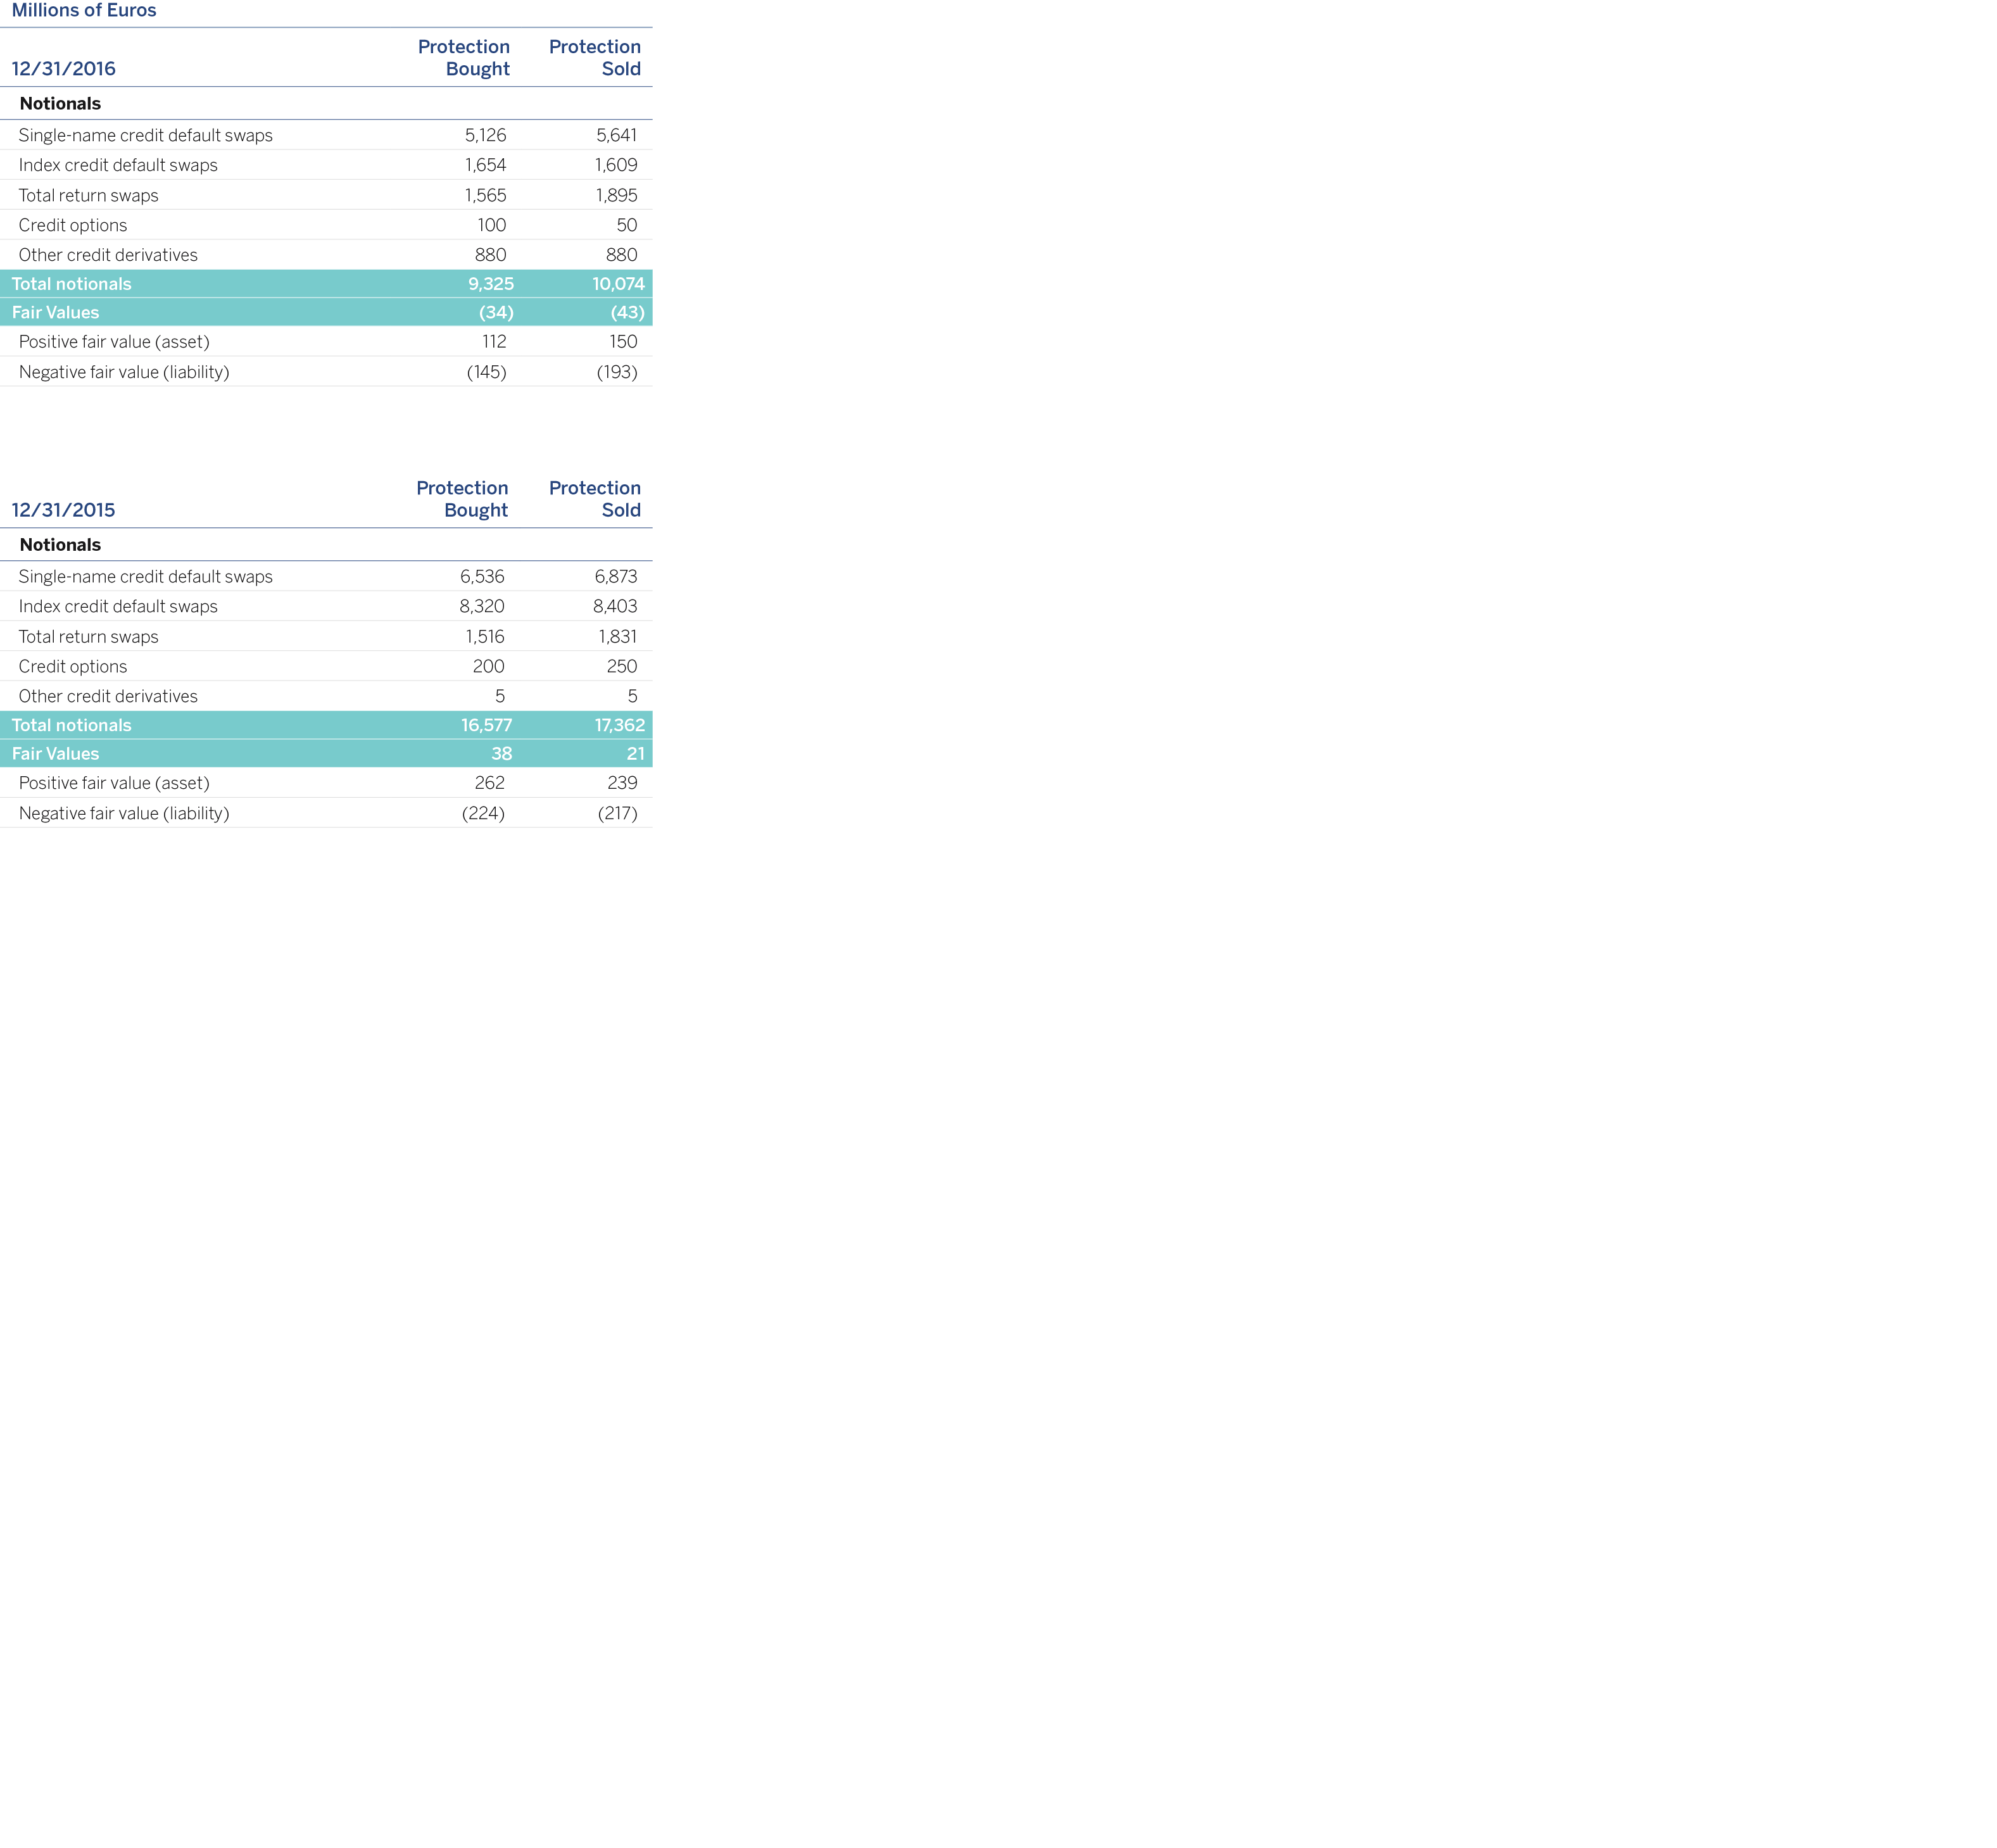
As of year-end 2016 and 2015, the Group did not use credit derivatives in brokerage activities as collateral.
The surcharge for CVA in Capital refers to the additional surcharge in capital on account of the unexpected CVA adjustment loss, for which there are two approaches:
Standardized Approach (Art. 384 CRR): Application of a standard regulatory formula. The formula applied is an analytical approximation to the calculating of the CVA VaR by supposing that the counterparty spreads depend on a single systematic risk factor and on its own idiosyncratic factor, both variables distributed by independent normal distributions, assuming a 99% confidence level.
Advanced Approach (Art 383 CRR): based on the market risk VaR approach, which requires a calculation of the “CVA VaR”, assuming the same confidence level (99%) and time horizon (10 days), as well as a stressed scenario. As of December 31, 2016 and December 31, 2015, the Group has no surcharge for CVA calculated under the advanced approach.
Procedures for calculating the valuation adjustments and reserves
Credit valuation adjustments (CVA) and debit valuations adjustments (DVA) are incorporated into derivative valuations both of assets and liabilities, to reflect the impact on fair value of the counterparty credit risk and own credit risk, respectively. (See Note 8 of the Group's Consolidated Financial Statements for more information).
Below are the amounts in million euros involved in the adjustments by credit risk as of December 31, 2016 and December 31, 2015:

Below are the variations in terms of RWAs during the period:

The variations in terms of RWAs by CVA during the period are due to changes in the perimeter.
The following table presents a complete overview of the exposures to central counterparties by type of exposure (arising from transactions, margins, contributions to the guarantee fund) and their corresponding capital requirements:
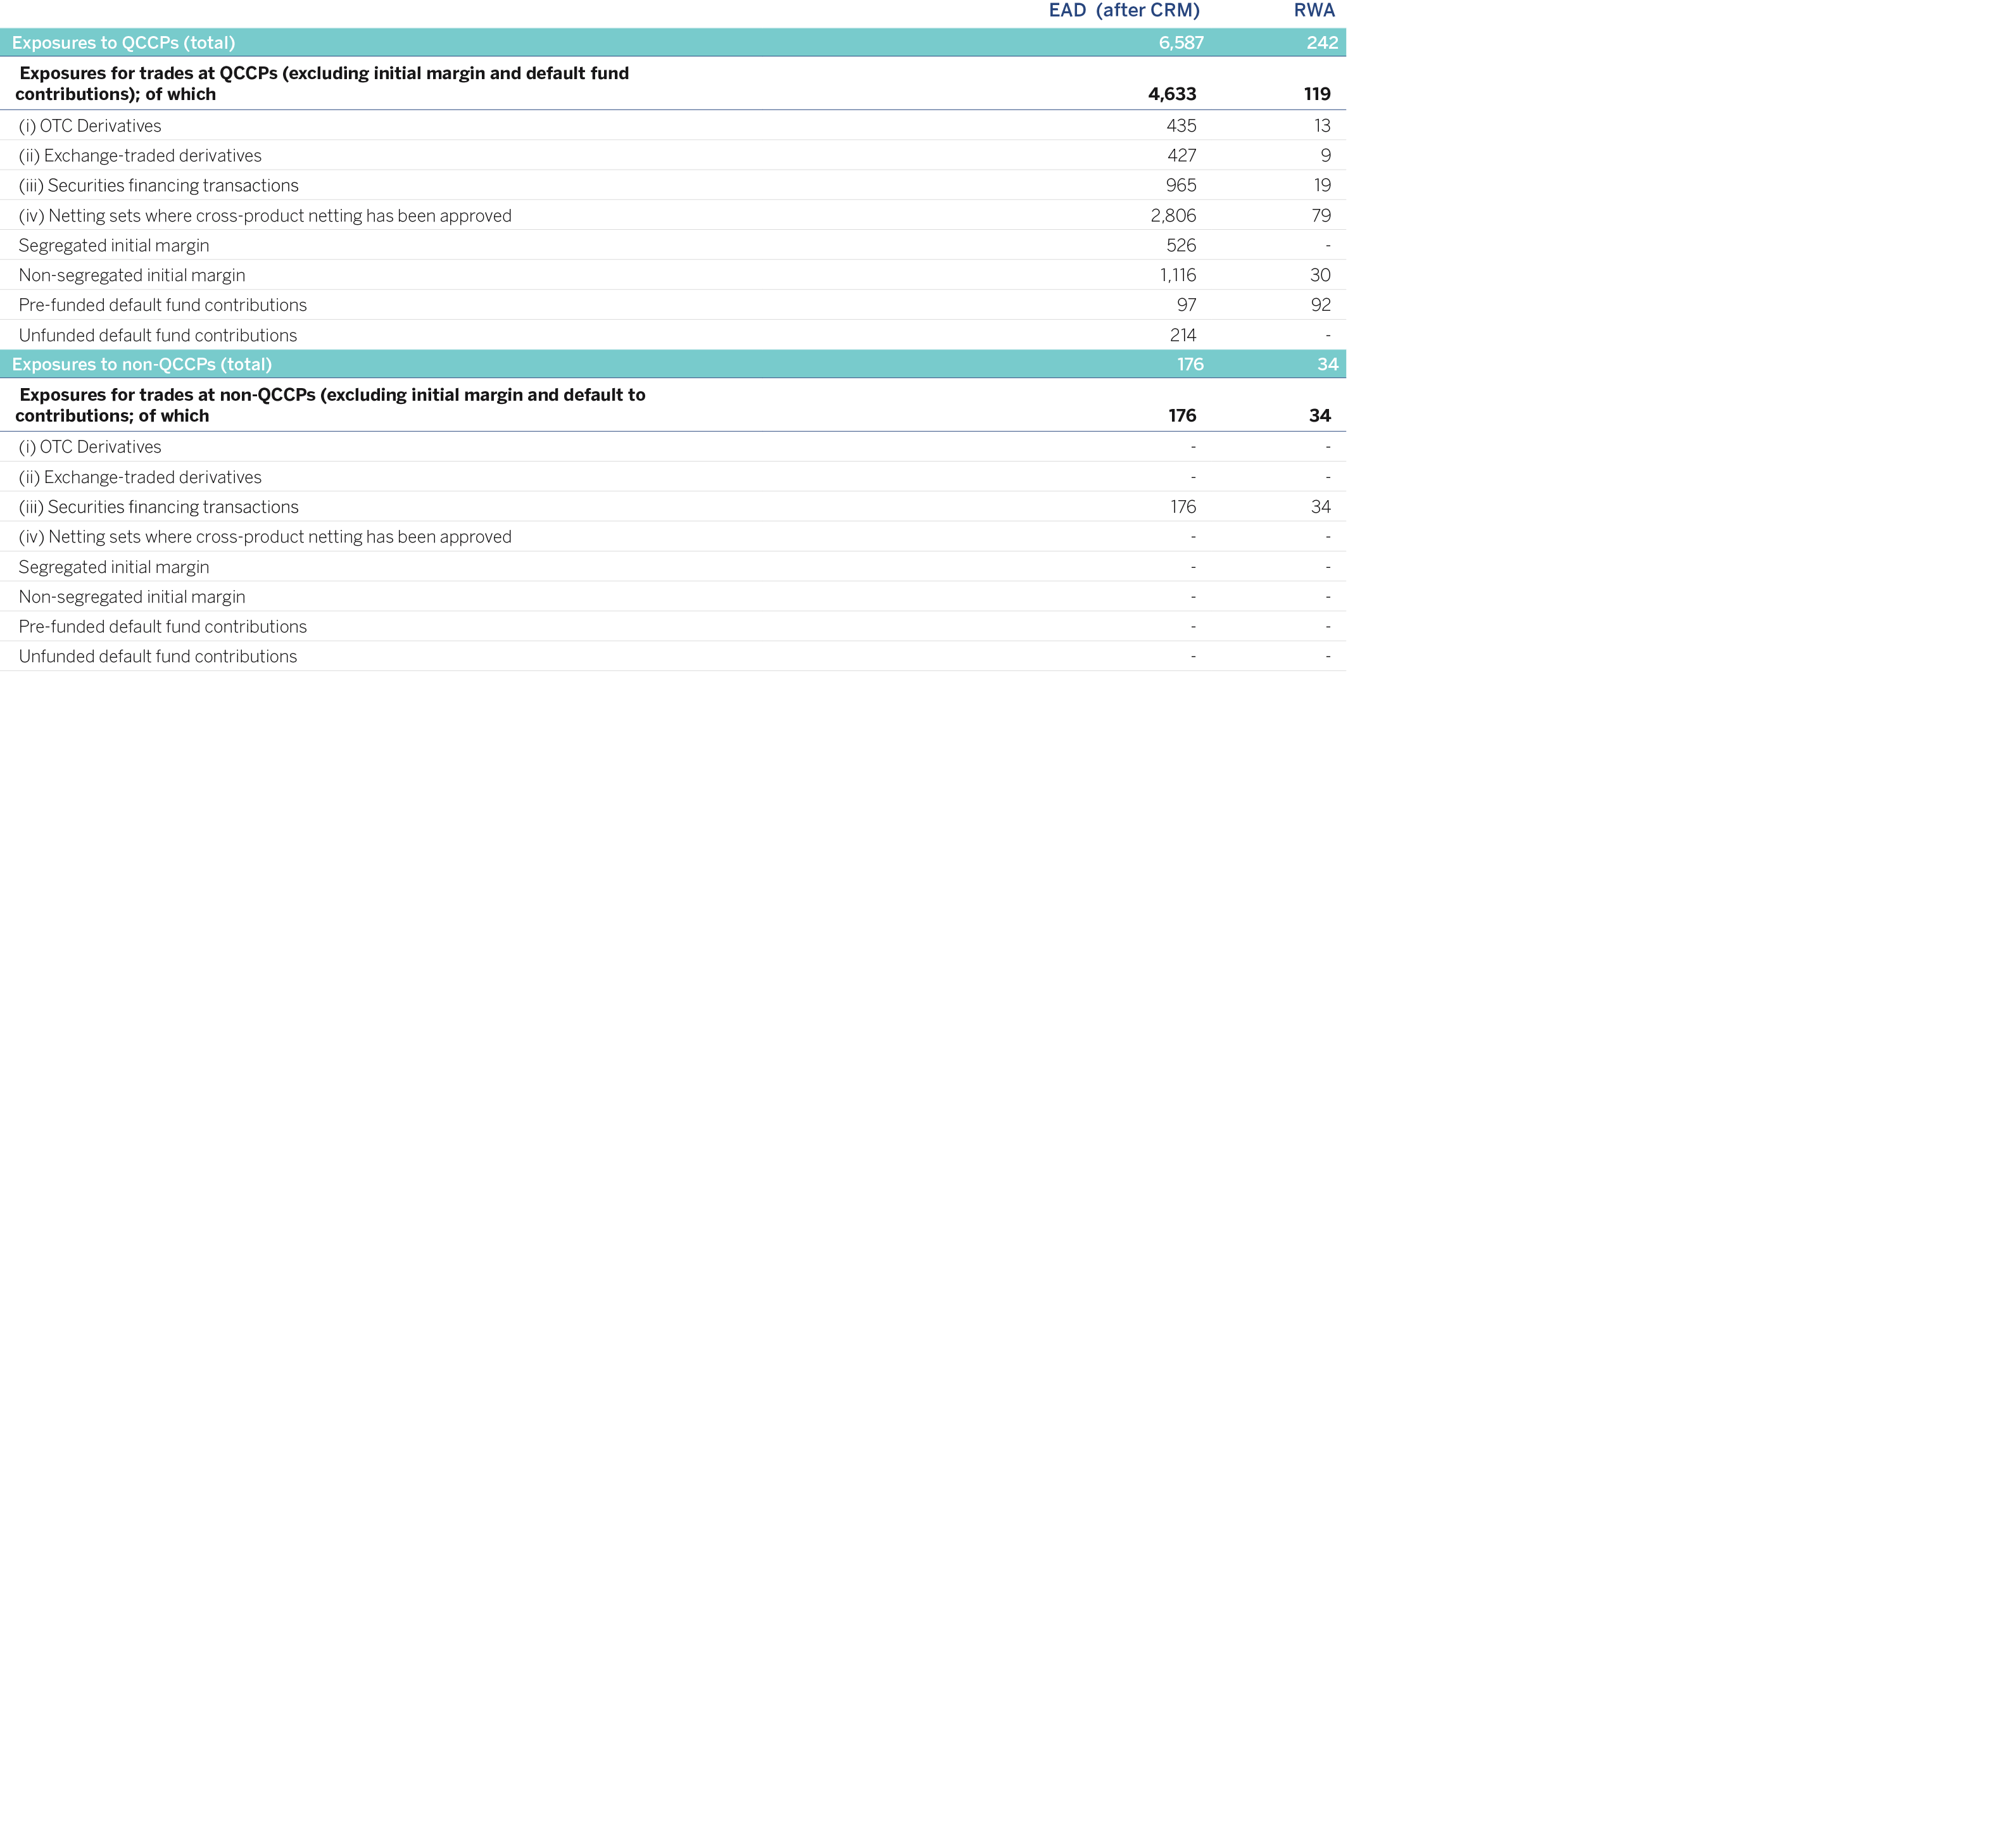
The Group’s current policy on securitization considers a program of recurrent issue, with a deliberate diversification of securitized assets that adjusts their volume to the Bank’s capital requirements and to market conditions.
This program is complemented by all the other finance and equity instruments, thereby diversifying the need to resort to wholesale markets.
The definition of the strategy and the execution of the operations, as with all other wholesale finance and capital management, is supervised by the Assets & Liabilities Committee, with the pertinent internal authorizations obtained directly from the Board of Directors or from the Executive Committee.
The main aim of securitization is to serve as an instrument for the efficient management of the balance sheet, above all as a source of liquidity at an efficient cost, obtaining liquid assets through eligible collateral, as a complement to other financial instruments. In addition, there are other secondary objectives associated with the use of securitization instruments, such as freeing up of regulatory capital by transferring risk and the freeing of potential excess over the expected loss, provided that the volume of the first-loss tranche and the ability to transfer risk allow it.
The Group’s degree of involvement in its securitization funds is not usually restricted to the mere role of assignor and administrator of the securitized portfolio.

As can be seen in the above chart, the Group has usually taken additional roles such as:
Payment Agent.
Provider of the treasury account.
Provider of the subordinated loan and of the loan for start-up costs, with the former being the one that finances the first-loss tranche, and the latter financing the fund’s fixed expenditure.
Administrative agent of the securitized portfolio
The Group has not assumed the role of sponsor of securitizations originated by third-party institutions.
The Group’s balance sheet maintains the first-loss tranches of all securitizations performed.
It is worth noting that the Group has maintained a consistent line in the generation of securitization operations since the credit crunch, which began in July 2007. Accordingly:
There have been no transfers of risk through synthetic securitizations. All operations have involved traditional securitizations with simple structures in which the underlying assets were loans or financial leasing.
It has not been involved in recurrent structures such as conduits or SIVs; instead, all of its issues have been one-offs.
The methods used to calculate risk-weighted exposures in securitizations are:
The standardized approach: when this method is used for fully securitized exposures, in full or in a predominant manner if it involves a mixed portfolio.
The IRB approach: when internal models are used for securitized exposures, in full or in a predominant manner. Within the alternatives of the IRB approach, use is made of the model based on external ratings.
The accounting procedure for the transfer of financial assets depends on the manner in which the risks and benefits associated with securitized assets are transferred to third parties. Financial assets are only removed from the consolidated balance sheet when the cash flows they generate have dried up or when their implicit risks and benefits have been substantially transferred out to third parties.
Group is considered to substantially transfer the risks and benefits when these account for the majority of the overall risks and benefits of the securitized assets.
When the risks and benefits of transferred assets are substantially conveyed to third parties, the financial asset transferred is removed from the consolidated balance sheet, and any right or obligation retained or created as a result of the transfer is simultaneously recognized.
In many situations, it is clear whether the entity has substantially transferred all the risks and benefits associated with the transfer of an asset or not. However, when it is not sufficiently clear if the transfer took place or not, the entity evaluates its exposure before and after the transfer by comparing the variation in the amounts and the calendar of the net cash flows of the transferred asset. Therefore, if the exposure to the variation in the current value of the net cash flows of the financial asset does not significantly change as a result of the transfer, it is understood that the entity has not substantially transferred all the risks and benefits associated with the ownership of the asset.
When the risks and/or benefits associated with the financial asset transferred are substantially retained, the asset transferred is not removed from the consolidated balance sheet and continues to be valued according to the same criteria applied prior to the transfer.
In the specific case of securitization funds to which Group institutions transfer their loanbooks, existing contractual rights other than voting rights are to be considered with a view to analyzing their possible consolidation. It is also necessary to consider the design and purpose of each fund, as well as the following factors, among others:
Evidence of the practical ability to direct the relevant activities of the funds according to the specific needs of the business (including the decisions that may arise in particular circumstances only).
Possible existence of special relationships with the funds.
The Group's implicit or explicit commitments to back the funds.
Whether the Group has the capacity to use its power over the funds to influence the amount of the returns to which it is exposed.
Thus, there are cases where the Group is highly exposed to the existing variable returns and retains decision-making powers over the institution, either directly or through an agent. In these cases, the securitization funds are consolidated with the Group.
In order for the Group to recognize the result generated on the sale of financial instruments, the sale has to involve the corresponding removal from the accounts, which requires the fulfillment of the requirements governing the substantial transfer of risks and benefits as described in the preceding point.
The result will be reflected on the income statement, being calculated as the difference between the book value and the net value received including any new additional assets obtained minus any liabilities assumed.
When the amount of the financial asset transferred matches the total amount of the original financial asset, the new financial assets, financial liabilities and liabilities for the provision of services, as appropriate, that are generated as a result of the transfer will be recorded according to their fair value.
The Group considers that a substantial withholding is made of the risks and benefits of securitizations when the subordinated bonds of issues are kept and/or it grants subordinated finance to the securitization funds that mean substantially retaining the credit losses expected from the loans transferred.
The Group currently has traditional securitizations only, and no synthetic securitizations.
A securitization fulfills the criterion of significant and effective transfer of risk, and therefore falls within the solvency framework of the securitizations, when it meets the conditions laid down in Articles 244.2 and 243.2 of the CRR.
The table below shows the amounts in terms of EAD of investment and trading portfolio by type of exposure:
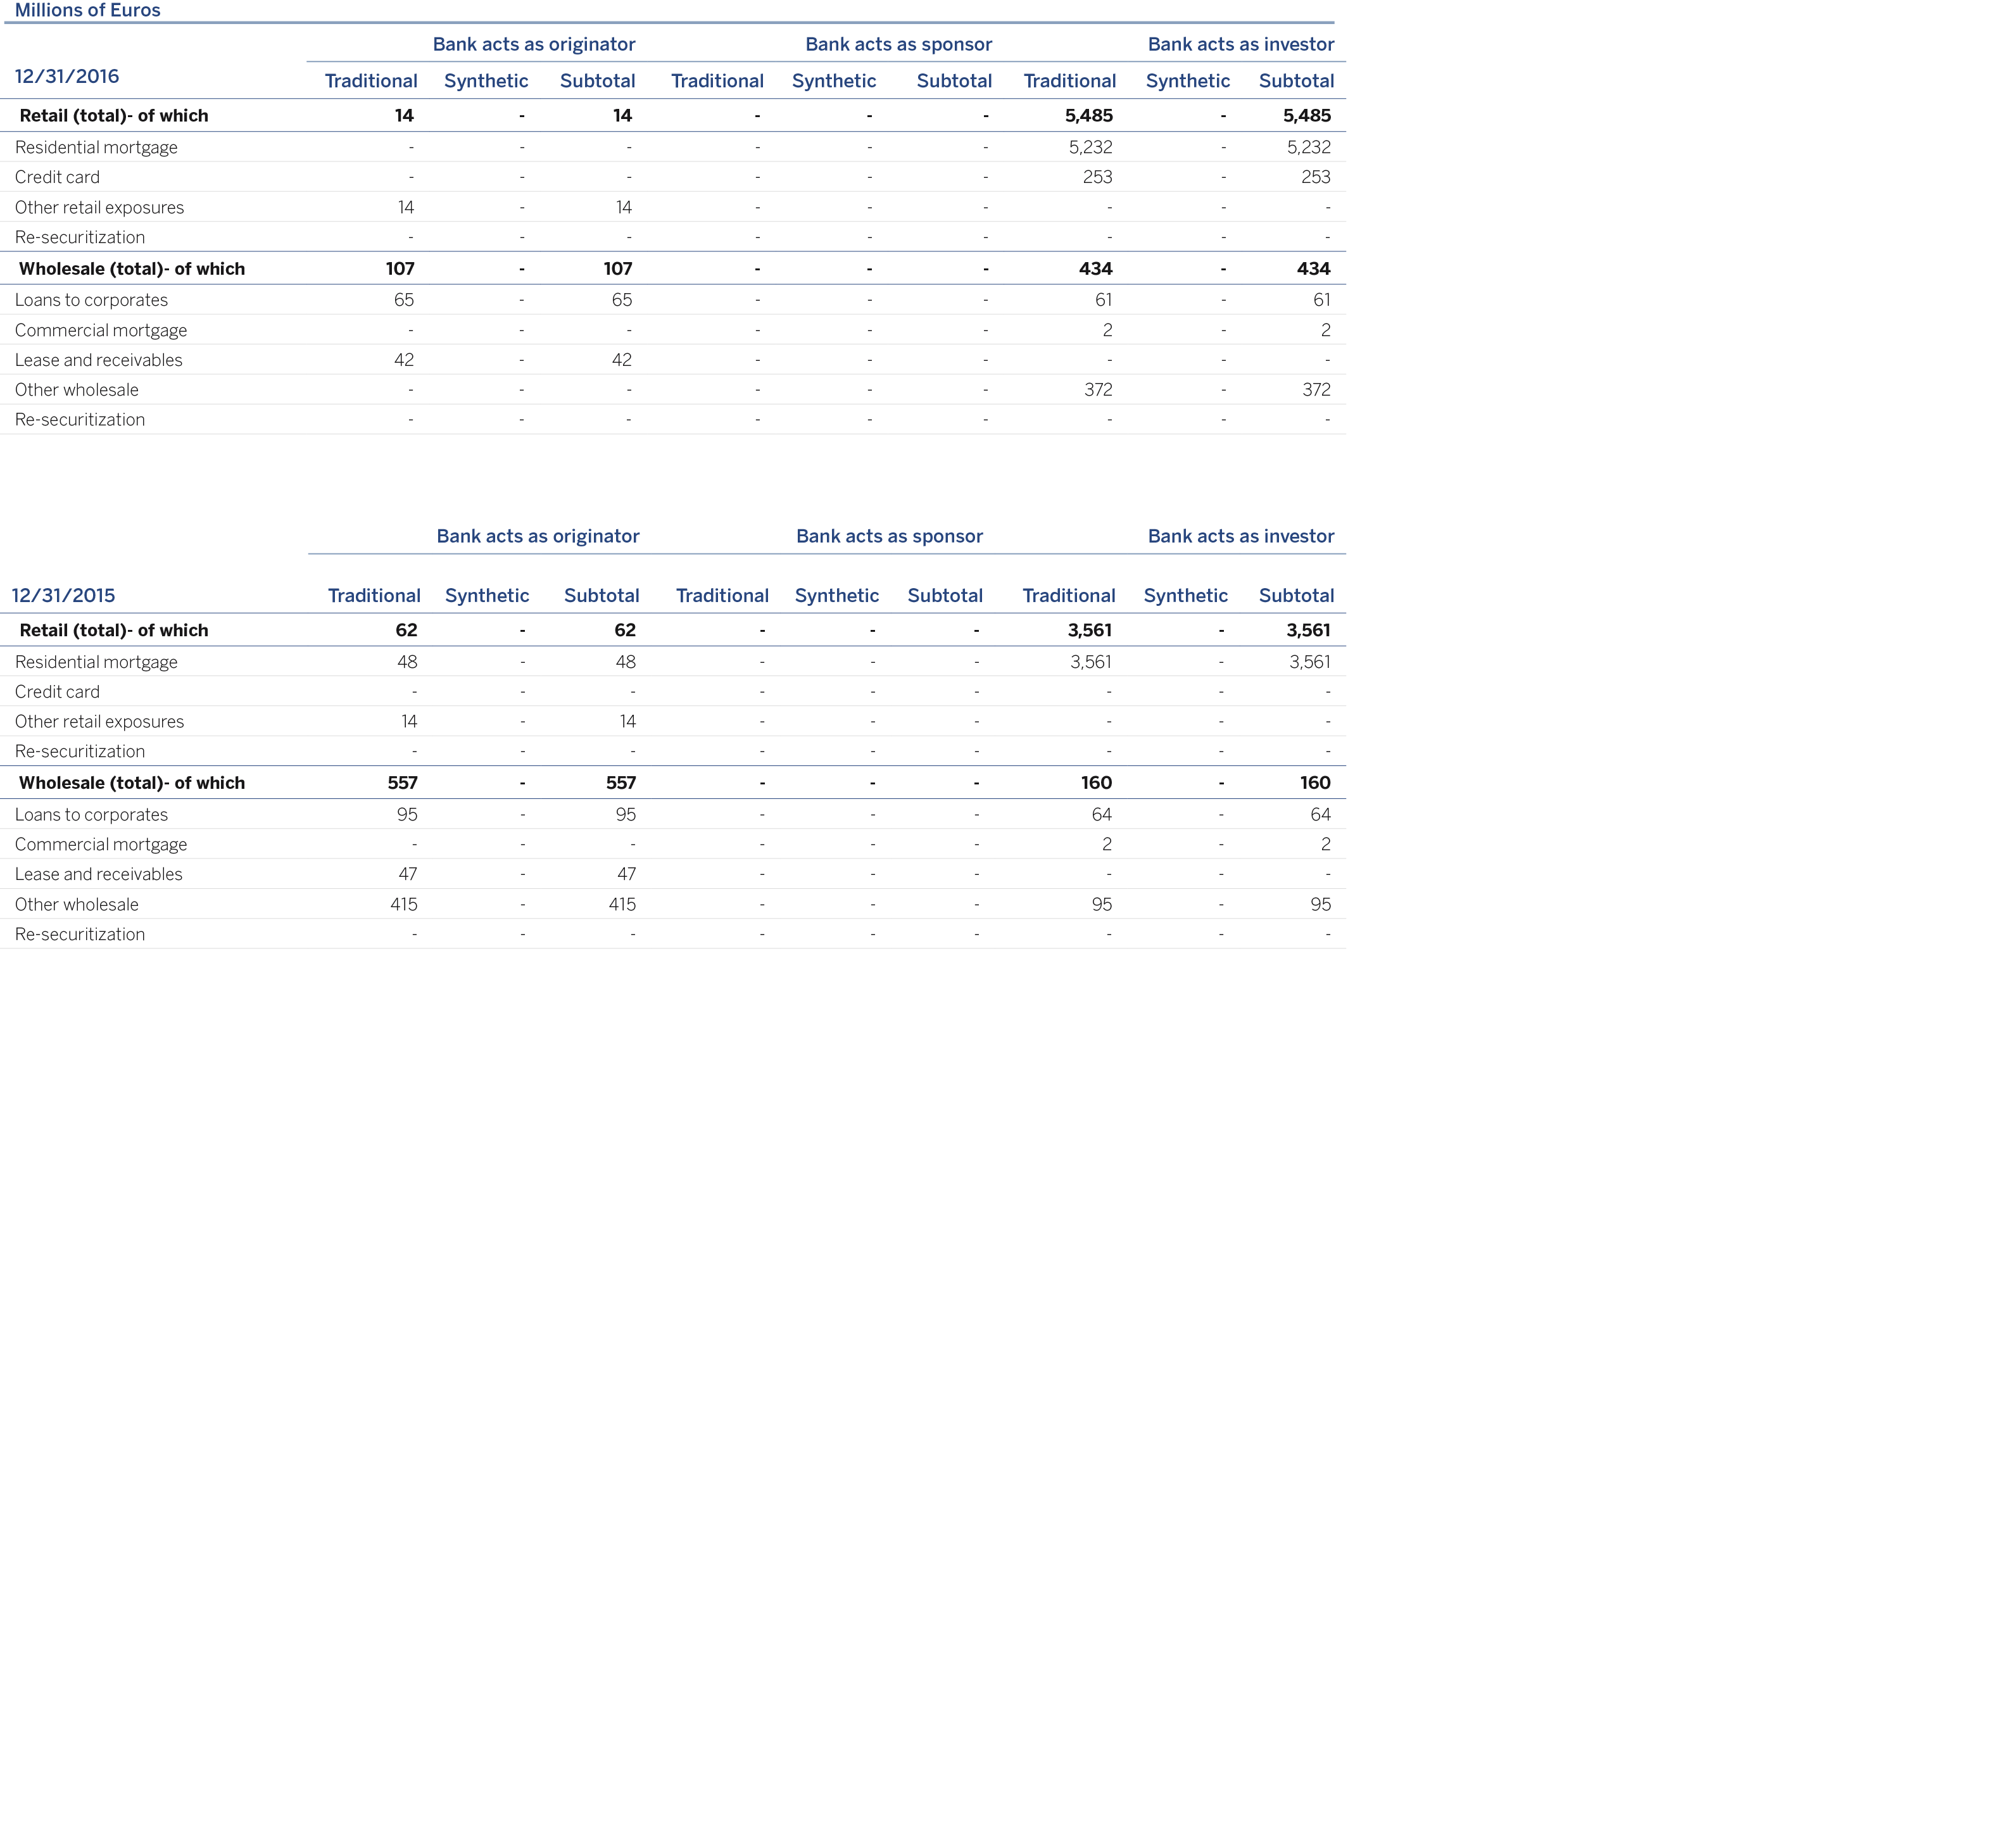
A 31 de diciembre de 2016, así como a 31 de diciembre de 2015, el Grupo no presenta exposiciones de titulización en la cartera de negociación.
The table below shows the amounts in terms of EAD and RWAs of investment securitization positions by type of exposure, tranches and weighting ranges and their respective capital requirements as of December 31, 2016 and December 31, 2015.
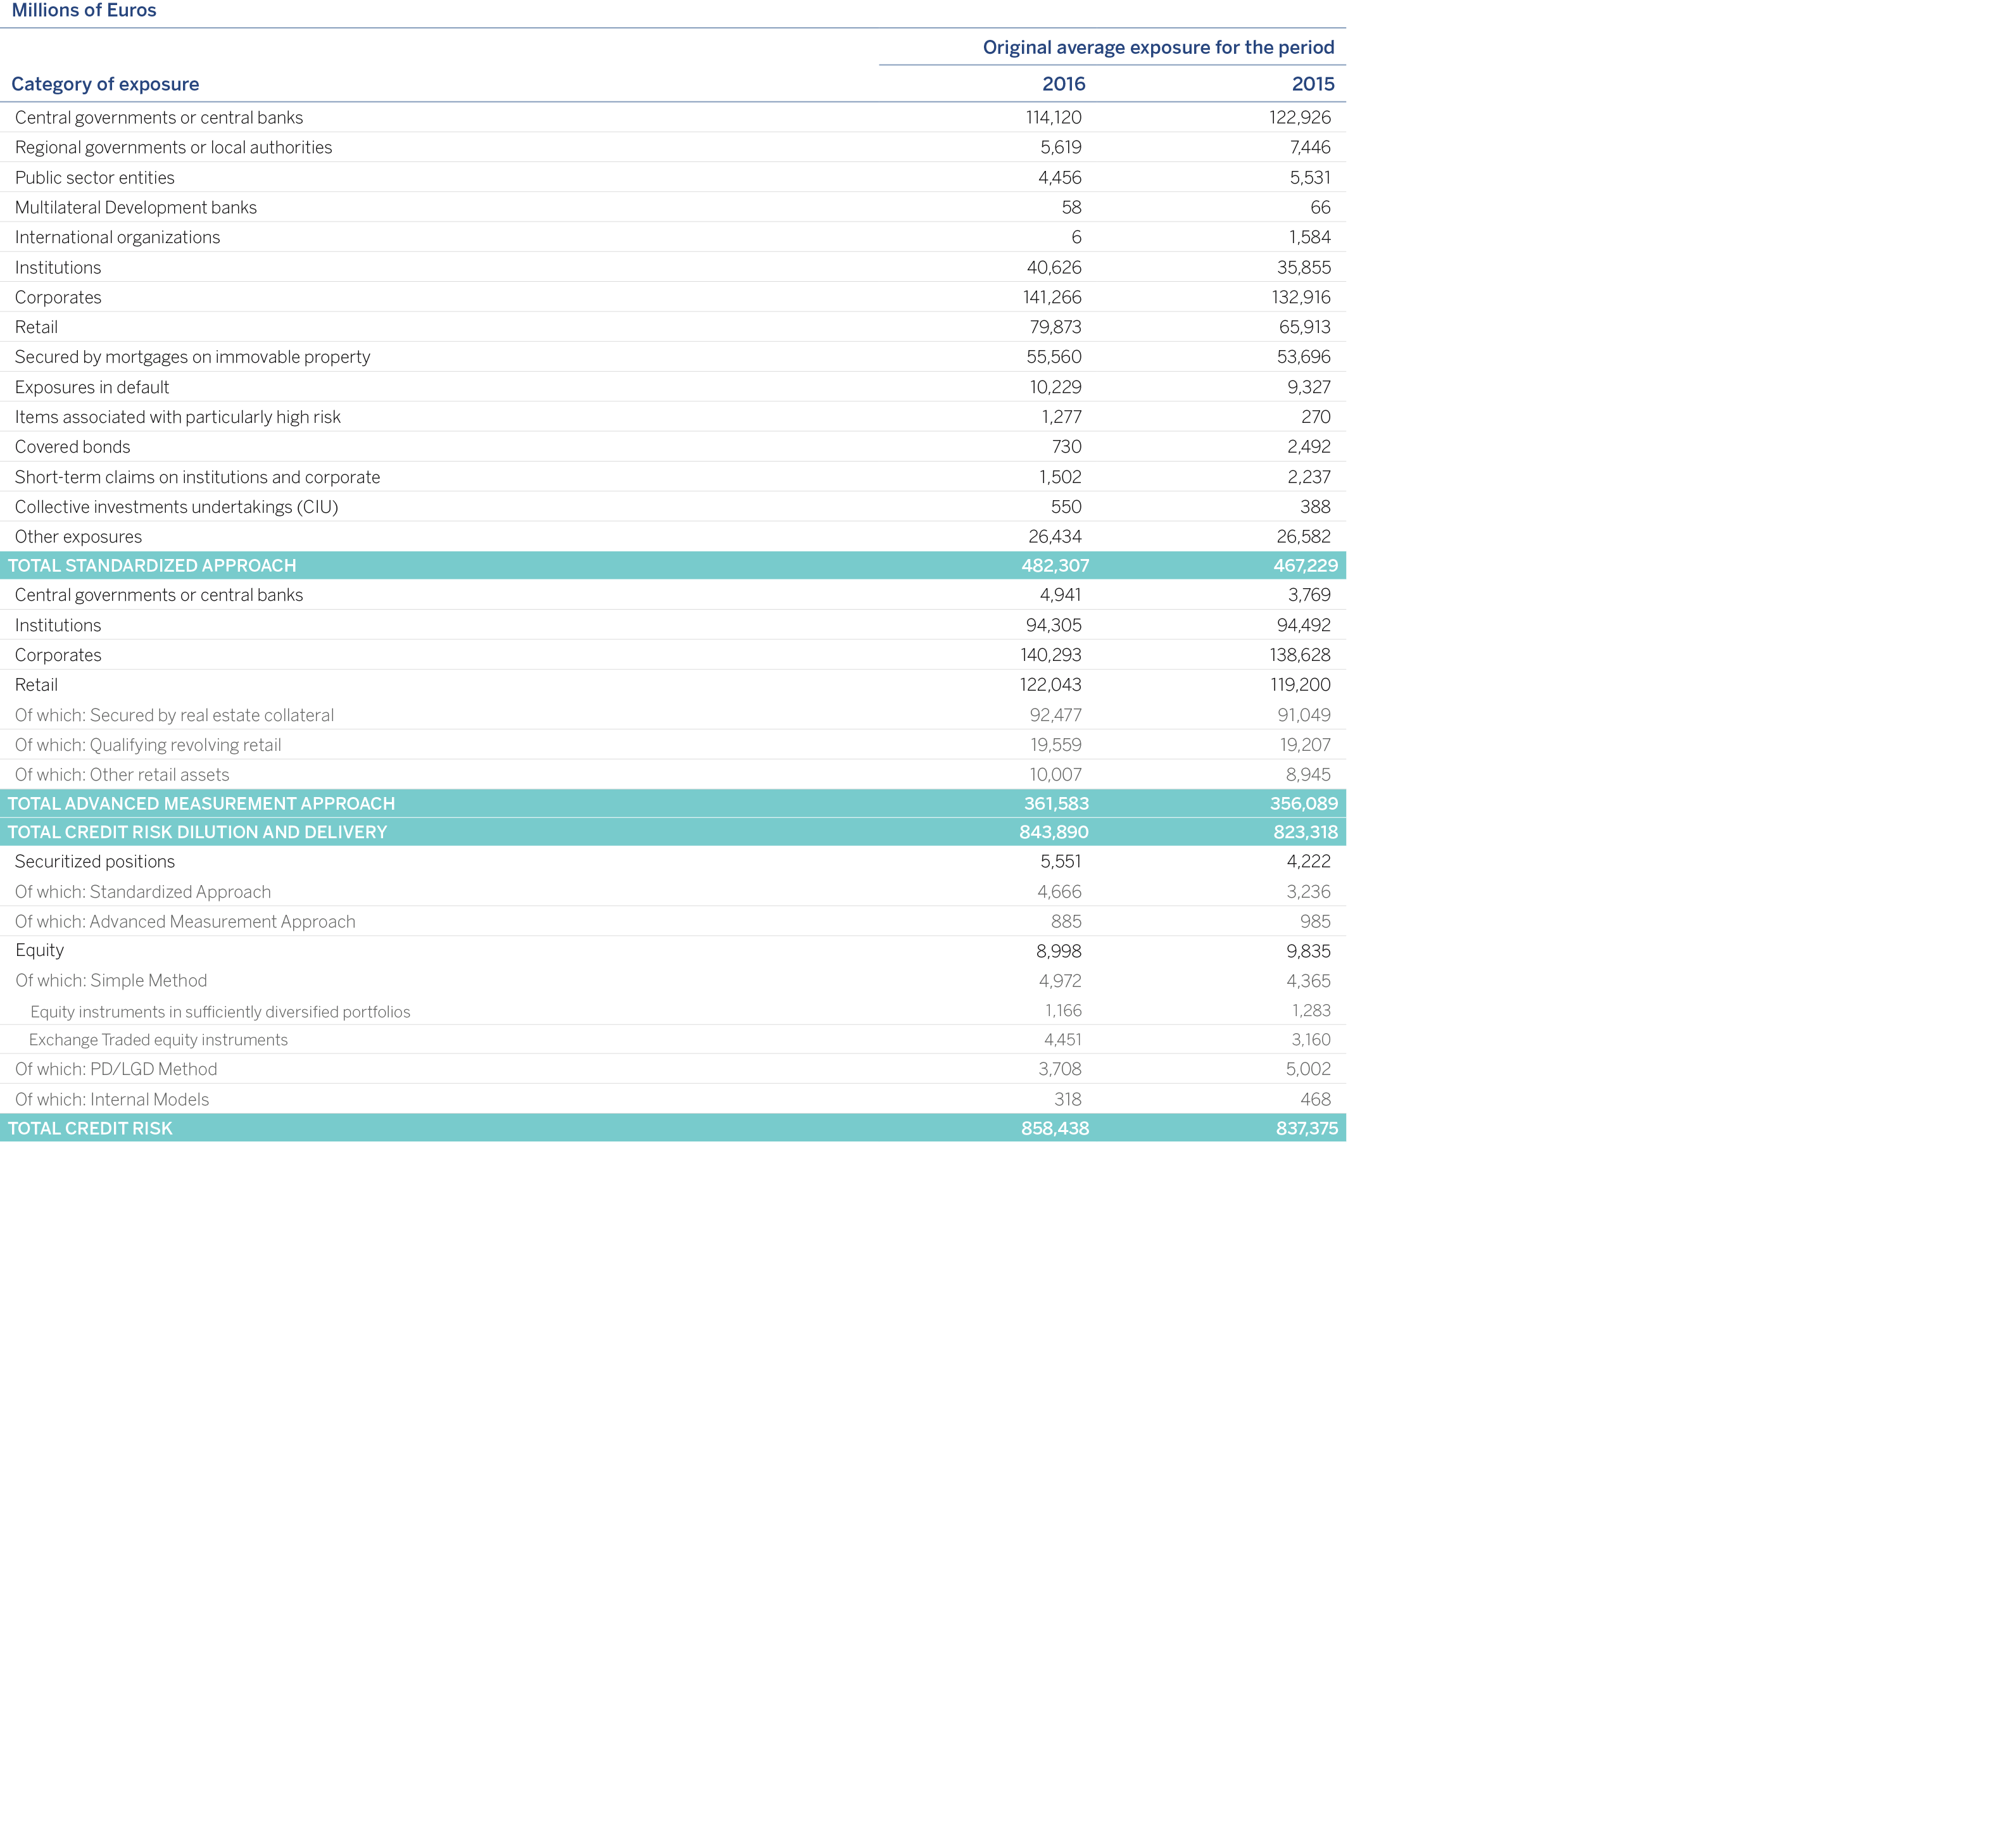
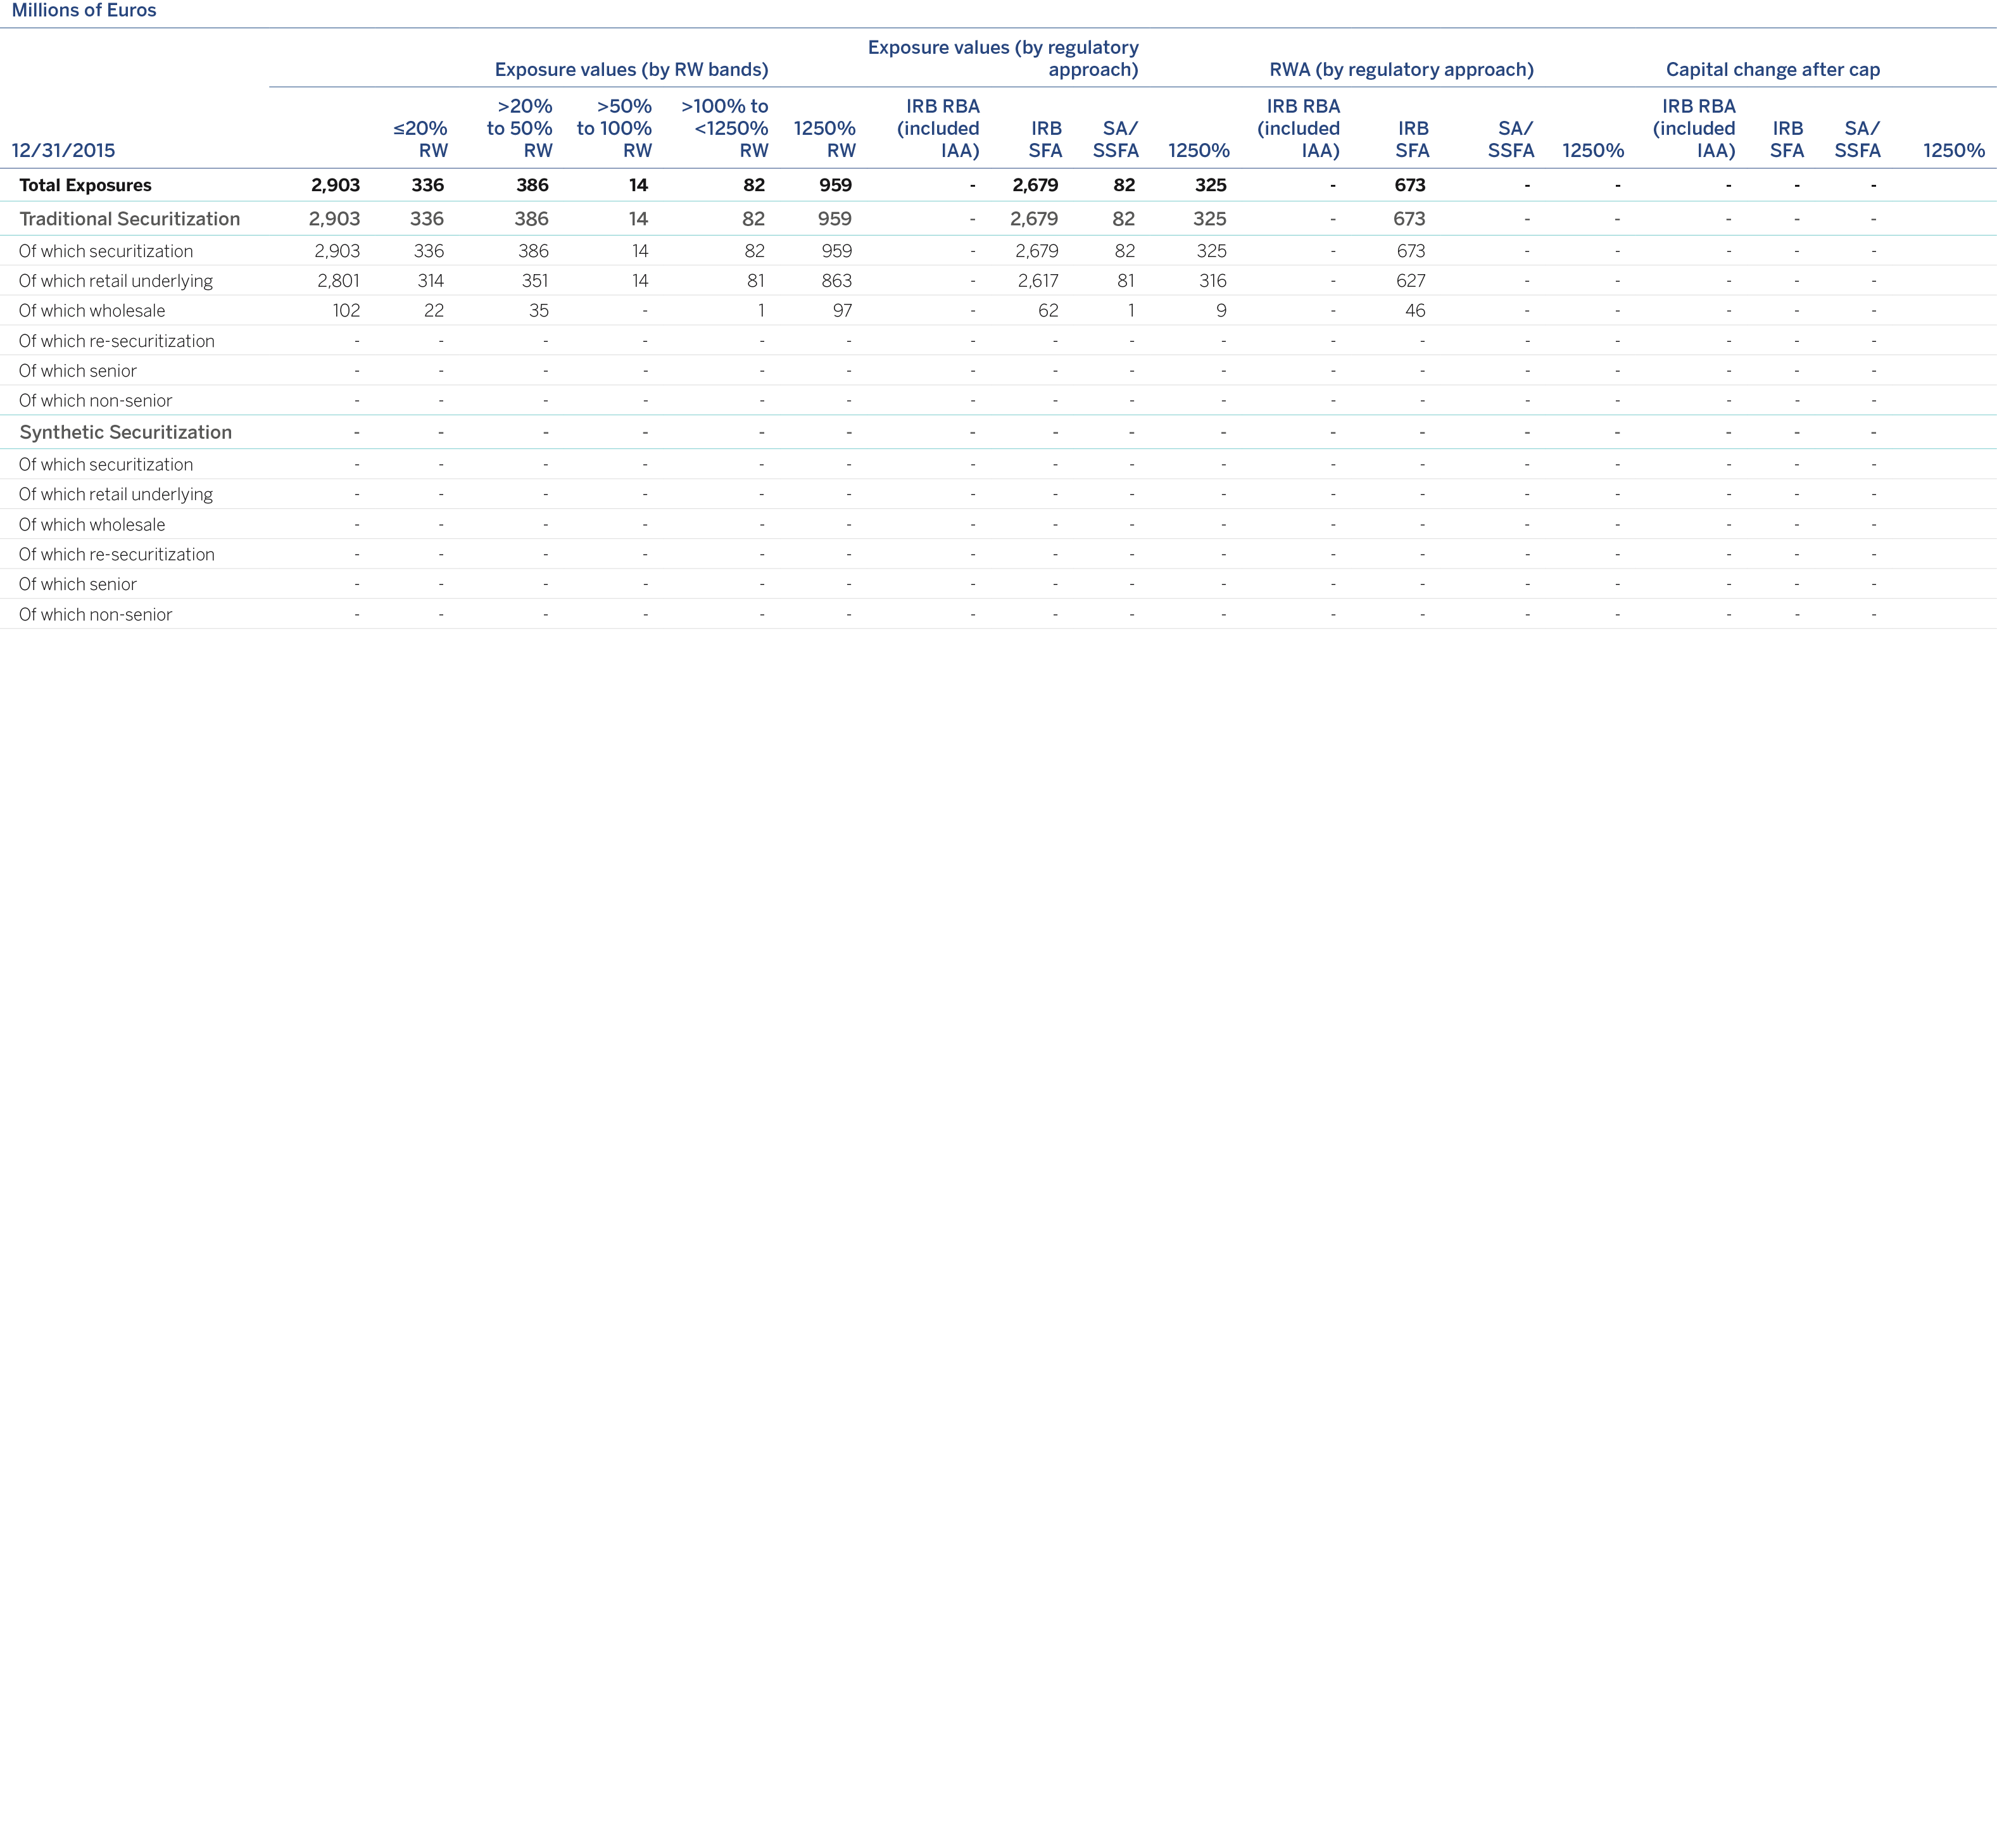
Below are the main variations in terms of RWAs during the period related to the investment and retained securitizations:

The external credit assessment institutions (ECAI) that have been involved in the Group's issues that fulfill the criteria of risk transfer and fall within the securitizations solvency framework are, generally, Fitch, Moody’s, S&P and DBRS. The types of securitization exposure for which each Agency is used are, with no differentiation between the different agencies, all the asset types that tend to be used as residential mortgage loans, loans to SMEs and small companies, consumer finance and autos and leasing.
In all the SSPEs, the agencies have assessed the risk of the entire issuance structure:
Awarding ratings to all bond tranches.
Establishing the volume of the credit enhancement.
Establishing the necessary triggers (early termination of the restitution period, prorata amortization of AAA classes, pro-rata amortization of series subordinated to AAA and amortization of the reserve fund, amongst others).
In each and every one of the issues, in addition to the initial rating, the agencies carry out regular quarterly monitoring.
The table below shows the amounts in terms of EAD and RWAs of investment securitization positions originated by type of exposure, tranches and weighting ranges corresponding to the securitizations and their corresponding capital requirements as of December 31, 2016 and December 31, 2015.
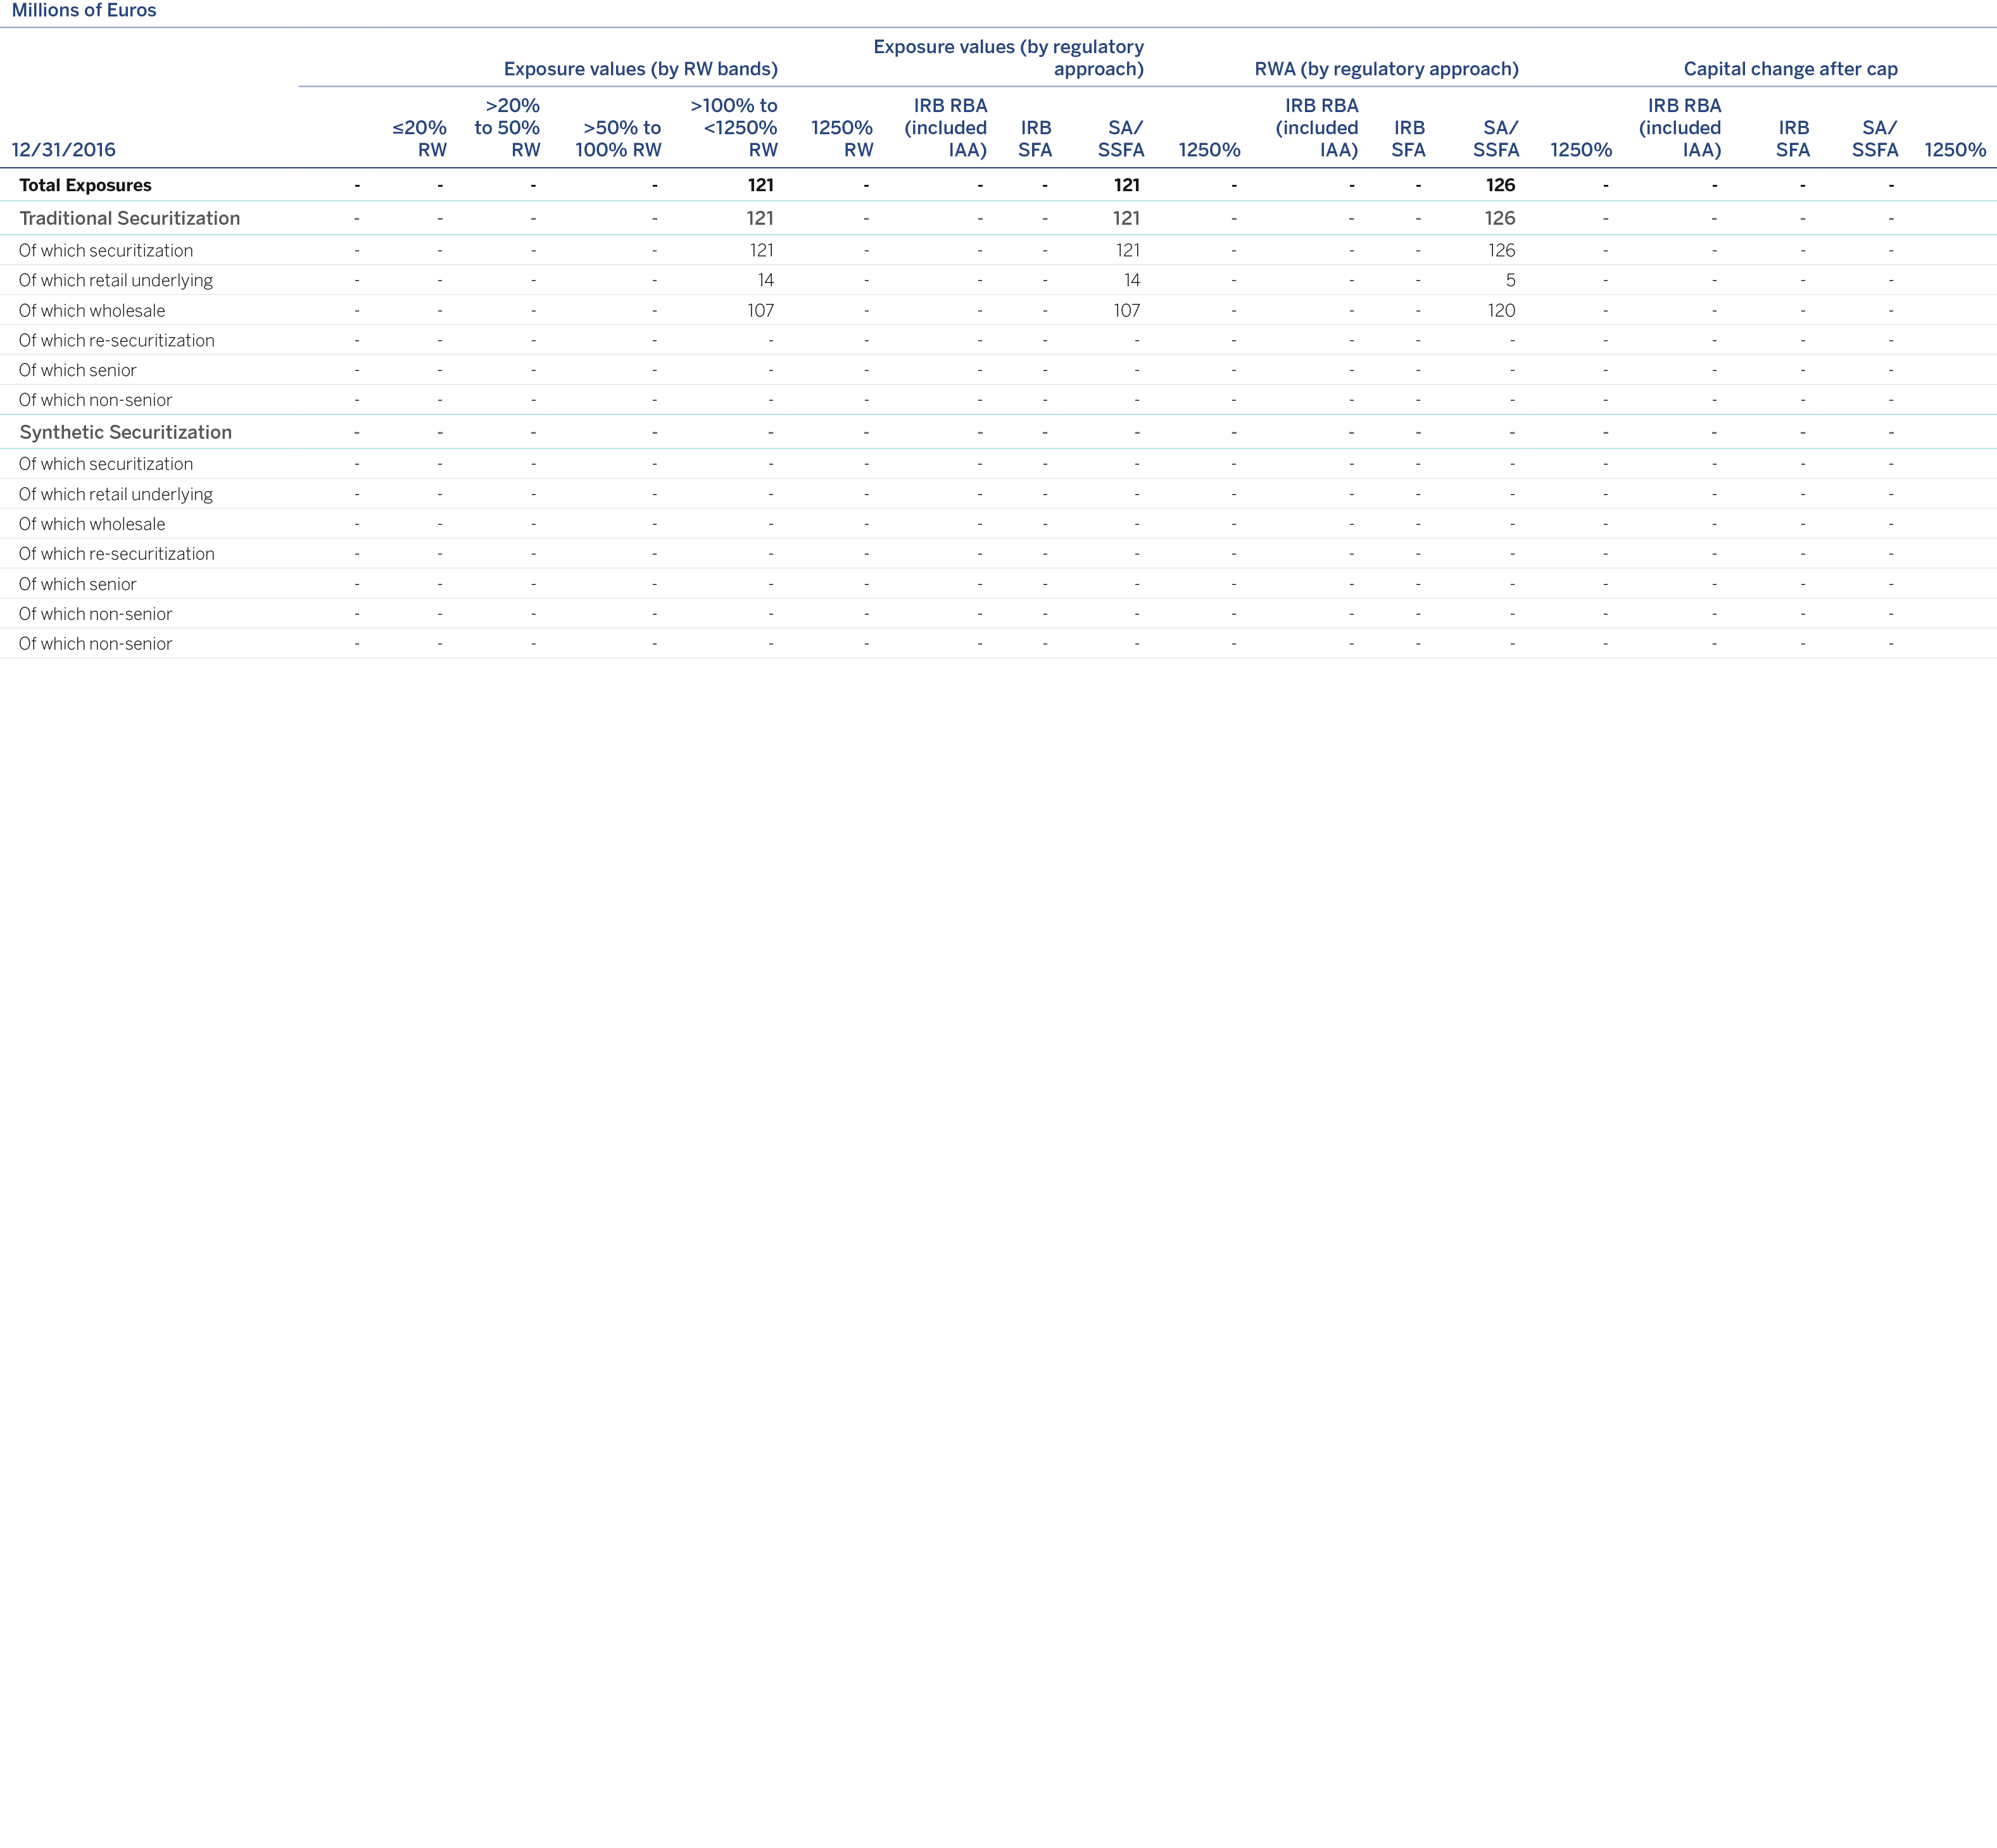
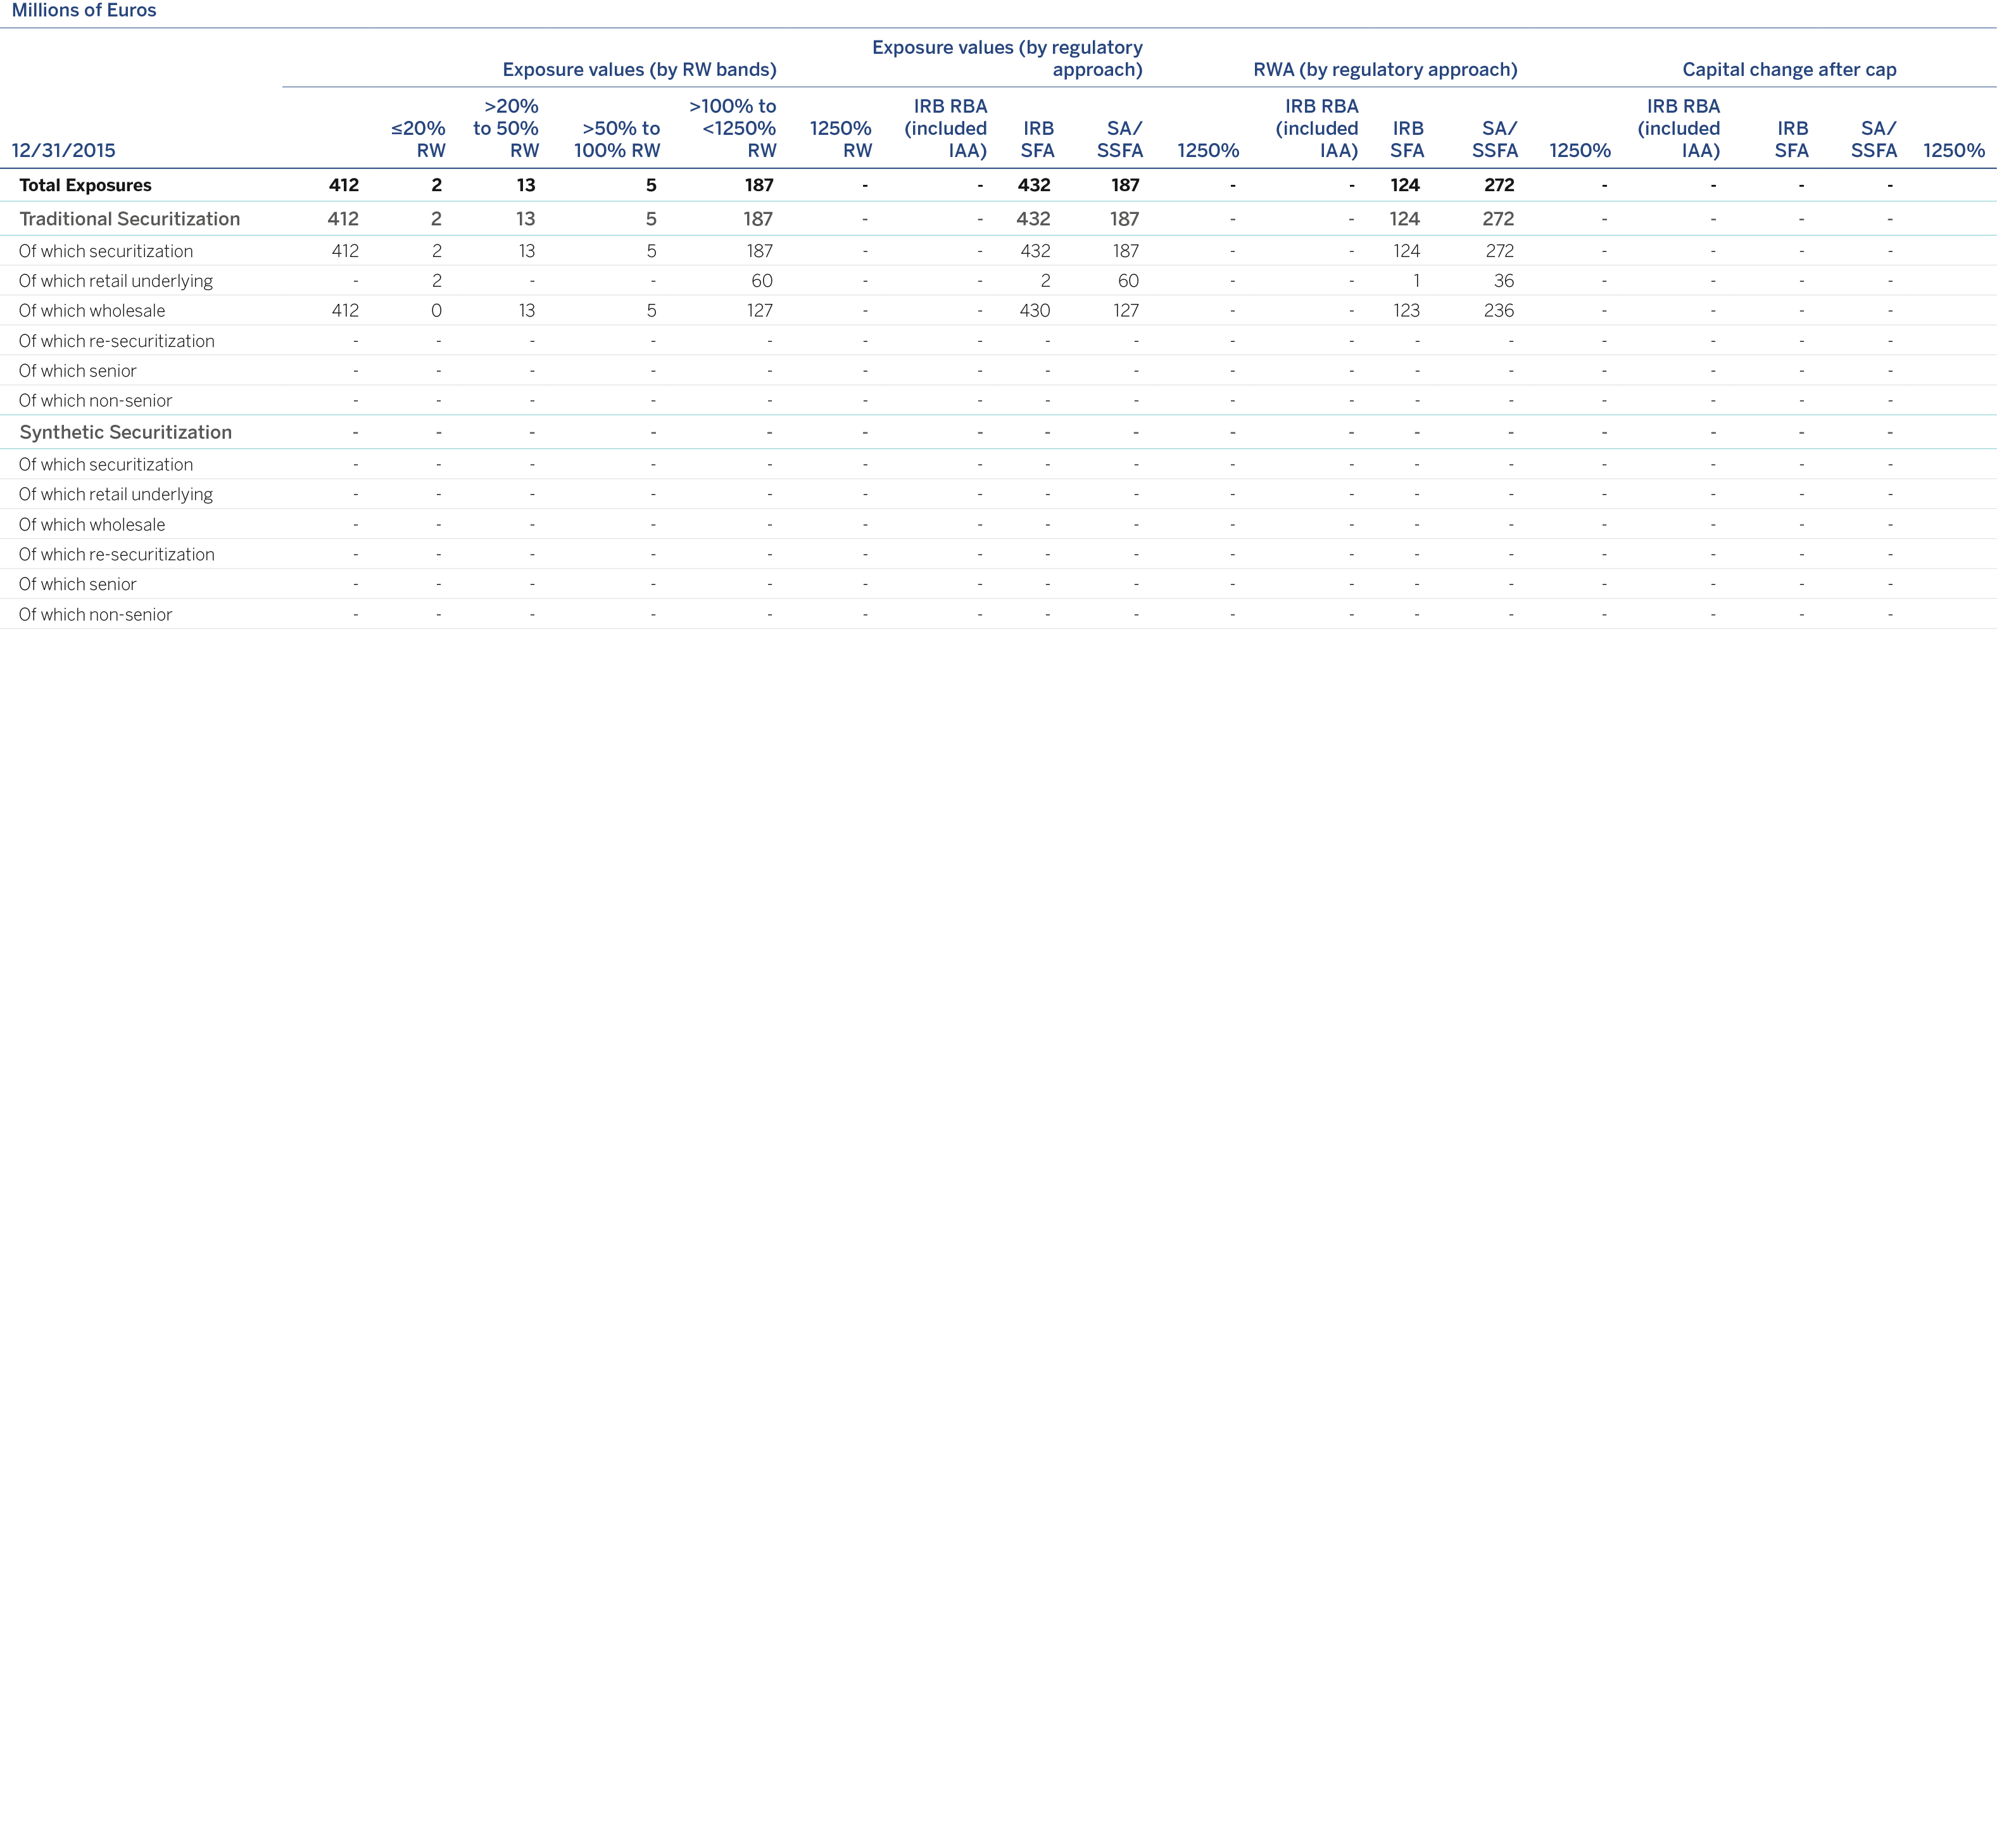
The next tables give the current outstanding balance, non-performing exposures and impairment losses recognized in the period corresponding to the underlying assets of originated securitizations, in which risk transfer criteria are fulfilled, broken down by type of asset, as of December 31, 2016 and December 31, 2015.
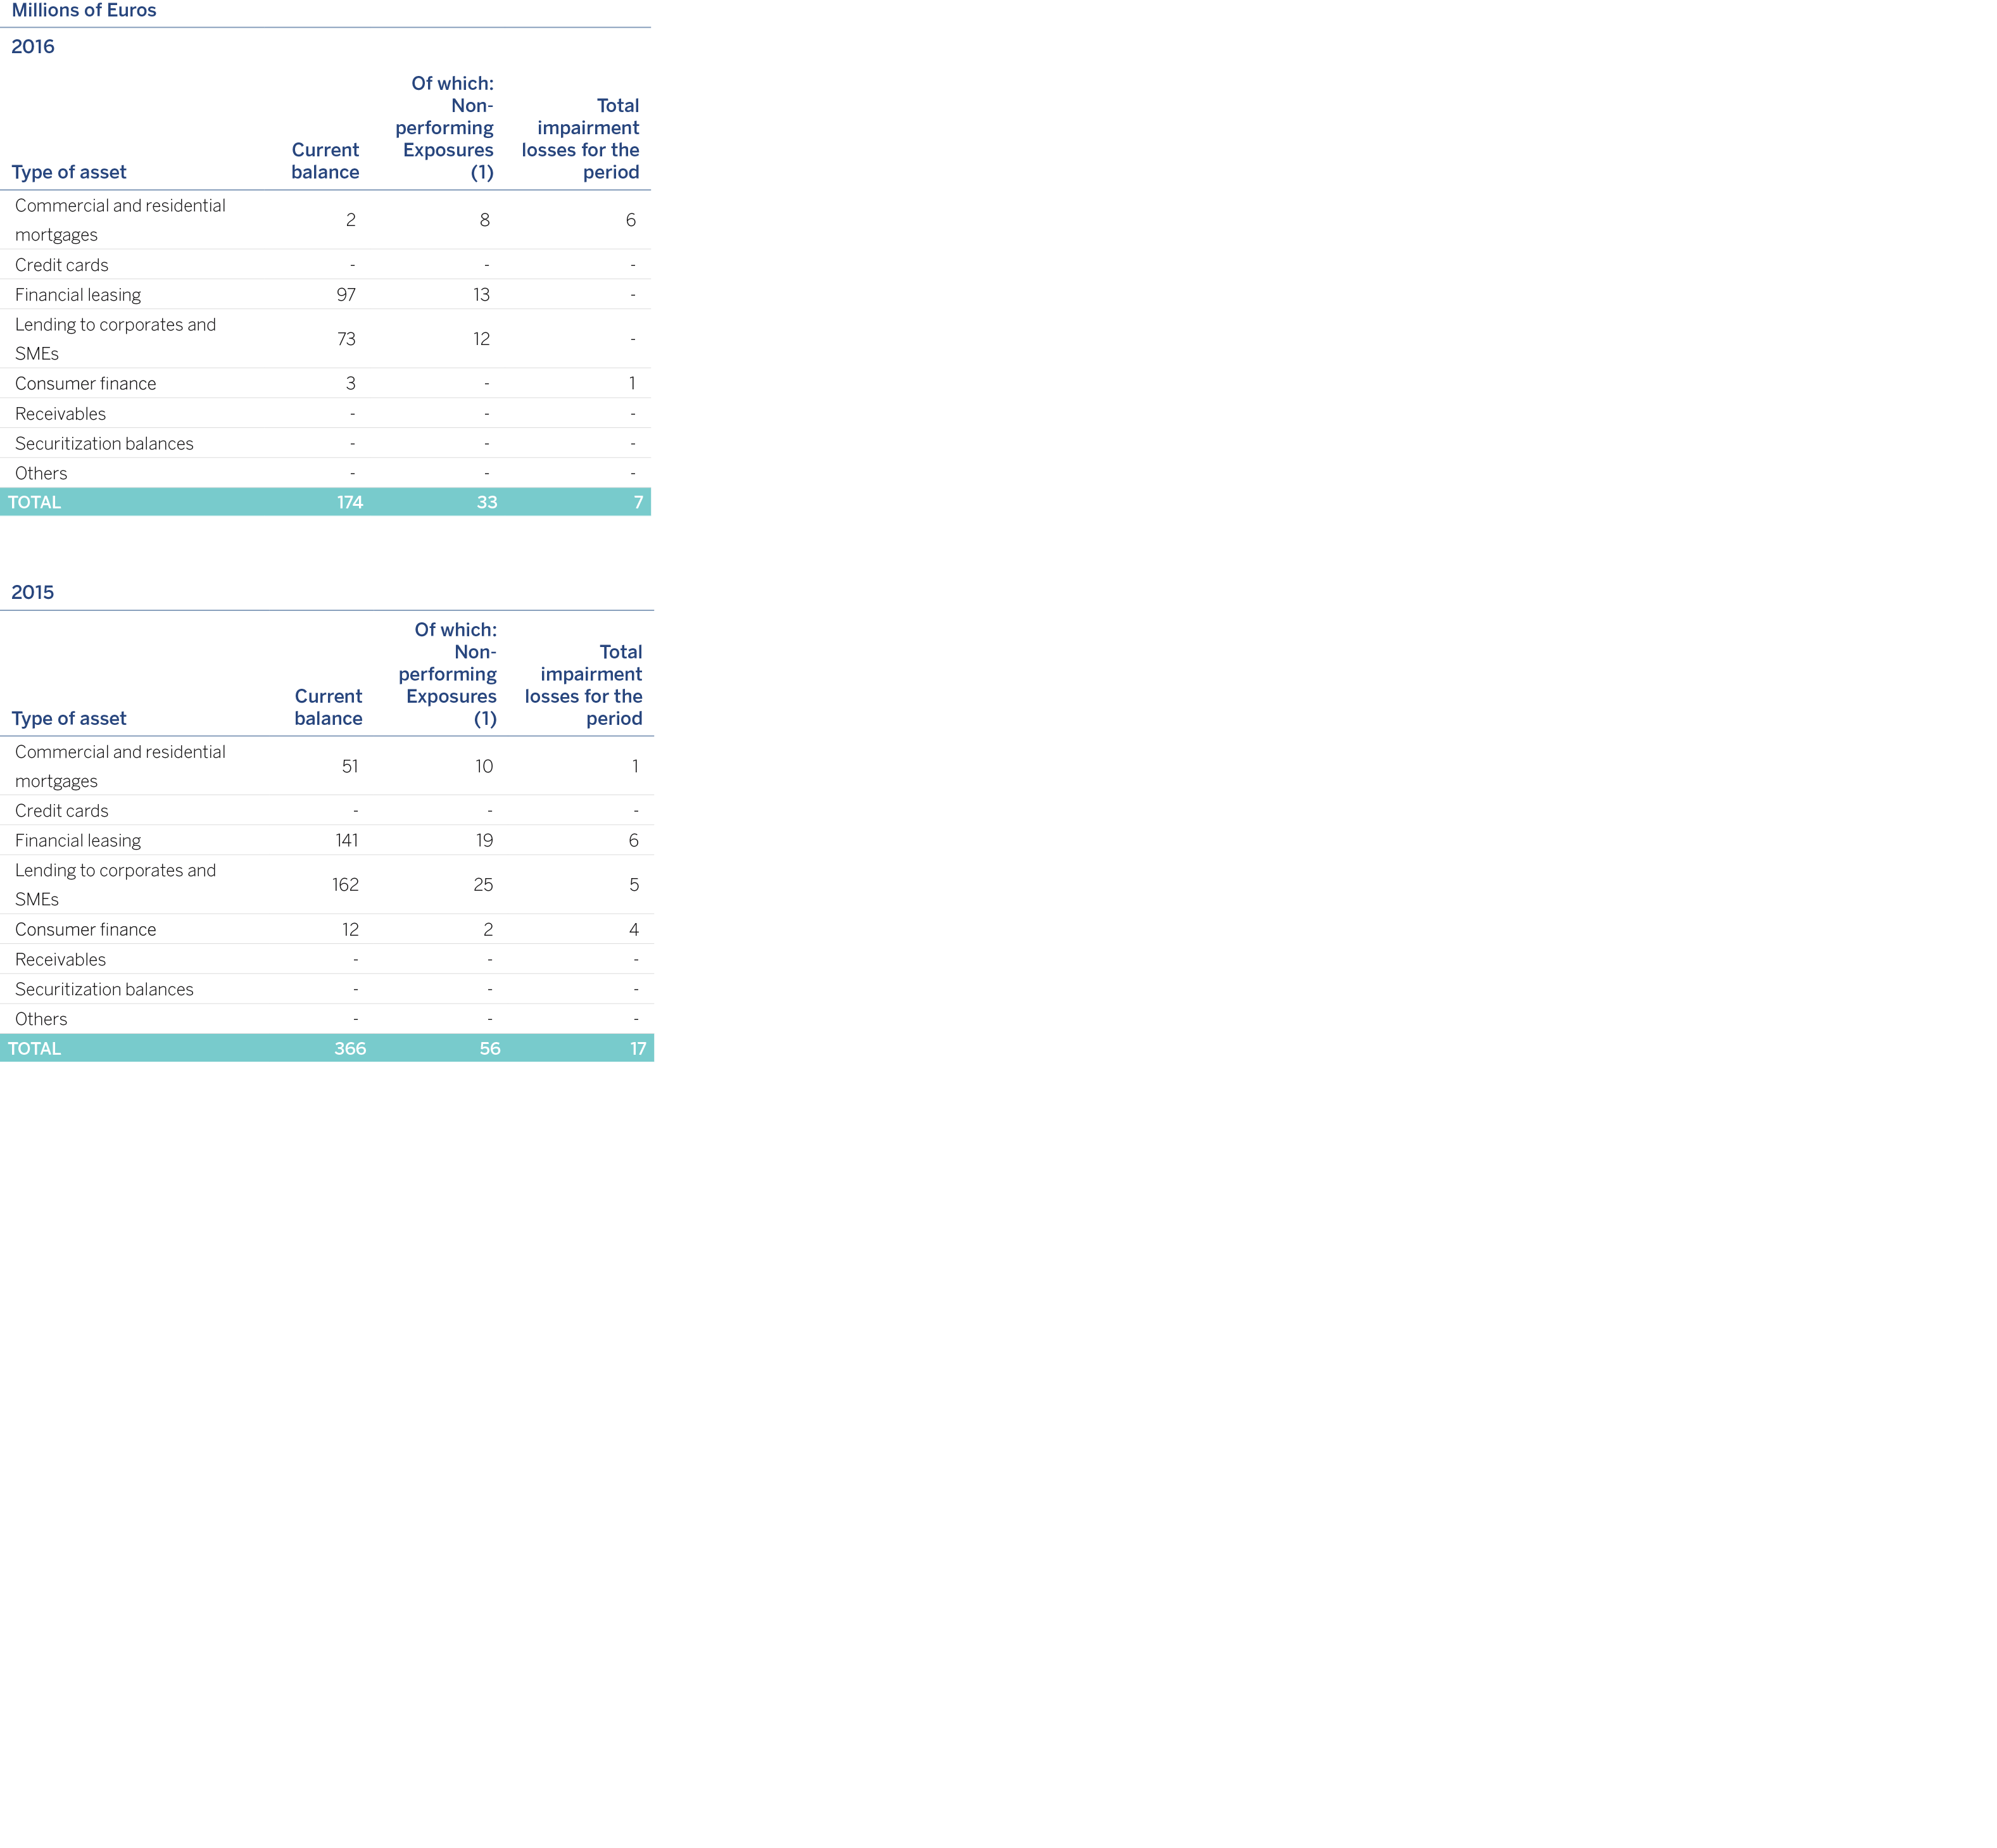
In 2016 and 2015, there were no securitizations that fulfill the transfer criteria according to the requirements of the solvency regulation, and, therefore, no results were recognized.
BBVA has been the structurer of all transactions effected since 2006 (excluding the transactions for the merged companies Unnim and Catalunya Banc).
The table below shows the outstanding balance of underlying assets of securitizations originated by the Group, in which risk transfer criteria are not fulfilled. These, therefore, are not included in the solvency framework for securitizations; the capital exposed is calculated as if they had not been securitized:
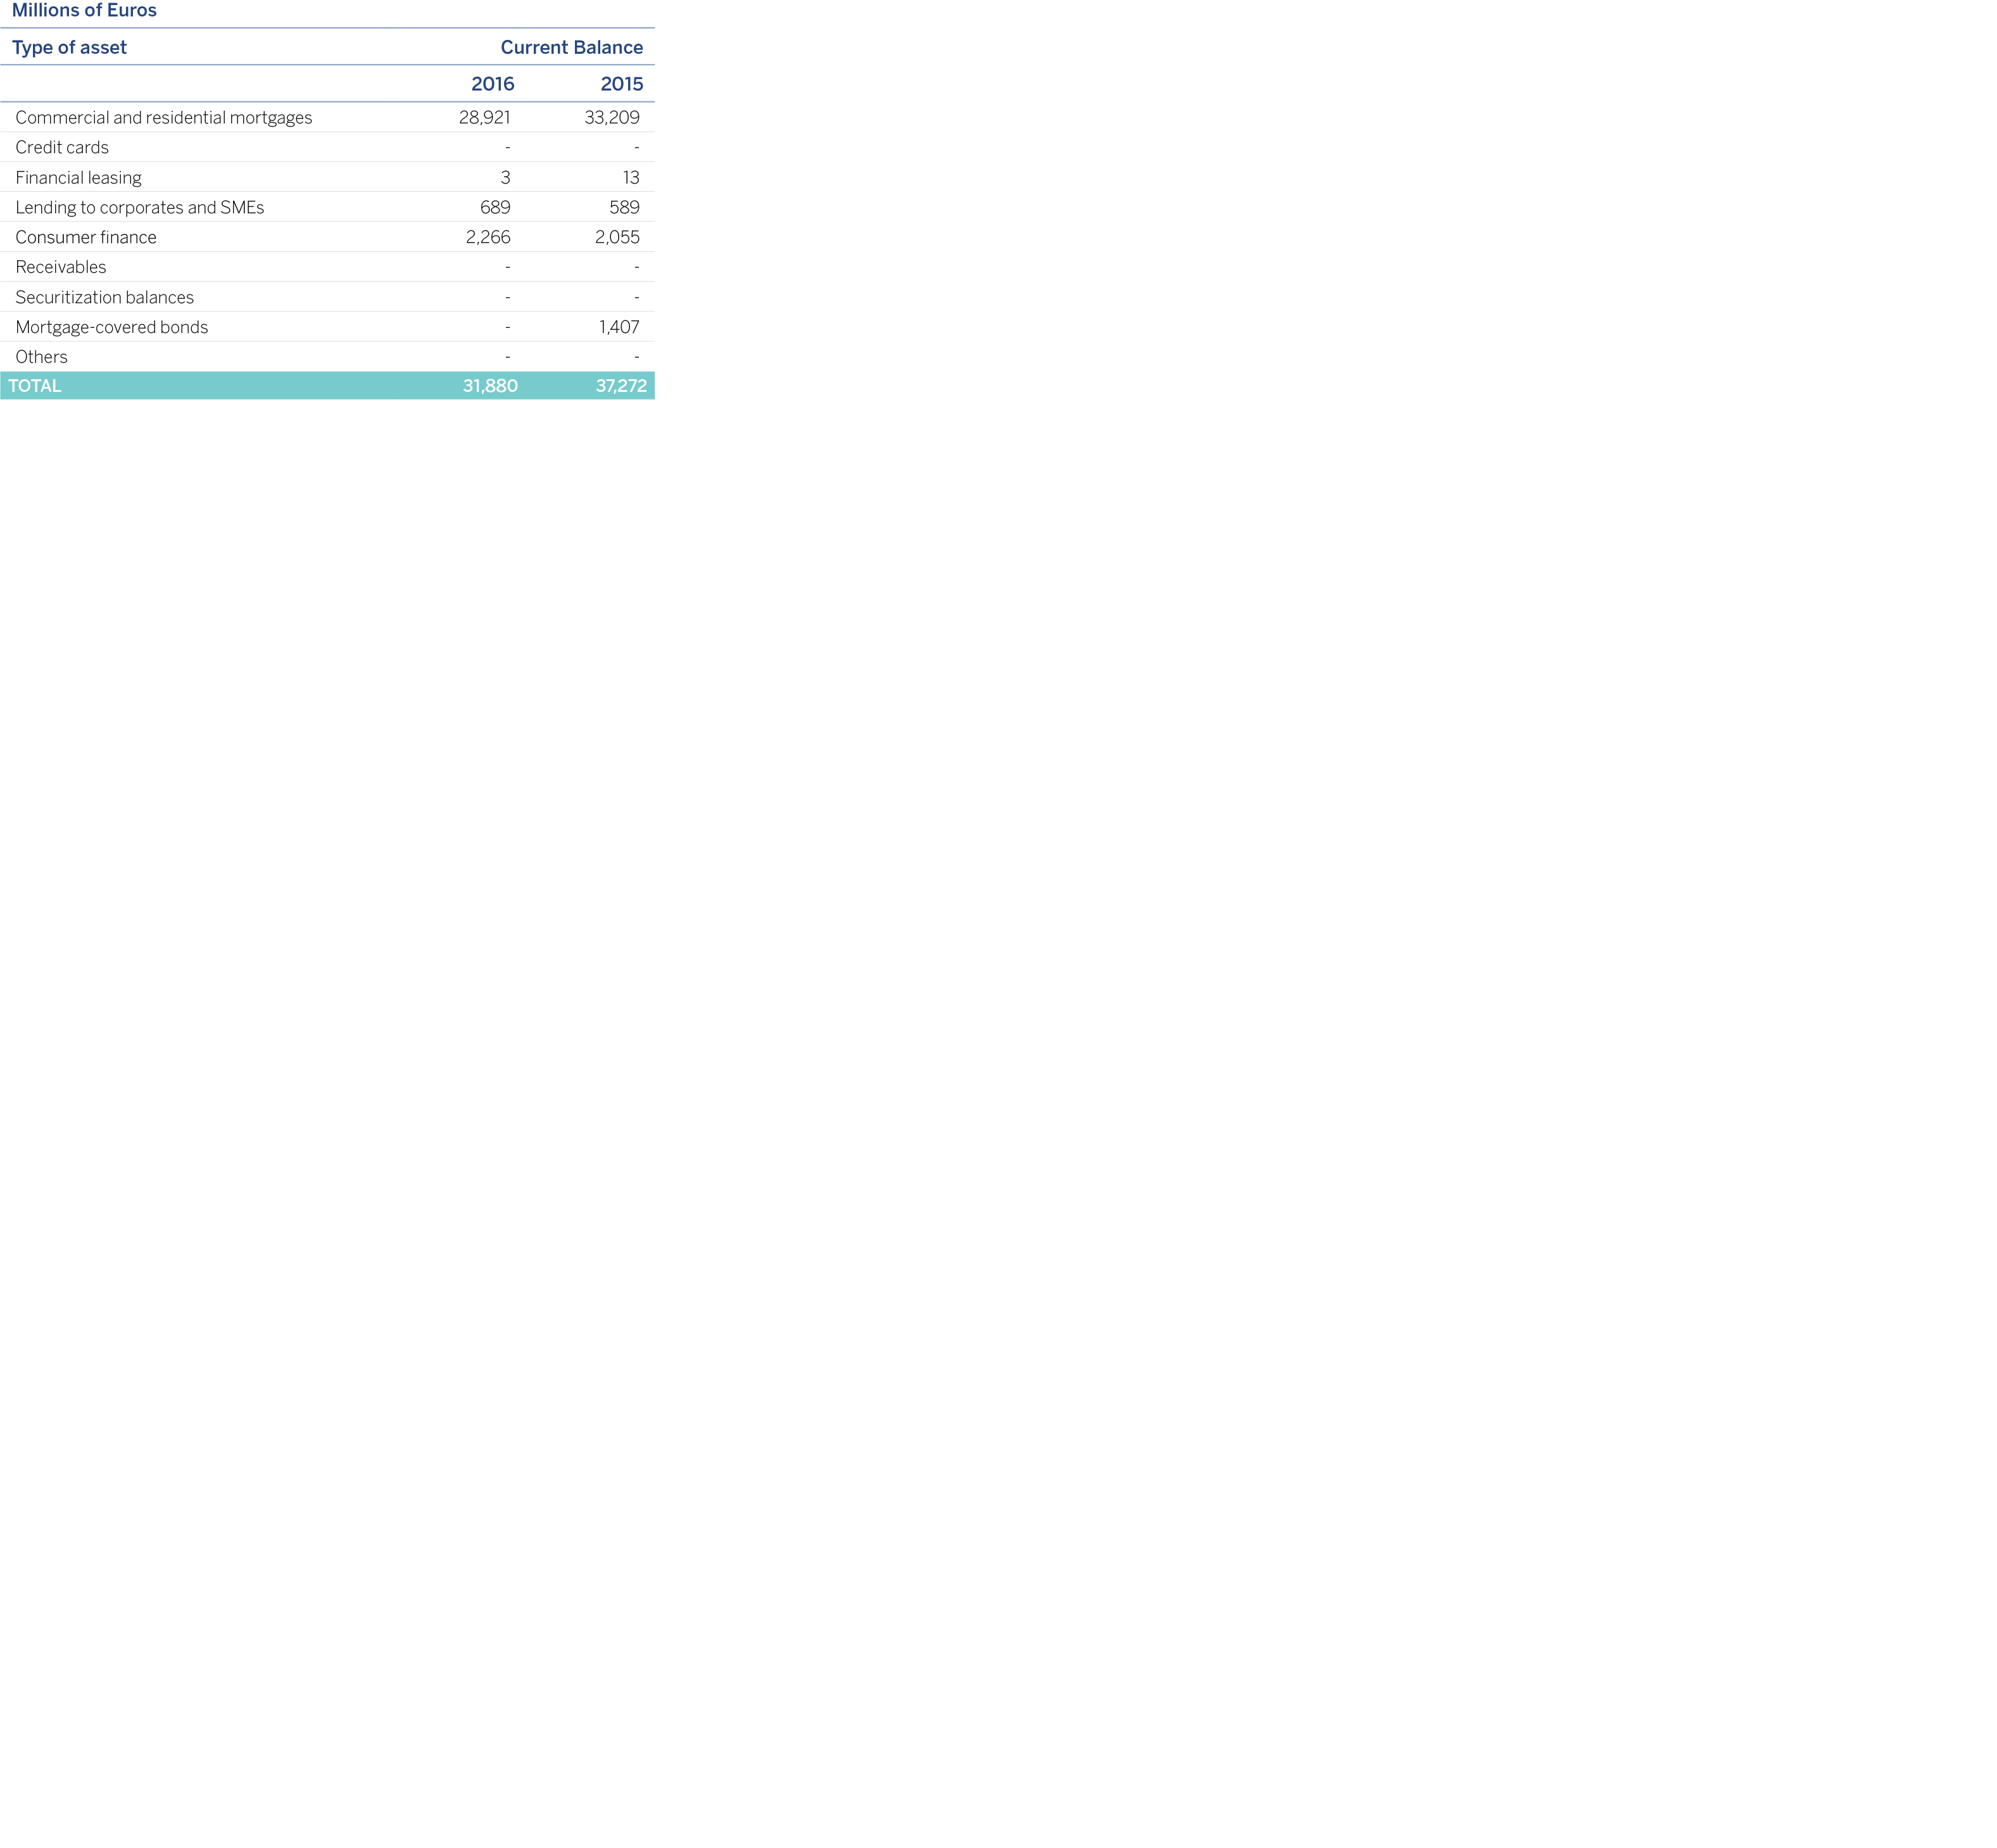
Within the limits established by the rules on netting in each one of its operating countries, the Group negotiates with its customers the assignment of the derivatives business to master agreements (e.g., "ISDA" or "CMOF") that include the netting of off-balance sheet transactions.
The clauses of each agreement determine in each case the transactions subject to netting.
The mitigation of counterparty credit risk exposure stemming from the use of mitigation techniques (netting plus the use of collateral agreements) leads to a reduction in overall exposure (current market value plus potential risk).
As pointed out above, financial assets and liabilities may be the object of netting, in other words presentation for a net amount on the balance sheet, only when the Group's entities comply with the provisions of IAS 32 - Paragraph 42, and thus have the legal right to offset the amounts recognized, and the intention to settle the net amount or to divest the asset and pay the liability at the same time.
The procedures for management and valuation of collateral are included in the Specific Collateral Rules, or in the Policies and Procedures for Retail and Wholesale Credit Risk.
These Policies and Procedures lay down the basic principles of credit risk management, which includes the management of the collateral assigned in transactions with customers.
Accordingly, the risk management model jointly values the existence of a suitable cash flow generation by the obligor that enables them to service the debt, together with the existence of suitable and sufficient guarantees that ensure the recovery of the credit when the obligor’s circumstances render them unable to meet their obligations.
The valuation of the collateral is governed by prudential principles that involve the use of appraisal for real-estate guarantees, market price for shares, quoted value of shares in a mutual fund, etc.
The milestones under which the valuations of the collaterals must be updated in accordance with local regulation are established under these prudential principles.
With respect to the entities that carry out the valuation of the collateral, principles are in place in accordance with local regulations that govern their level of relationship and dependence with the Group and their recognition by the local regulator. These valuations will be updated by statistical methods, indices or appraisals of goods, which shall be carried out under the generally accepted standards in each market and in accordance with local regulations.
All collateral assigned is to be properly instrumented and recorded in the corresponding register, and approved by the Group’s legal units.
As collateral for the purpose of calculating equity, the Group uses the coverage established in the solvency regulations. The following are the main collaterals available in the Group:
Mortgage collateral: The collateral is the property upon which the loan is arranged.
Financial collateral: Their object is any one of the following financial assets, as per articles 197 and 198 of the solvency regulations.
Cash deposits, deposit certificates or similar securities.
Debt securities issued for the different categories.
Shares or convertible bonds.
Other property and rights used as collateral. The following property and rights are considered acceptable as collateral as per article 200 of the solvency regulations.
Cash deposits, deposit certificates or similar instruments held in third-party institutions other than the lending credit institution, when these are pledged in favor of the latter.
Life insurance policies pledged in favor of the lending credit institution.
Debt securities issued by other institutions, provided that these securities are to be repurchased at a pre-set price by the issuing institutions at the request of the holder of the securities.
The value of the exposure covered with financial collateral and other collateral calculated using the standardized and advanced approaches is as follows:
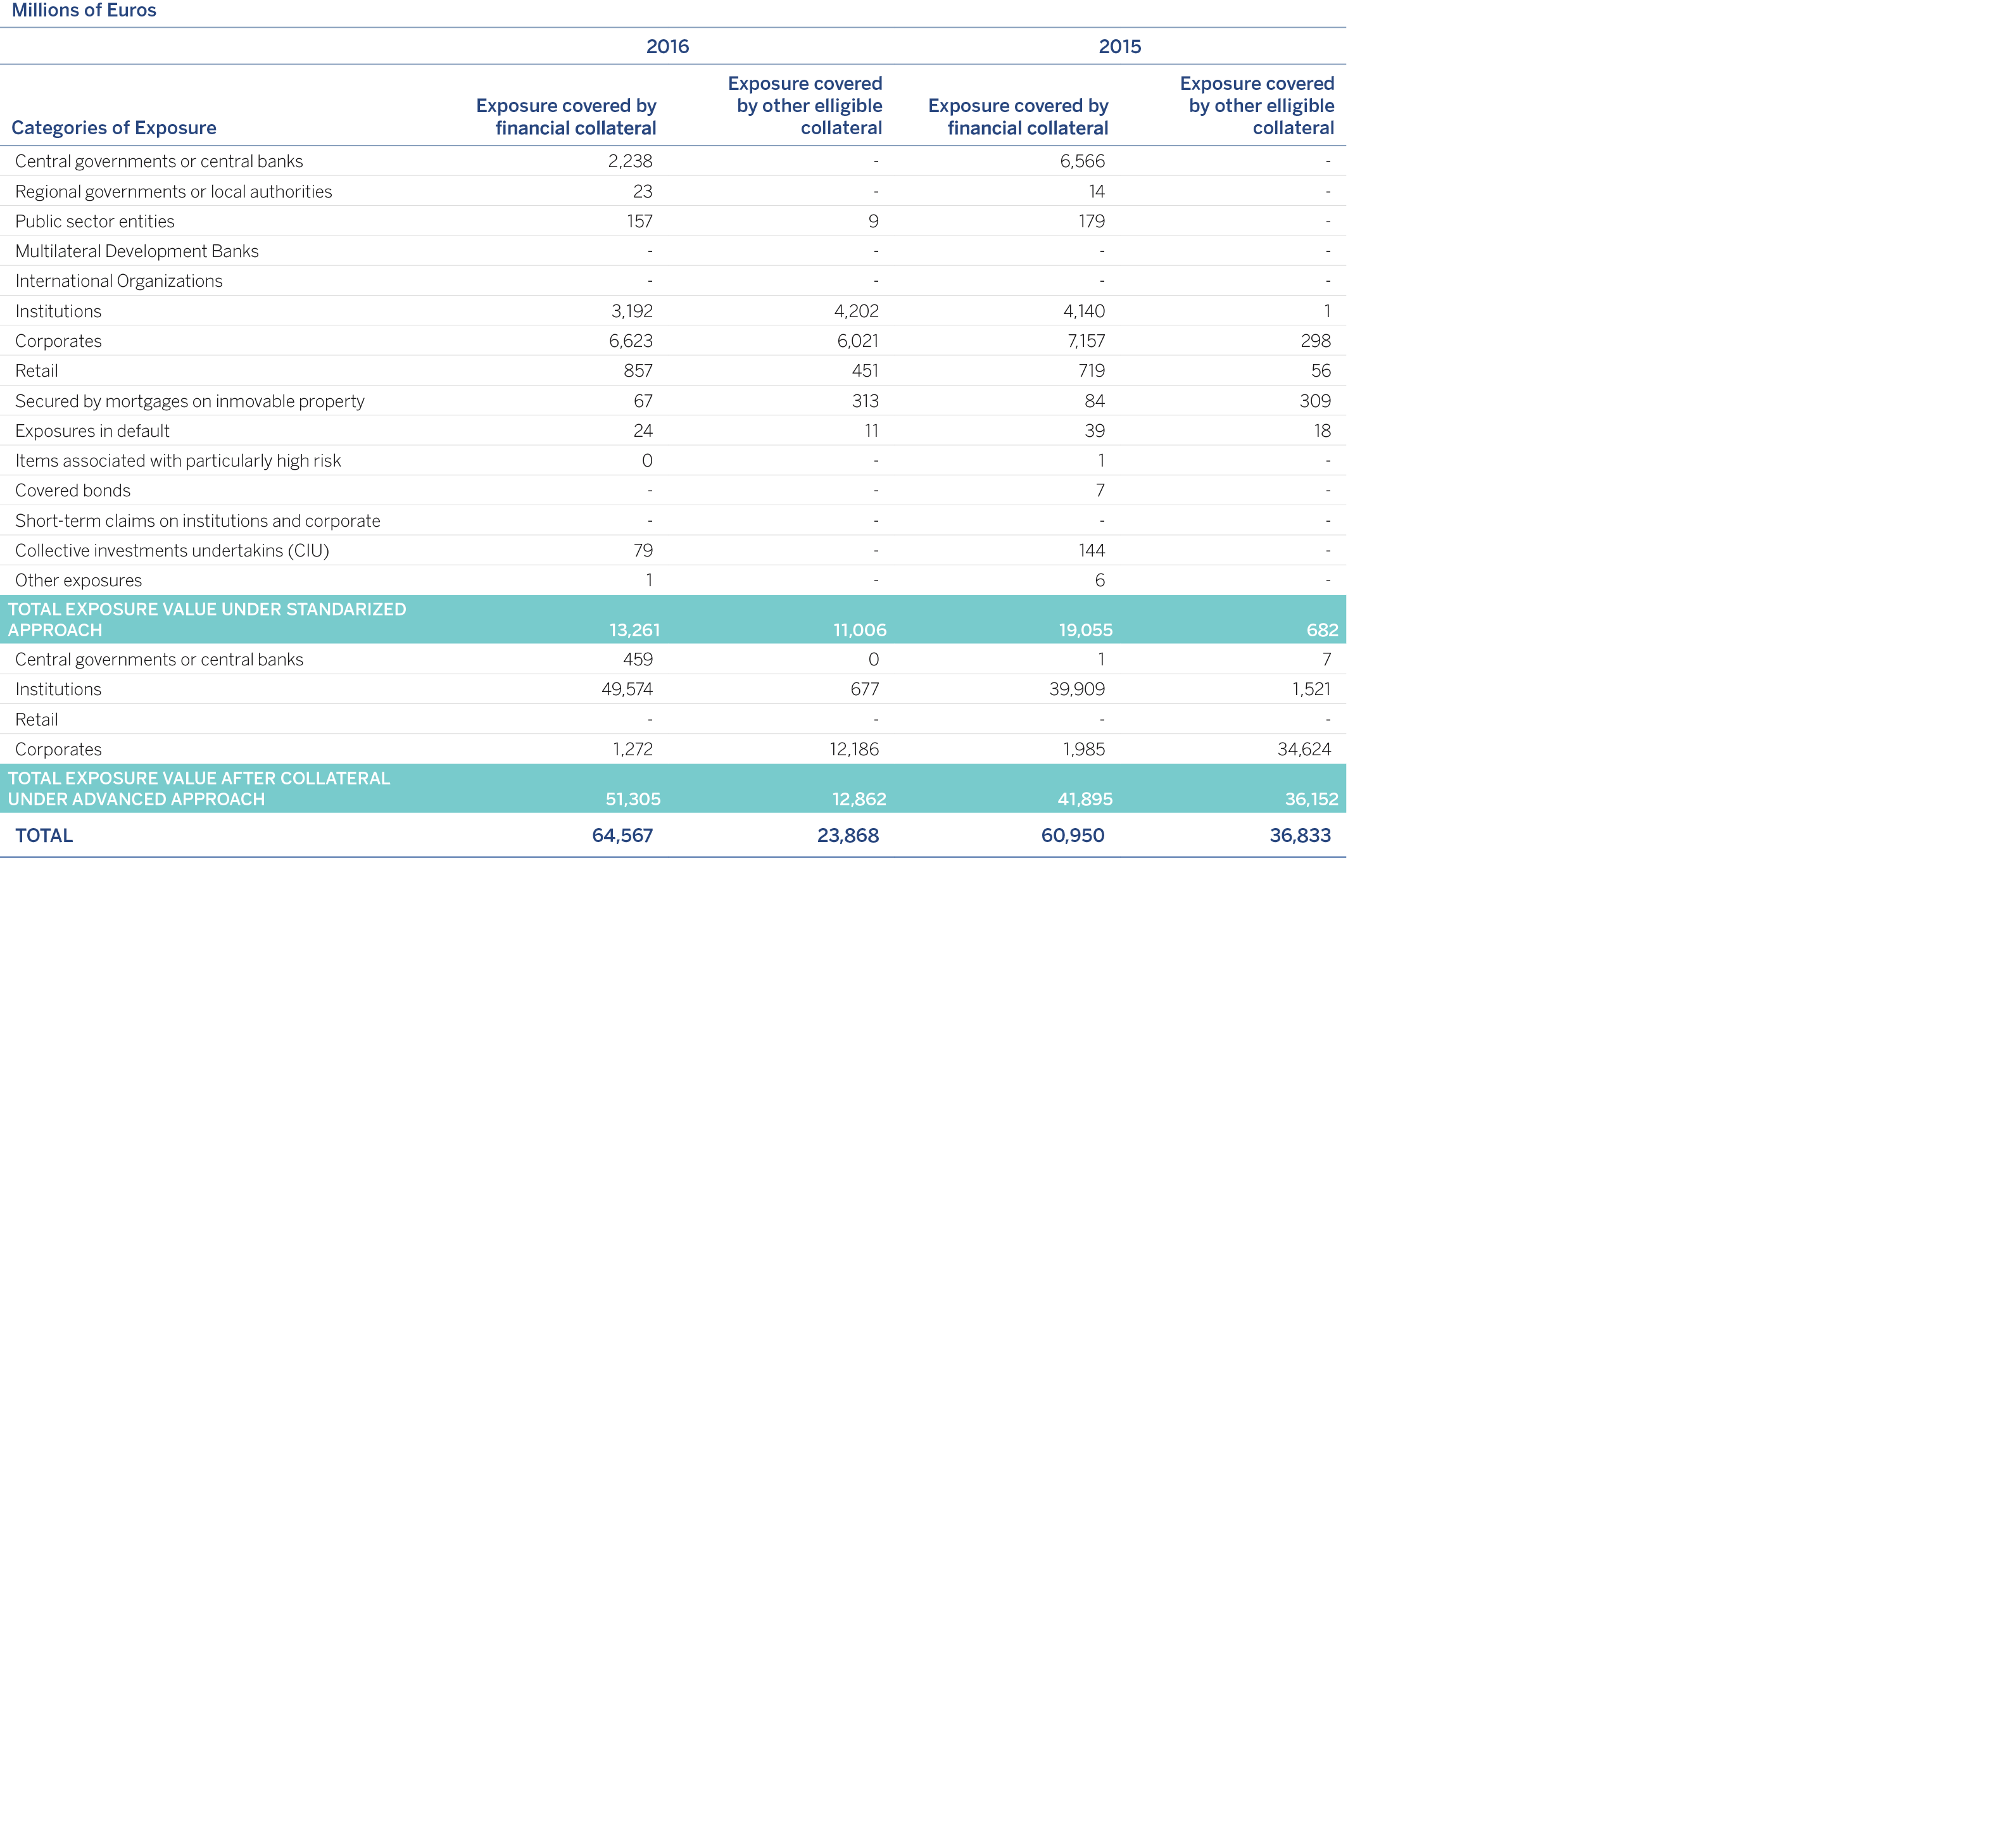
According to the solvency regulations, signature guarantees are personal guarantees, including those arising from credit insurance, that have been granted by the providers of coverage defined in articles 201 and 202 of the solvency regulations.
In the category of Retail exposure under the advanced measurement approach, guarantees impact on the PD and do not reduce the amount of the credit risk in EAD.
The total value of the exposure covered with personal guarantees is as follows:
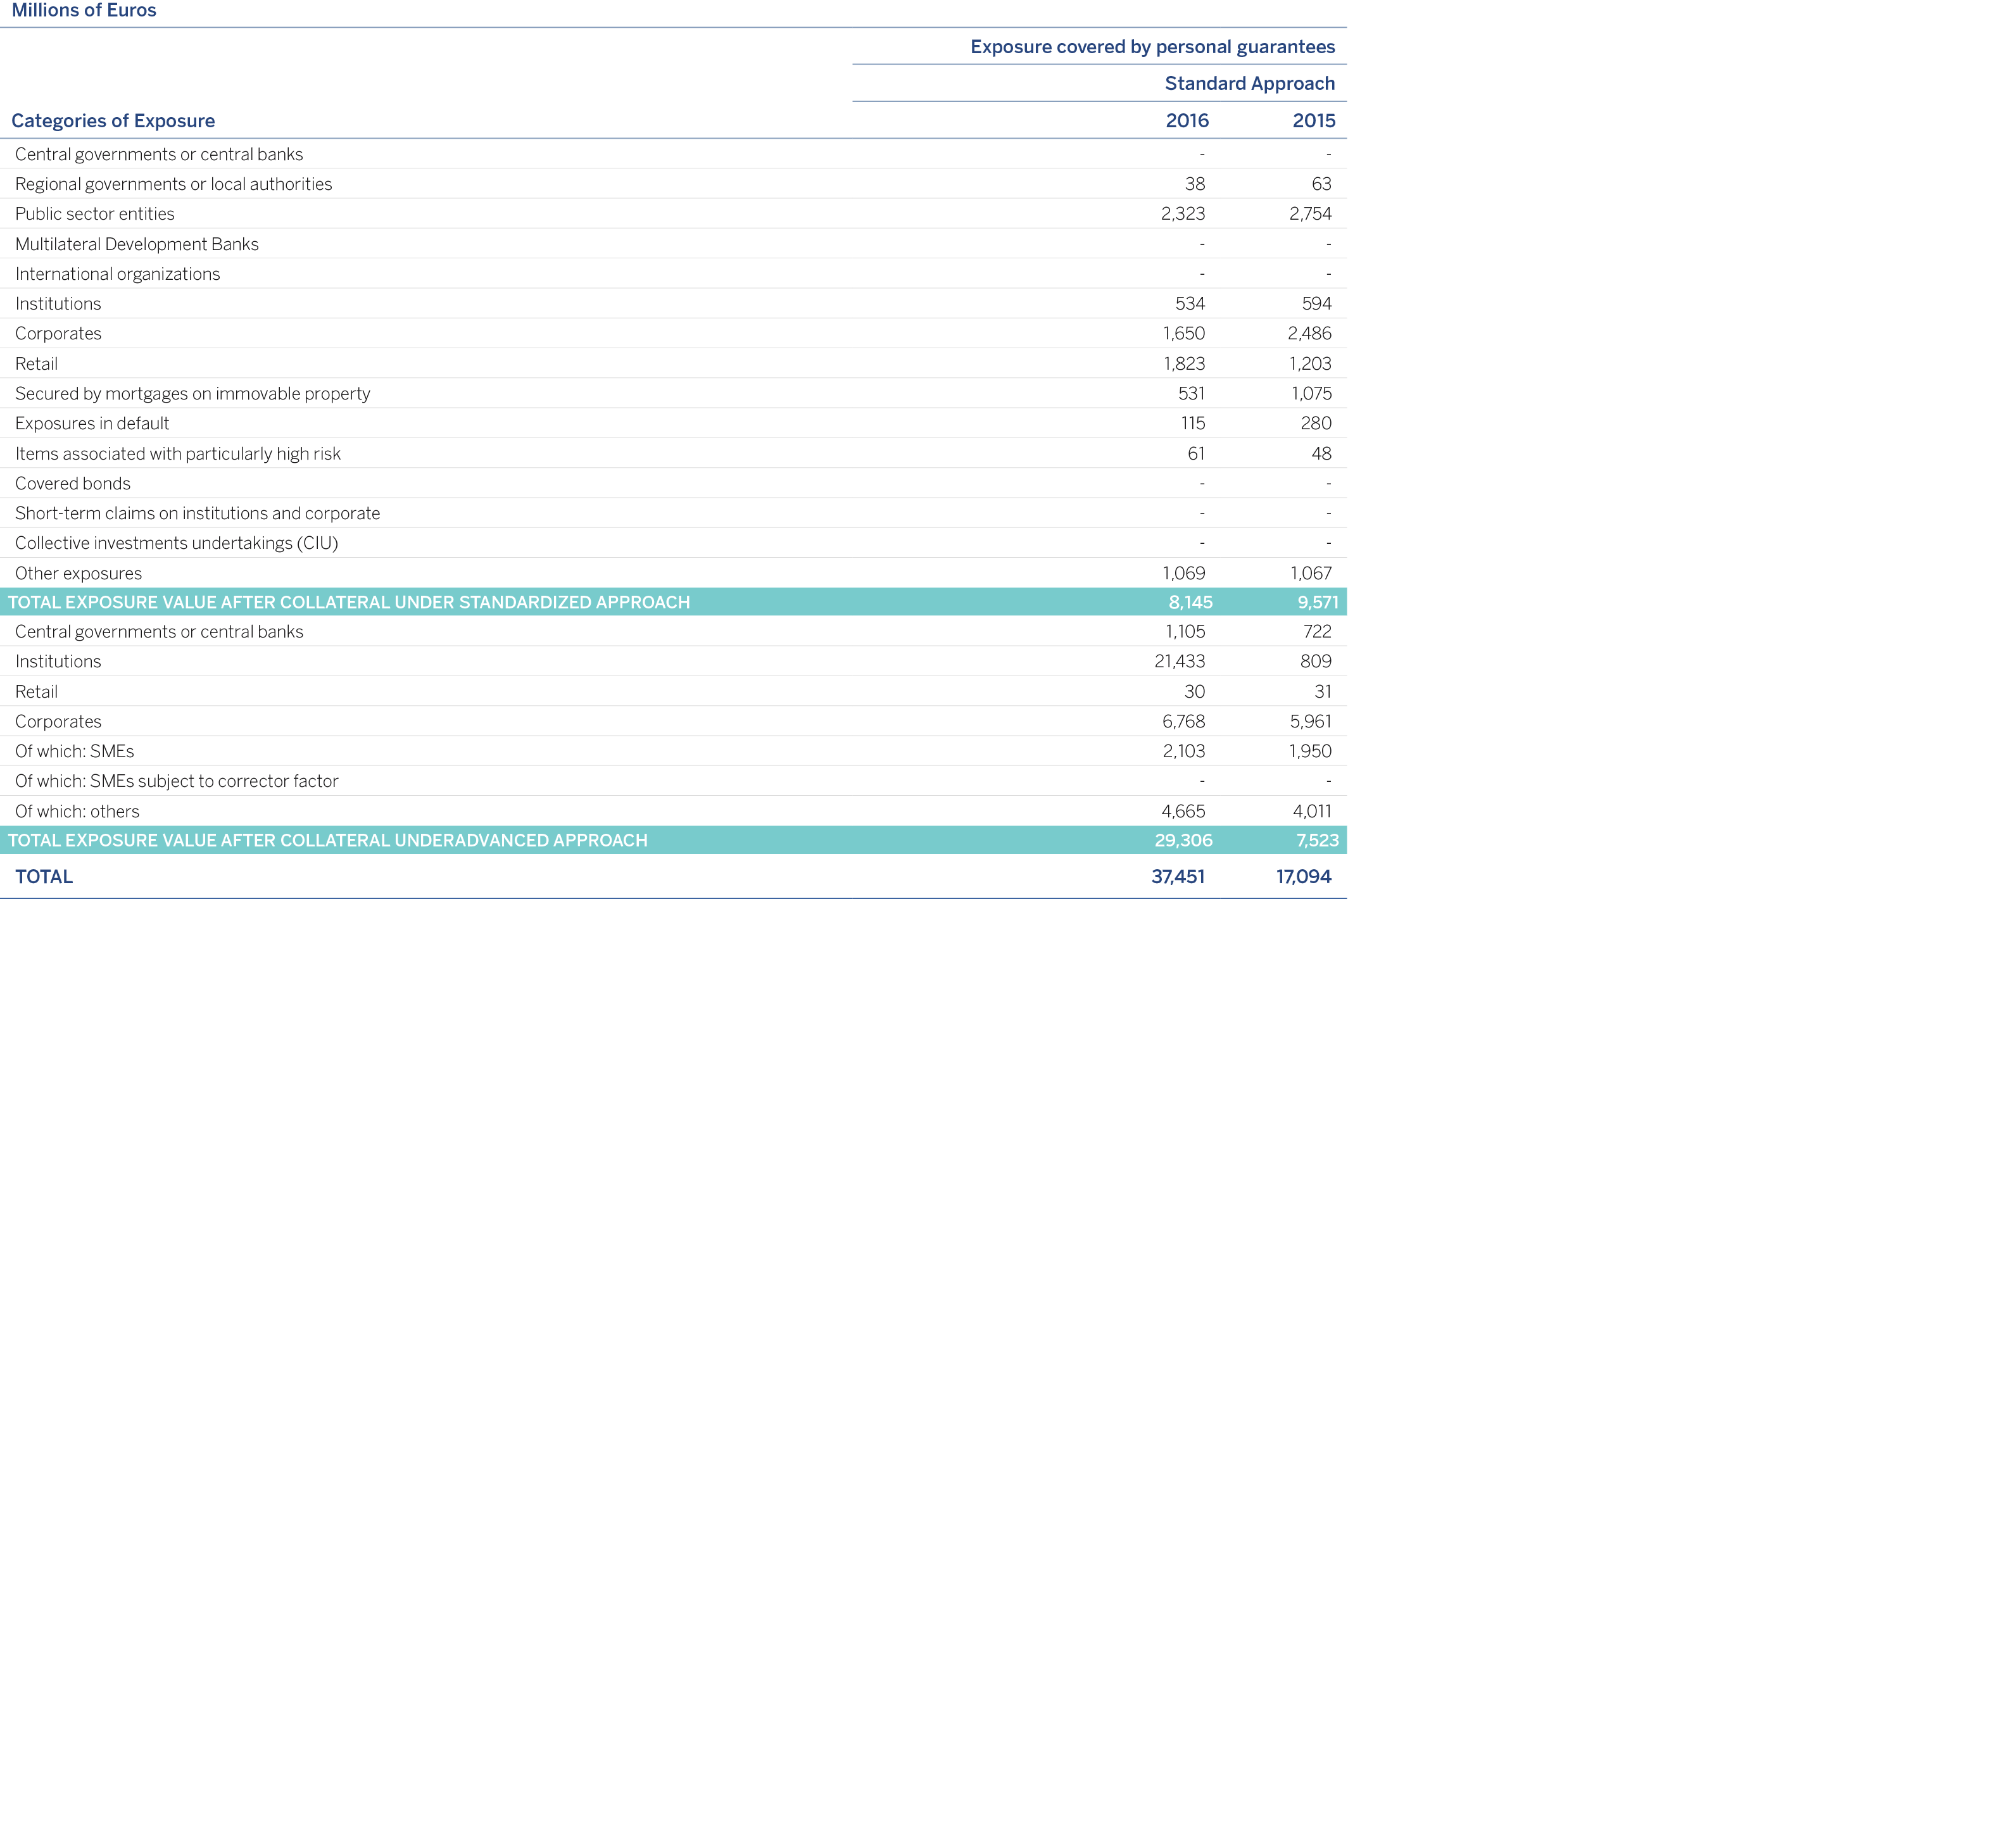
Below is an overview of the level of use of each of the credit risk mitigation techniques employed by the Group as of December 31, 2016:
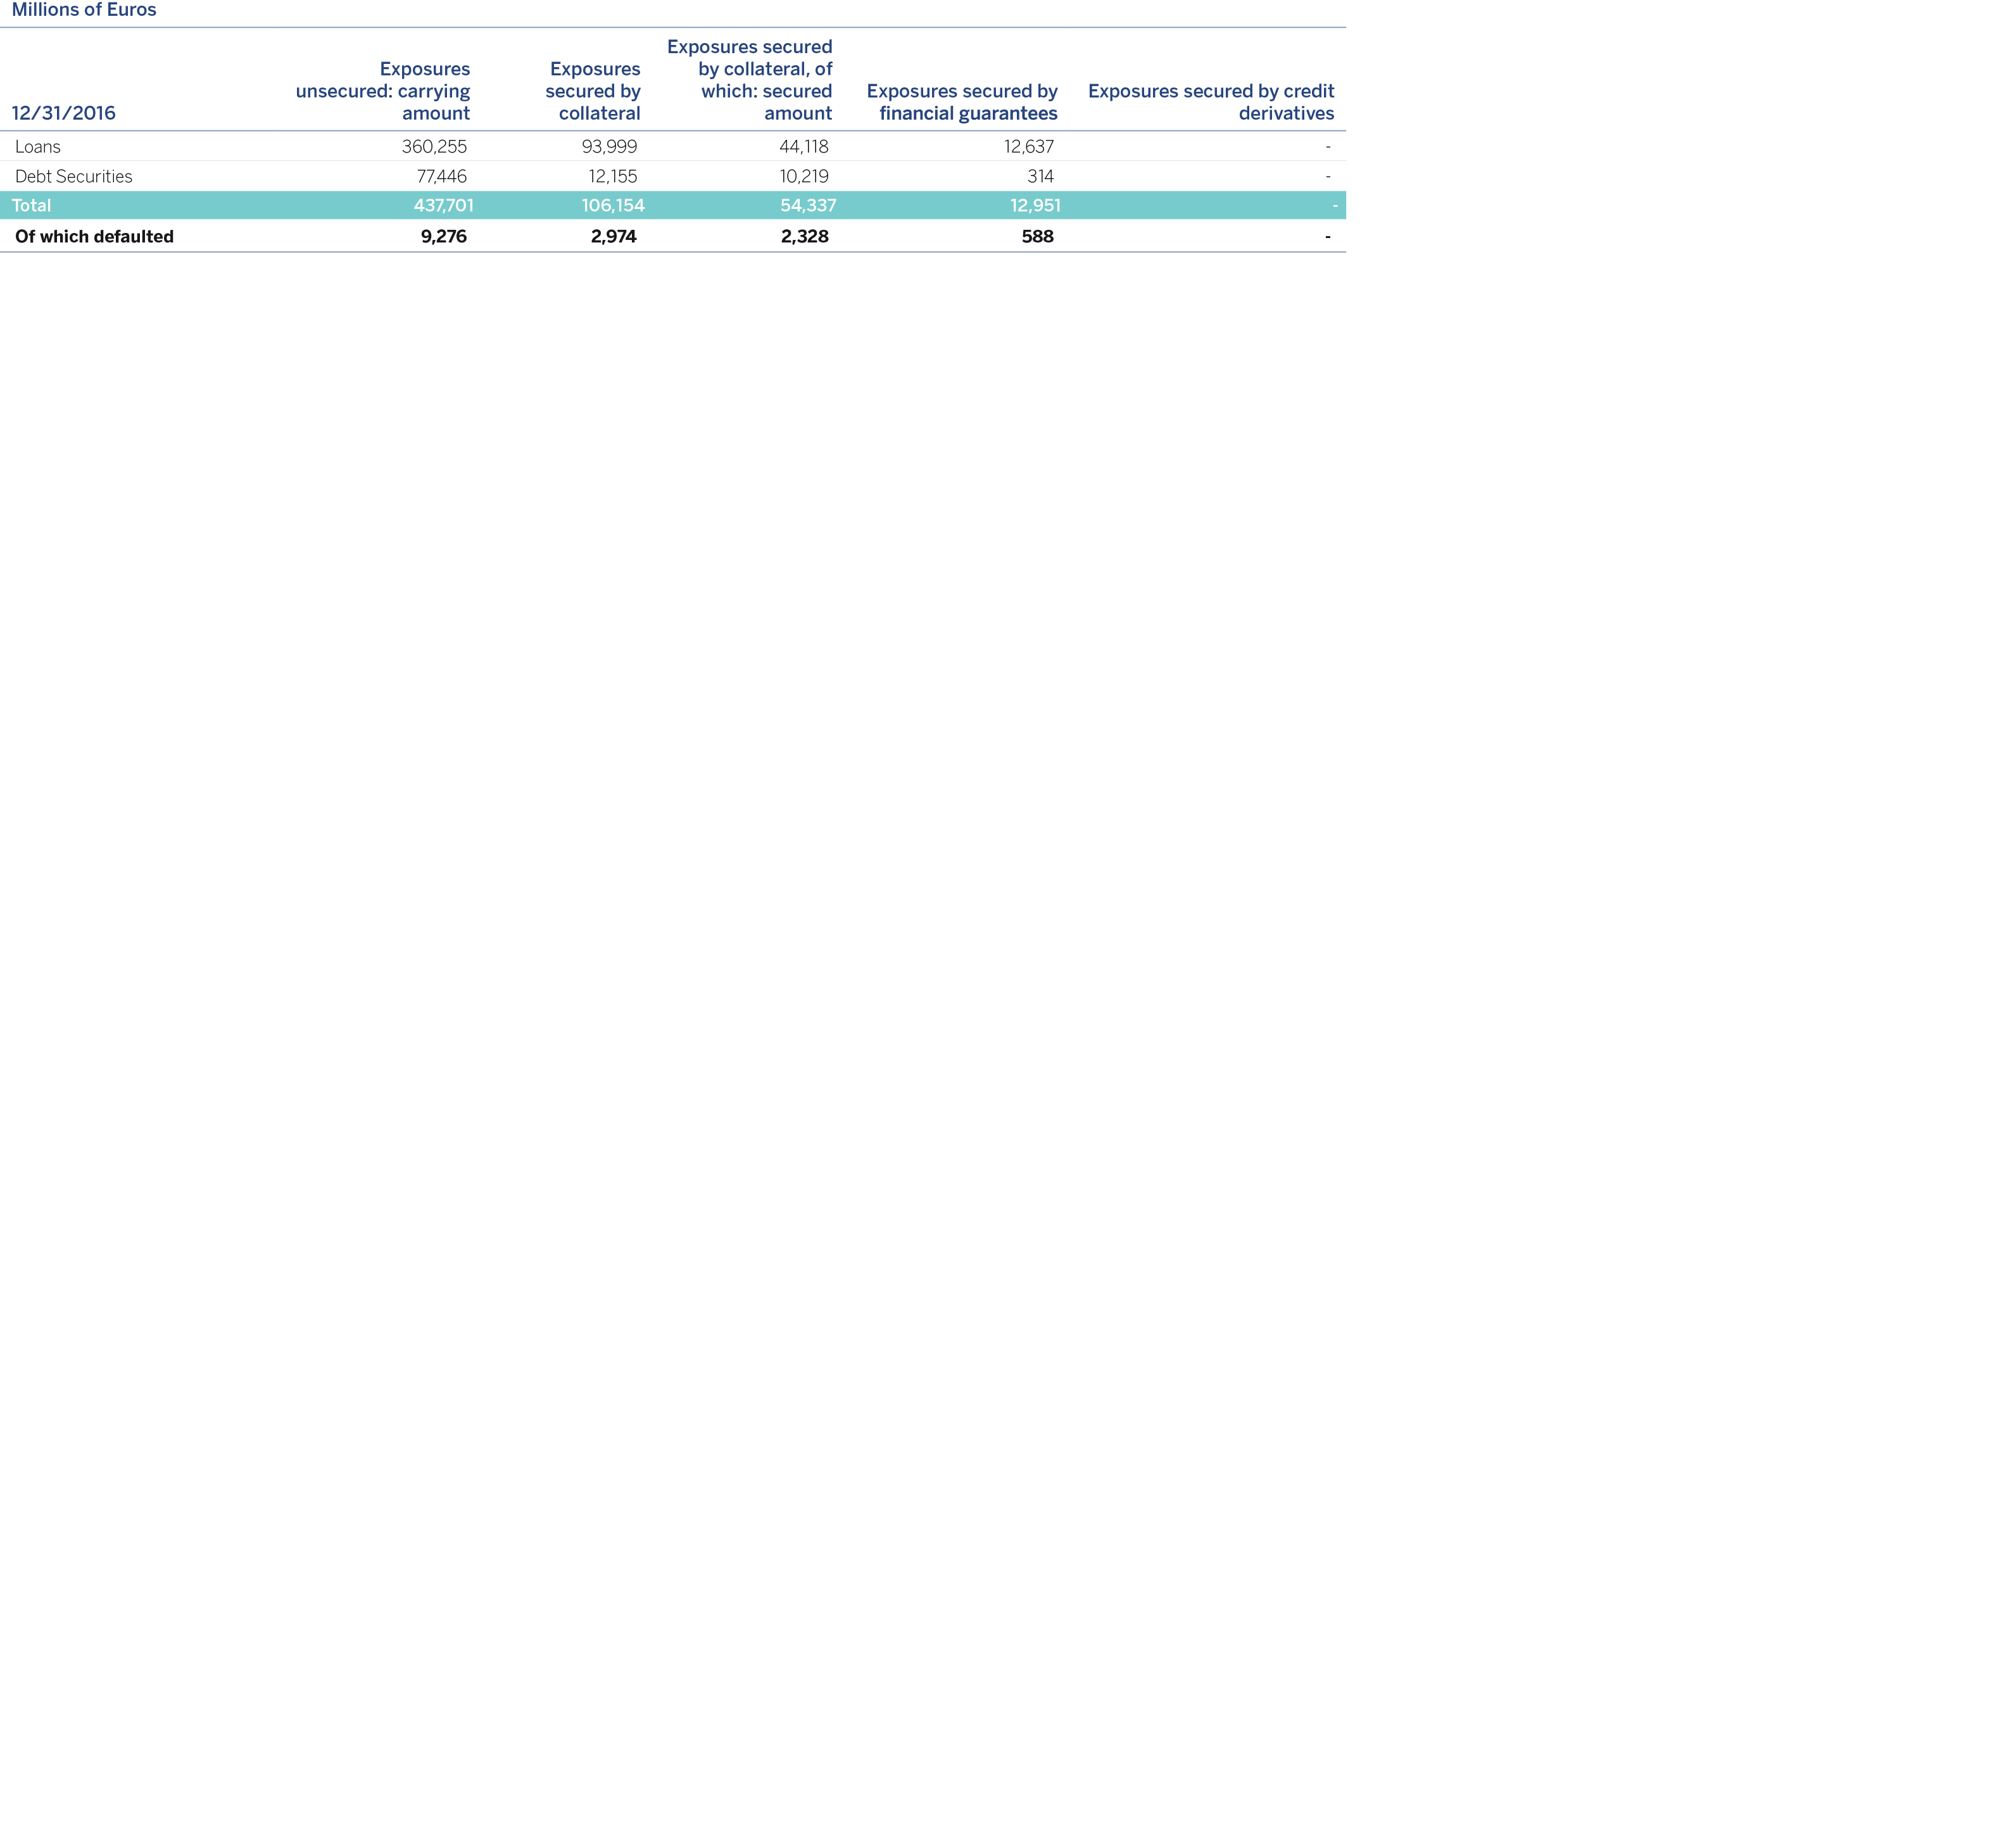
BBVA has established the measurement, monitoring and reporting criteria for the analysis of large credit exposures that could represent a risk of concentration, with the aim of guaranteeing their alignment with the risk appetite defined in the Group.
In particular, measurement and monitoring criteria are established for large exposures at the level of individual concentrations, concentrations of retail portfolios and wholesale sectors, and geographical concentrations.
A quarterly measurement and monitoring process has been established for reviewing the risks of concentration.
A summary of the weighted-average percentages by exposure category existing in the main geographical areas in which the Group operates is shown below for credit risk and counterparty exposure, for the purpose of obtaining an overview of the entity's risk profile in terms of RWAs.
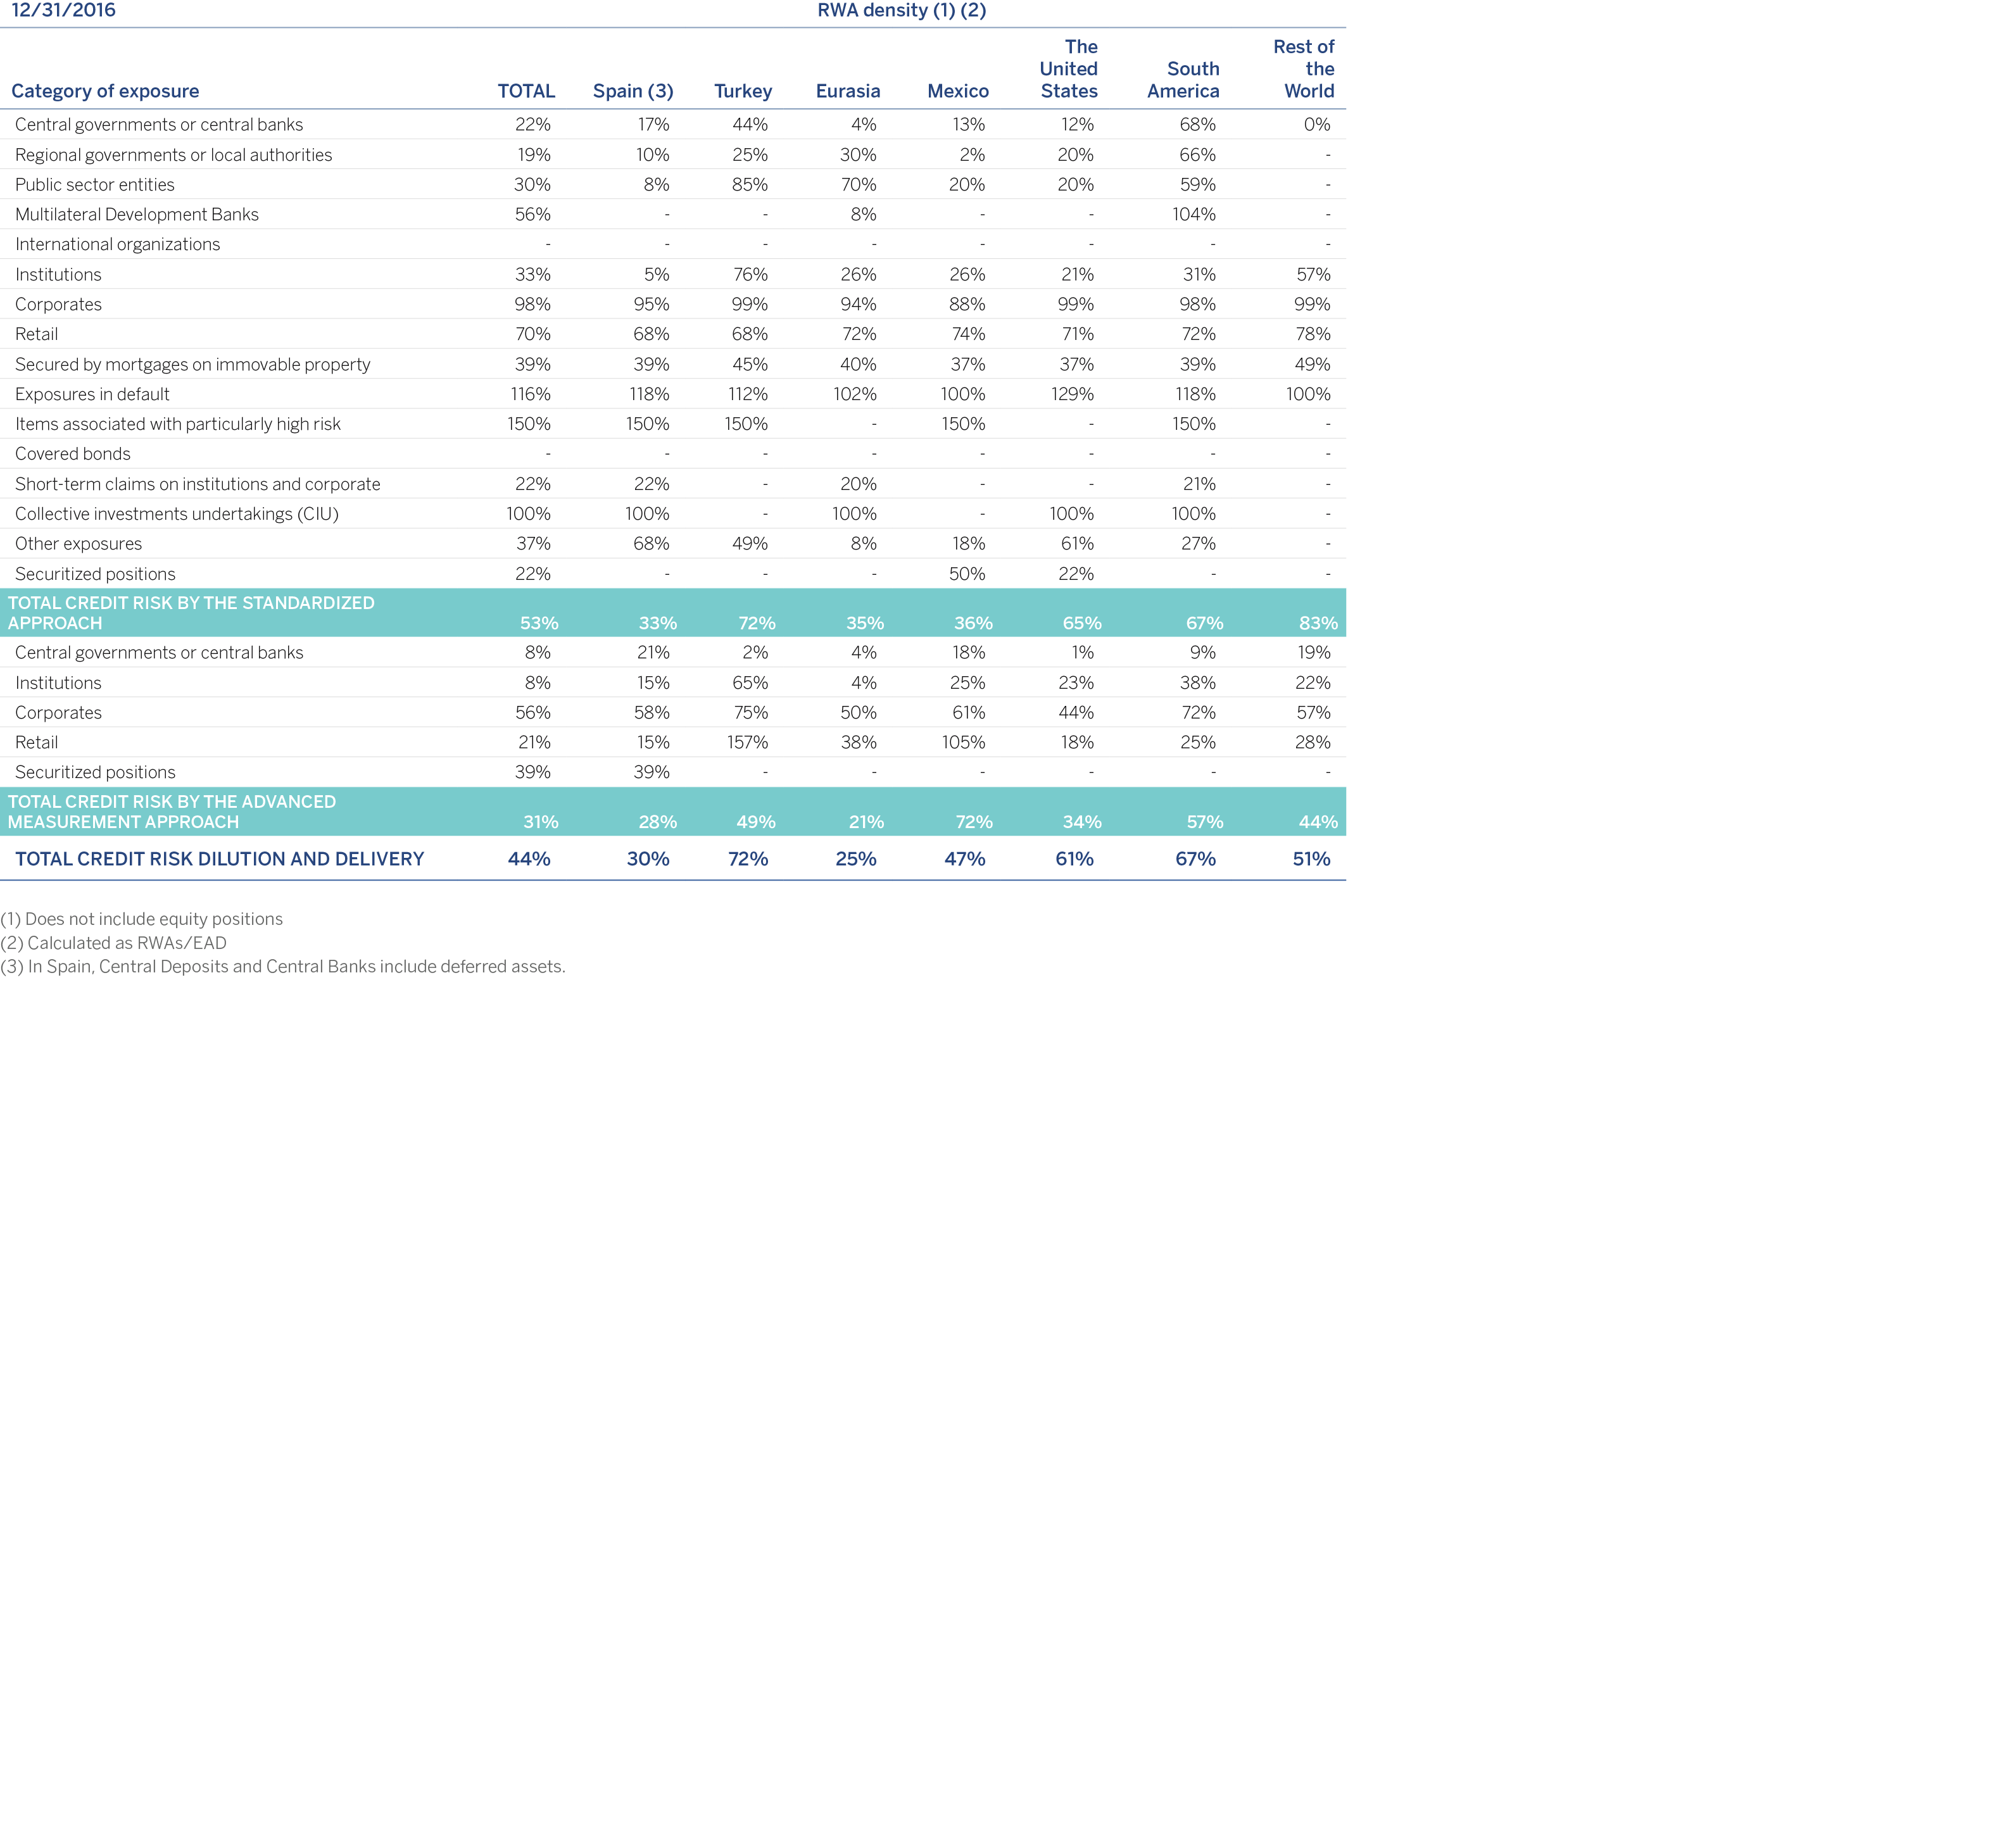
In most cases, maximum exposure to credit risk is reduced by collateral, credit enhancements and other actions which mitigate the Group’s exposure. BBVA Group applies a credit risk hedging and mitigation policy derived from its banking business model, which focuses on its relationship banking.
The existence of guarantees could be a necessary but not sufficient instrument for accepting risks, as the assumption of risks by the Group requires the verification of the debtor's capacity for repayment, or that the debtor can generate sufficient resources to allow the amortization of the risk incurred under the agreed terms.
The policy of accepting risks is therefore organized into three different levels in BBVA Group:
Analysis of the financial risk of the operation, based on the debtor’s capacity for repayment or generation of funds.
The constitution of guarantees that are adequate for the risk assumed, in any of the generally accepted forms: monetary, secured, personal or hedge guarantees; and finally
Assessment of the repayment risk (asset liquidity) of the guarantees received.
This is carried out through a prudent risk management policy which involves analyzing the financial risk in a transaction, based on the repayment or resource generation capacity of the credit receiver, the provision of guarantees -in any of the generally accepted ways (monetary, collateral or personal guarantees and hedging)- appropriate to the risk borne, and lastly on the valuation of the recovery risk (the asset’s liquidity) of the guarantees received.
The procedures for the management and valuation of collateral are set out in the Credit Risk Management Policies and Procedures (retail and wholesale), which establish the basic principles for credit risk management, including the management of collateral assigned in transactions with customers.
The methods used to value the collateral are in line with the best market practices and imply the use of appraisal of real-estate collateral, the market price in market securities, the trading price of shares in mutual funds, etc. All collateral assigned must be properly drawn up and entered in the corresponding register. They must also have the approval of the Group's legal units.
The following is a description of the main types of collateral for each financial instrument class:
Financial assets held for trading: The guarantees or credit enhancements obtained directly from the issuer or counterparty are implicit in the clauses of the instrument.
Derivatives and hedge accounting derivatives: In derivatives, credit risk is minimized through contractual netting agreements, where positive- and negative-value derivatives with the same counterparty are offset for their net balance. There may likewise be other kinds of guarantees, depending on counterparty solvency and the nature of the transaction.
Financial assets designated at fair value through profit or loss and available-for-sale financial assets: Guarantees or credit enhancements obtained directly from the issuer or counterparty are inherent in the structure of the instrument.
Loans and receivables:
Loans and advances to credit institutions: These usually only have the counterparty’s personal guarantee.
Loans and advances to customers: Most of these operations are backed by personal guarantees extended by the counterparty. There may also be collateral to secure loans and advances to customers (such as mortgages, cash guarantees, pledged securities and other collateral), or to obtain other credit enhancements (bonds, hedging, etc.).
Debt securities: Guarantees or credit enhancements obtained directly from the issuer or counterparty are inherent in the structure of the instrument.
Financial guarantees, other contingent risks and withdrawable by third parties: These have the counterparty’s personal guarantee.
Market risk originates in the possibility that there may be losses in the value of positions held due to movements in the market variables that affect the valuation of financial products and assets in trading activity.
The main risks generated may be classified into the following groups:
Interest-rate risk: They arise as a result of exposure to the movement in the different interest-rate curves on which there is trading. Although the typical products generating sensitivity to movements in interest rates are money market products (deposits, futures on interest rates, call money swaps, etc.) and the traditional interest-rate derivatives (swaps, interest-rate options such as caps, floors, swaptions, etc.), practically all the financial products have some exposure to movements in interest rates due to the effect of the financial discount in valuing them.
Equity Risk: Arises as a result of movements in the price of shares. This risk is generated in the spot share price positions, as well as any derivative product whose underlying is a share or equity index. Dividend risk is a sub-risk of equity risk, as an input of any equity option. Its variability may affect the valuation of positions and thus it is a factor that generates risk on the books.
Currency risk: It occurs due to a movement in the exchange rates of the currencies in which the position is held. As in the case of equity risk, this risk is generated in the spot foreign-currency positions, as well as any derivative product whose underlying is an exchange rate.
In addition, the quanto effect (transactions where the underlying and the nominal of the transaction are denominated in different currencies) means that in certain transactions where the underlying is not a currency an exchange-rate risk is generated that has to be measured and monitored.
Credit-spread risk: Credit spread is a market indicator of the credit quality of an issuer. The spread risk takes place due to variations in the levels of spread in corporate or government issuers and affects both bond and credit derivative positions.
Volatility risk: This occurs as a result of variations in the levels of implied volatility in the price of different market instruments in which derivatives are traded. This risk, unlike the others, is exclusively a component of derivative transactions and is defined as a risk of first-order convexity that is generated in all the possible underlying transactions where there are products with an optionality that require a volatility input for their valuation.
The metrics developed for the control and monitoring of market risk in BBVA Group are aligned with the best market practices and implemented consistently in all the local market risk units.
The measurement procedures are established in terms of the possible impact of negative market conditions, both under ordinary circumstances and in situations of tension, on the trading book of the Group's Global Markets units.
The standard metric for measuring market risk is Value at Risk (VaR), which indicates the maximum losses that may be incurred in the portfolios at a given confidence level (99%) and time horizon (one day).
Chapter 3.3.4 explains in more detail the risk measurement models used in BBVA Group, focused on internal models approved by the supervisor for BBVA S.A. and BBVA Bancomer for the purpose of calculating the capital for positions in the trading portfolio. Both entities contribute around 66% of the market risk of the Group's trading portfolio.
For the rest of the geographical areas (South America and Compass), the calculation of capital for the risk positions in the trading portfolio is carried out using the standard model.
The analysis of the entity's RWA structure shows that 4% corresponds to Market Risk (including the currency risk).
According to the solvency regulations, the trading book shall be made up of all the positions in financial instruments and commodities that the credit institution holds for the purpose of trading or that act as hedging for other elements in this book.
With respect to this book, the rule also refers to the need to establish clearly defined policies and procedures.
For this purpose, regulatory trading book activities defined by BBVA Group include the positions managed by the Group’s Trading units, for which market risk limits are set and then monitored daily. Moreover, they comply with the other requirements defined in the solvency regulations.
The trading book as an accounting concept is not confined to any business area, but rather follows the true reflection criteria laid down in the accounting regulations. Included in this category are all the financial assets and liabilities originated, acquired or issued with the aim of short-term redemption or repurchase, whether they are part of a jointly-managed portfolio of instruments for which there is evidence of recent action to obtain short-term gains, or derivative instruments that do not comply with the definition of a collateral contract and have not been designated as hedge accounting instruments. Hence, for example, all derivatives are booked as accounting trading book unless they are hedging derivatives, regardless of whether or not they are part of the Trading units’ exposure or they come from other business areas.
The positions subject to the application of the standardized approach in the calculation of the bank capital requirements for market risk (excluding the currency risk) have a limited weight on the total risk weighted assets in the Group's trading books (around 25%).
Below are the amounts in terms of RWAs and capital requirements by market risk calculated under the standardized approach as of December 31, 2016 and December 31, 2015:

For the purposes of calculating capital as approved by the supervisor, the scope of application of the internal market risk model extends to BBVA S.A. and BBVA Bancomer Trading Floors.
As explained in Note 7.4 of the Group's Consolidated Financial Statements, most of the items on the Group's consolidated balance sheet subject to market risk are positions whose principal metric used to measure their market risk is VaR.
This Note specifies the accounting headings of the consolidated balance sheets as of December 31, 2016 and 2015 in the geographic areas with an Internal Model where there is market risk in the trading activity subject to this measurement It should be noted that the information shown is for information purposes only and does not reflect risk management in trading activity, where there is no classification between assets and liabilities.
The measurement procedures are established in terms of the possible negative impact on market conditions, both under ordinary circumstances and in situations of tension, on the trading book of the Group's Global Markets units.
The standard metric for measuring market risk is Value at Risk (VaR), which indicates the maximum losses that may be incurred in the portfolios at a given confidence level (99%) and time horizon (one day).
This statistic is widely used in the market and has the advantage of summarizing in a single metric the risks inherent in trading activity, taking into account the relations between all of them, and providing the forecast of the losses that the trading book might incur as a result of price variations in equity markets, interest rates, exchange rates and commodities. In addition, for certain positions, other risks also need to be considered, such as credit spread risk, basis risk, volatility and correlation risk.
With respect to the risk measurement models used in BBVA Group, the supervisor has authorized the use of the internal model for the calculation of capital for the risk positions in the trading book of BBVA, S.A. and BBVA Bancomer which, together, contribute more than 66% of the market risk of the Group's trading book.
BBVA uses a single model to calculate the regulatory requirements by general and specific risk, taking into account the correlation between the assets and thus recognizing the diversifying effect of the portfolios. The model used estimates the VaR in accordance with the "historical simulation" methodology, which involves estimating the losses and gains that would have been incurred in the current portfolio if the changing market conditions that occurred over a given period of time were repeated. Based on this information, it infers the maximum foreseeable loss in the current portfolio with a given level of confidence.
Absolute and relative returns are used in simulating the potential variation of the risk factors, depending on the type of risk factor. Relative returns are used in the case of equity and foreign currency; while absolute returns are used in the case of spreads and interest rates.
The decision on the type of return to apply is made according to the risk factor metric subject to variation. The relative return is used in the case of price risk factors, while for interest-rate risk factors it is absolute returns.
The model has the advantage of accurately reflecting the historical distribution of the market variables and of not requiring any specific distribution assumption. The historical period used in this model is two years.
VaR figures are estimated following two methodologies:
VaR without smoothing, which awards equal weight to the daily information for the previous two years. This is currently the official methodology for measuring market risks vis-à-vis limits compliance.
VaR with smoothing, which weighs more recent market information more heavily. This model adjusts the historical information of each market variable to reflect the differences between historical volatility and current volatility. This metric is supplementary to the one above.
VaR with smoothing adapts itself more swiftly to the changes in financial market conditions, whereas VaR without smoothing is, in general, a more stable metric that will tend to exceed VaR with smoothing when the markets show less volatile trends, but be lower when they present upturns in uncertainty.
Furthermore, and following the guidelines established by Spanish and European regulators, BBVA incorporates additional VaR metrics to fulfill the regulatory requirements issued by the supervisor for the purpose of calculating capital for the trading book. Specifically, the new measures incorporated in the Group since December 2011 (which follow the guidelines set out by Basel 2.5) are as follows:
VaR: In regulatory terms, the charge for Stressed VaR is added to the charge for VaR and the sum of both (VaR and Stressed VaR) is calculated. This quantifies the losses associated with movements in the risk factors inherent in market operations (interest rate, FX, RV, credit, etc.).
Both VaR and Stressed VaR are rescaled by a regulatory multiplier set at three and by the square root of ten to calculate the capital charge.
Specific Risk: Incremental Risk Capital (IRC). Quantification of non-performing risk and downgrade risk in the rating of some positions held in the portfolio, such as bonds and credit derivatives. The specific risk capital for IRC is a charge used exclusively for geographical areas with an approved internal model (BBVA S.A. and Bancomer).
The capital charge is determined based on the associated losses (at 99.9% over a time horizon of 1 year under the assumption of constant risk) resulting from the rating migration and/or Exposures in default of the asset's issuer. Also included is the price risk in sovereign positions for the indicated items.
The calculation methodology is based on the Monte Carlo simulation of the impact of defaults and rating transitions on the portfolio of positions subject to incremental risk capital. The model defining the transition and default process of a counterparty is based on the changes in a counterparty's credit quality. Under a Merton onefactor model, which underlies the Basel or Creditmetrics model, this credit quality will correspond to the value of the issuer's assets, depending on a systemic factor that is common to all the issuers and an idiosyncratic factor specific to each.
All that is needed to simulate the rating transition and default process of the issuers is to simulate the systemic factor and idiosyncratic component. Once the underlying variable is available, the final rating can be obtained. The simulation of the individual credit quality of the issuers allows the losses by systemic risk and idiosyncratic risk to be obtained.
Transition matrices
The transition matrix used for calculation is estimated based on the external information of the rating transitions provided by the rating agencies. Specifically, the information provided by the Standard & Poors agency is used.
The appropriateness of using information on external transitions is justified by:
The internal ratings for the Sovereign, Emerging Sovereign Country (ESC), Financial Institution (FI) and Corporate segments (which constitute the core positions subject to incremental risk capital) are aligned with the external ratings. By way of example, the internal rating system for financial institutions is based on an algorithm that uses external ratings.
The rating agencies provide sufficient historical information to cover a complete economic cycle (rating transition information is available dating back to year 1981) and obtain a long-term transition matrix in the same way as the calculation of the regulatory capital for credit risk in the banking book long-term probabilities of default are required.
This historical depth is not available for the internal rating systems.
Although external data are used for determining the transitions between ratings, to establish the default, probabilities are used assigned by the BBVA master scale, which ensures consistency with the probabilities used for the calculations of capital in the Banking Book.
The transition matrix is recalibrated every year, based on information on transitions provided by Standard & Poor's. A procedure has been defined to readjust the transitions in accordance with the probability of default assigned by the master scale.
Liquidity horizons
The calculation of incremental risk capital used by BBVA explicitly includes the use of positions with a hypothesis of a constant level of risk and liquidity horizons of less than one year.
The establishment of liquidity horizons follows the guidelines/criteria established by Basel in its guidelines for computing capital for incremental risk.
First, a criterion of management capacity for positions has been used for positions through liquid instruments that can hedge their inherent risks. The main instrument for hedging the price risk for rating transitions and defaults is the Credit Default Swap (CDS). The existence of this hedging instrument serves as a justification for considering a short liquidity horizon. However, in addition to considering the existence of a liquid CDS, a distinction has to be made according to the issuer's rating (this factor is also mentioned in the aforementioned guidelines). Specifically, between investment grade issuers or those with a rating equal to or above BBB-, and issuers below this limit.
According to these criteria, the issuers are mapped to standard liquidity horizons of 3, 6 or 12 months.
Correlation
The calculation methodology is based on a single-factor model, in which there is one factor common to all the counterparties. The coefficient of the model is determined by the correlation curves established by Basel for companies, financial institutions and sovereigns based on the probability of default.
The use of the Basel correlation curve ensures consistency with the calculation of regulatory capital under the IRB approach for the positions on the banking book.
Specific Risk: Securitizations and Correlation Portfolios. Capital charge for the securitizations and the correlation portfolio for potential losses associated with the rating level of a given credit structure (rating). Both are calculated using the standardized approach. The perimeter of the correlation portfolios is referred to First-to-default (FTD) type market operations and/or market CDO tranches, and only for positions with an active market and hedging capacity.
Validity tests are performed periodically on the risk measurement models used by the Group. They estimate the maximum loss that could have been incurred in the positions assessed with a certain level of probability (backtesting), as well as measurements of the impact of extreme market events on risk positions (stress testing).
Backtesting is performed at the trading desk level as an additional control measure in order to carry out a more specific monitoring of the validity of the measurement models.
The current structure for managing the market risk includes monitoring market risk limits, which consists of a system of limits based on Value at Risk (VaR), economic capital (based on VaR measurements) and VaR sub-limits, as well as stop-loss limits for each of the Group's business units. The global limits are proposed by the market risk unit and approved by the Executive Committee on an annual basis, once they have been submitted to the GRMC and the Risk Committee. This limits structure is developed by identifying specific risks by type, trading activity and trading desk. Moreover, the market risk unit maintains consistency between the limits. The control structure in place is supplemented by limits on loss and a system of alert signals to anticipate the effects of adverse situations in terms of risk and/or result.
The review of the quality of the inputs used by the evaluation processes is based on checking the data against other sources of information accepted as standards. These checks detect errors in the historical series such as repetitions, data outside the range, missing data, etc. As well as these periodic checks of the historical data loaded, the daily data that feed these series are subject to a data quality process to guarantee their integrity.
The choice of proxies is based on the correlation detected between the performance of the factor to be entered and the proxy factor. A Simple Linear Regression model is used, selecting the proxy that best represents the determination coefficient (R2) within the whole period for which the performance of both series is available. Next, the performance of the factor on the necessary dates is reconstructed, using the beta parameter estimated in the simple linear regression.
The fair value is the price that would be received for selling an asset or paid for transferring a liability in an orderly transaction between market participants. It is therefore a marketbased measurement, and not specific to each entity.
The fair value is reached without making any deduction in transaction costs that might be incurred due to sale or disposal by other means.
The process of determining fair value established in the Group ensures that assets and liabilities are valued correctly. At level of geographical areas, BBVA has established a structure of New Product Committees responsible for validating and approving new products or classes of assets and liabilities before their contracting. The committee members are the local areas, independent of the business, who are responsible for their valuation (see Note 7 of the Group's Annual Consolidated Financial Statements).
These areas are responsible for ensuring as a prior step to approval that the technical and human capacities are in place, and that sufficient sources of information are available to value the assets and liabilities, in accordance with the criteria established by the Global Valuation Area and using models validated and approved by the Risk Analytics Area, which answers to Global Risk Management.
In addition, for assets and liabilities in which significant elements of uncertainty are detected in the inputs or parameters of the models used, which may affect their valuation, criteria are established to measure this uncertainty and limits are set on activity based on them. Finally, valuations obtained in this way are, as far as possible, checked against other sources, such as the valuations obtained by the business teams or other market participants.
In the initial entry, the best evidence of fair value is the listing price on an active market. When these prices are not available, recent transactions on the same instrument will be consulted or the valuation will be made using mathematical measurement models that are sufficiently tried and trusted by the international financial community. In subsequent valuations, fair value will be obtained by one of the following methods:
Level 1: Measurement using observable quoted prices for the financial instrument in question, referring to market assets (as defined by the Group's internal policies), secured from independent sources.
Level 2: Measurement that applies techniques whose significant variables are observable market data.
Level 3: Measurement that applies techniques that use significant variables not obtained from market observable data. Model selection and validation was undertaken by control areas outside the market units.
Not all the financial assets and liabilities are accounted at fair value; when it is not possible to reliably estimate a capital instrument’s fair value, it will be valued at its cost.
(See Note 8 of the Group's Consolidated Financial Statements for more information)
In 2016, the average VaR was €29 million, higher than those in 2015, with a maximum level for the year on January 28 of €38 million.
The following values (maximum, minimum, average and at year end within the statement period) are given based on the different model types used for computing the capital requirement:
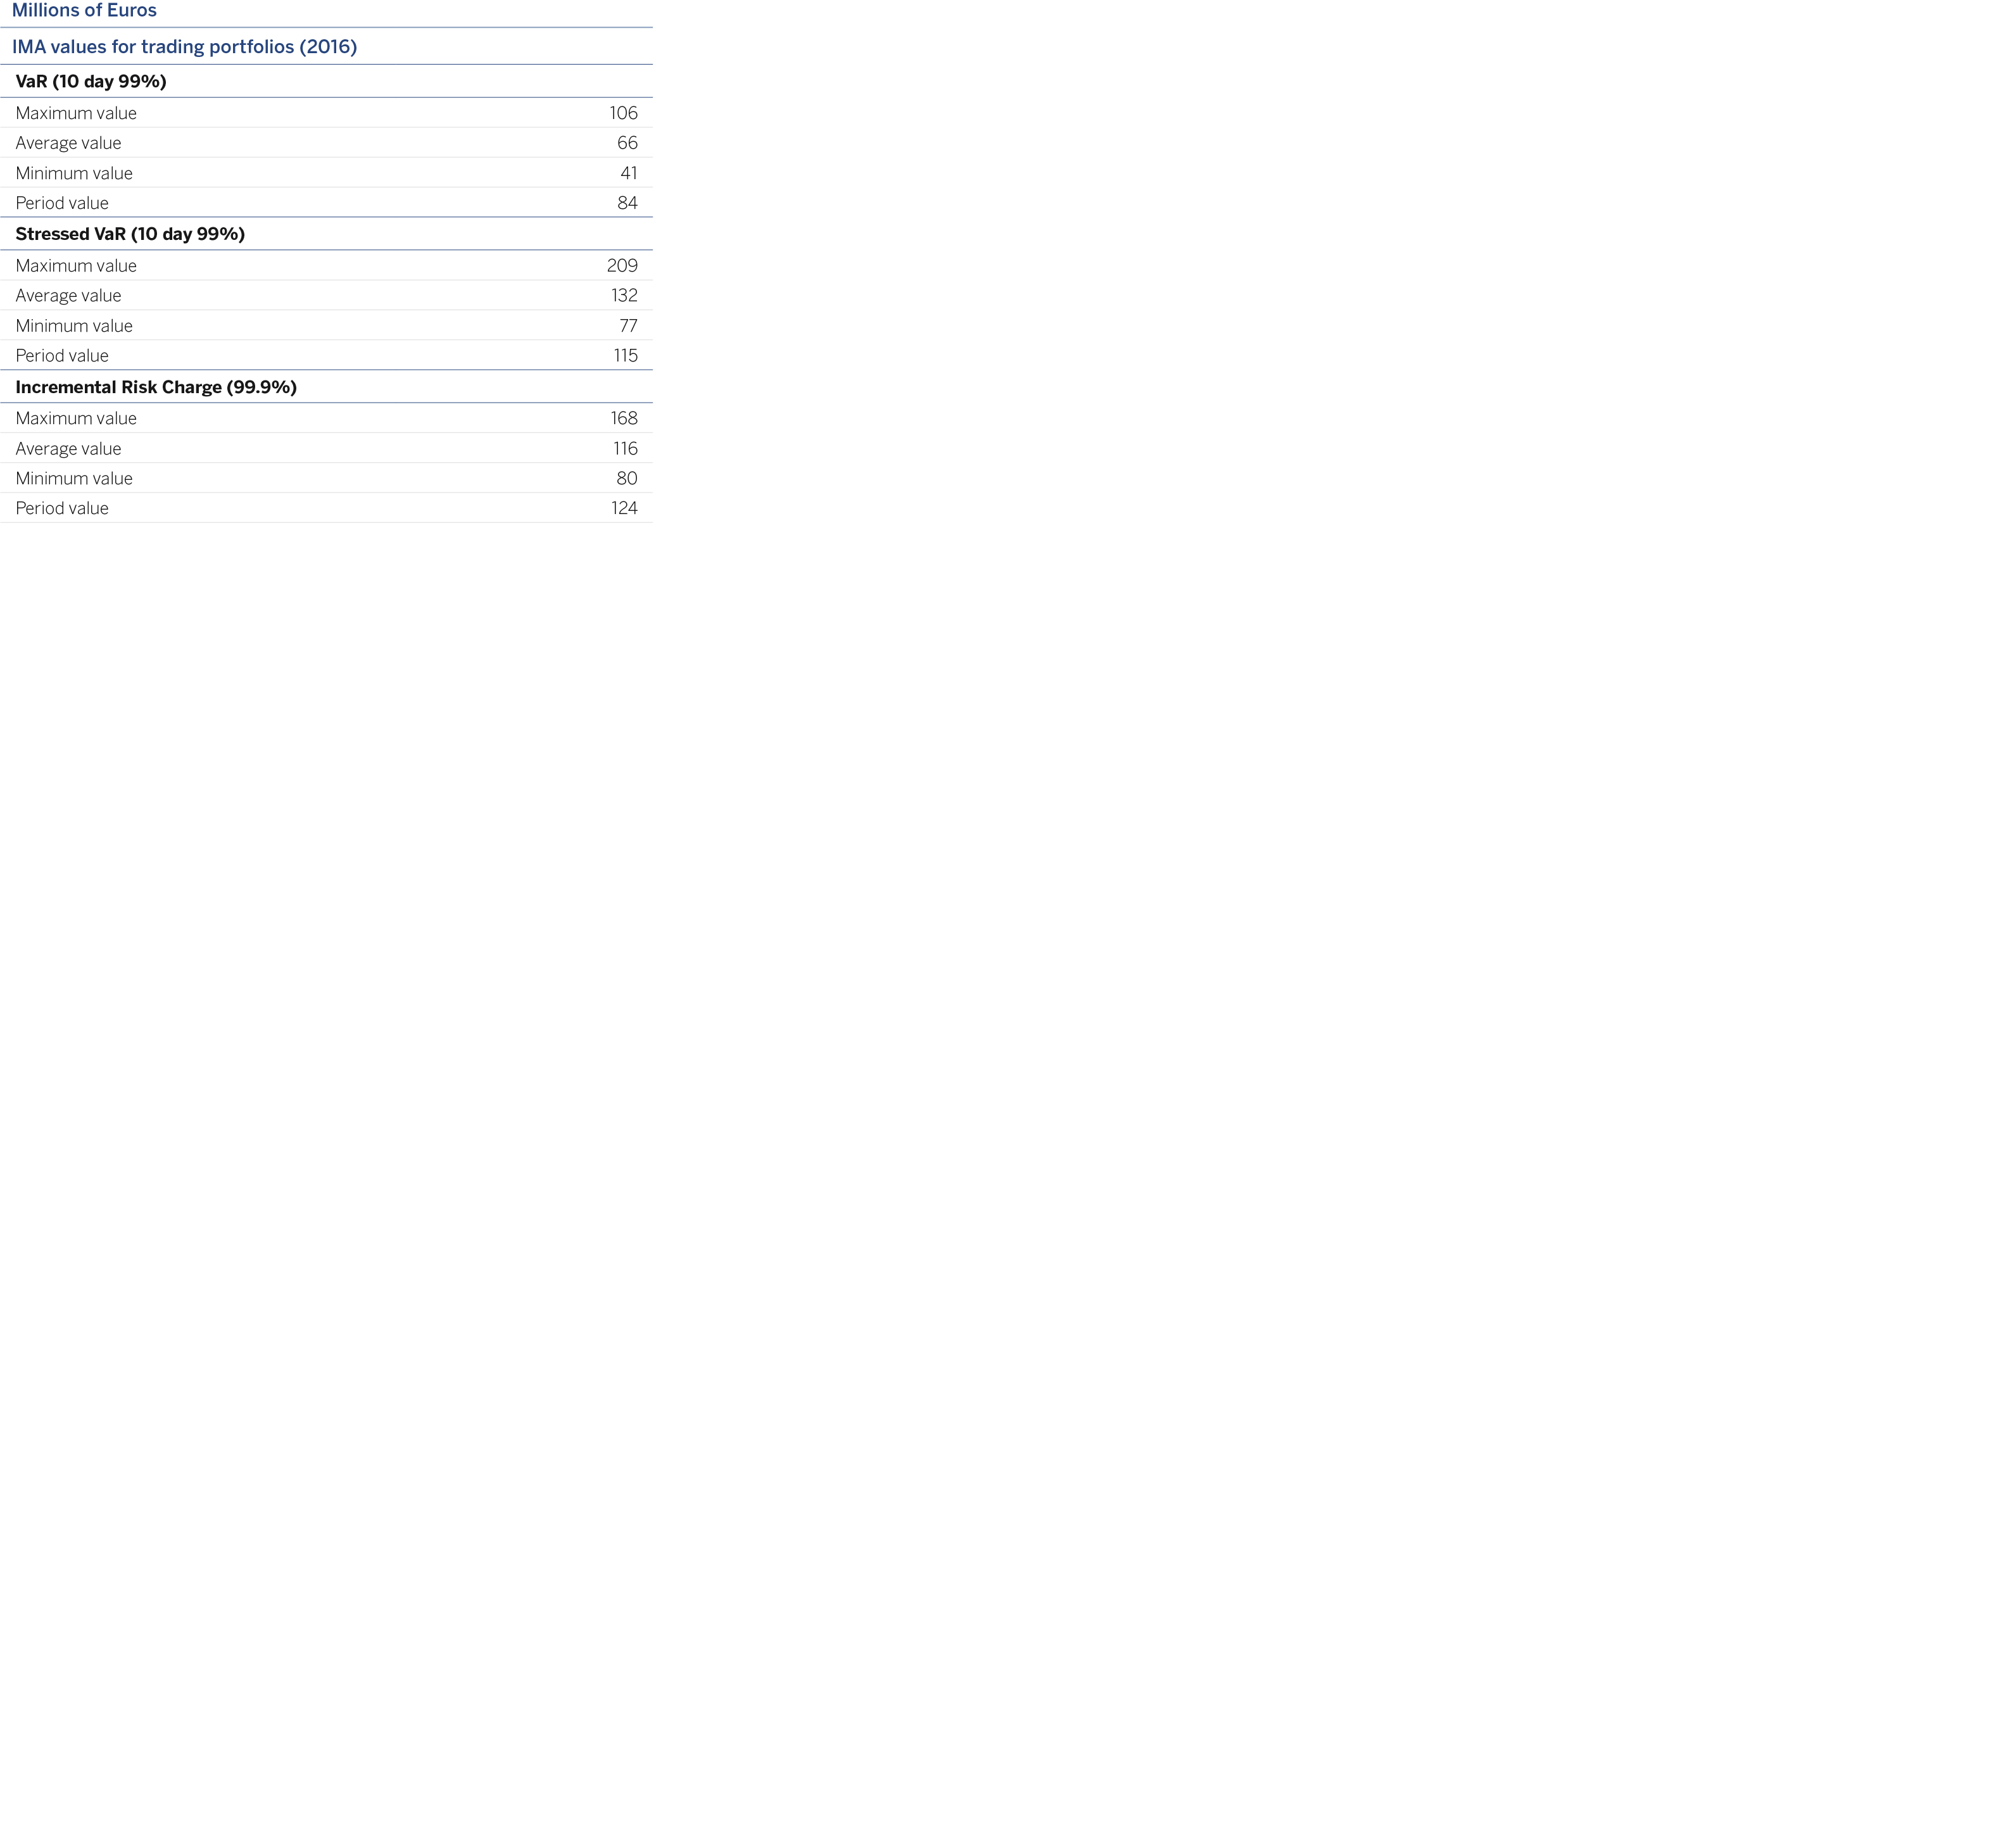
The following tables show VaR without smoothing by risk factor for the Group:

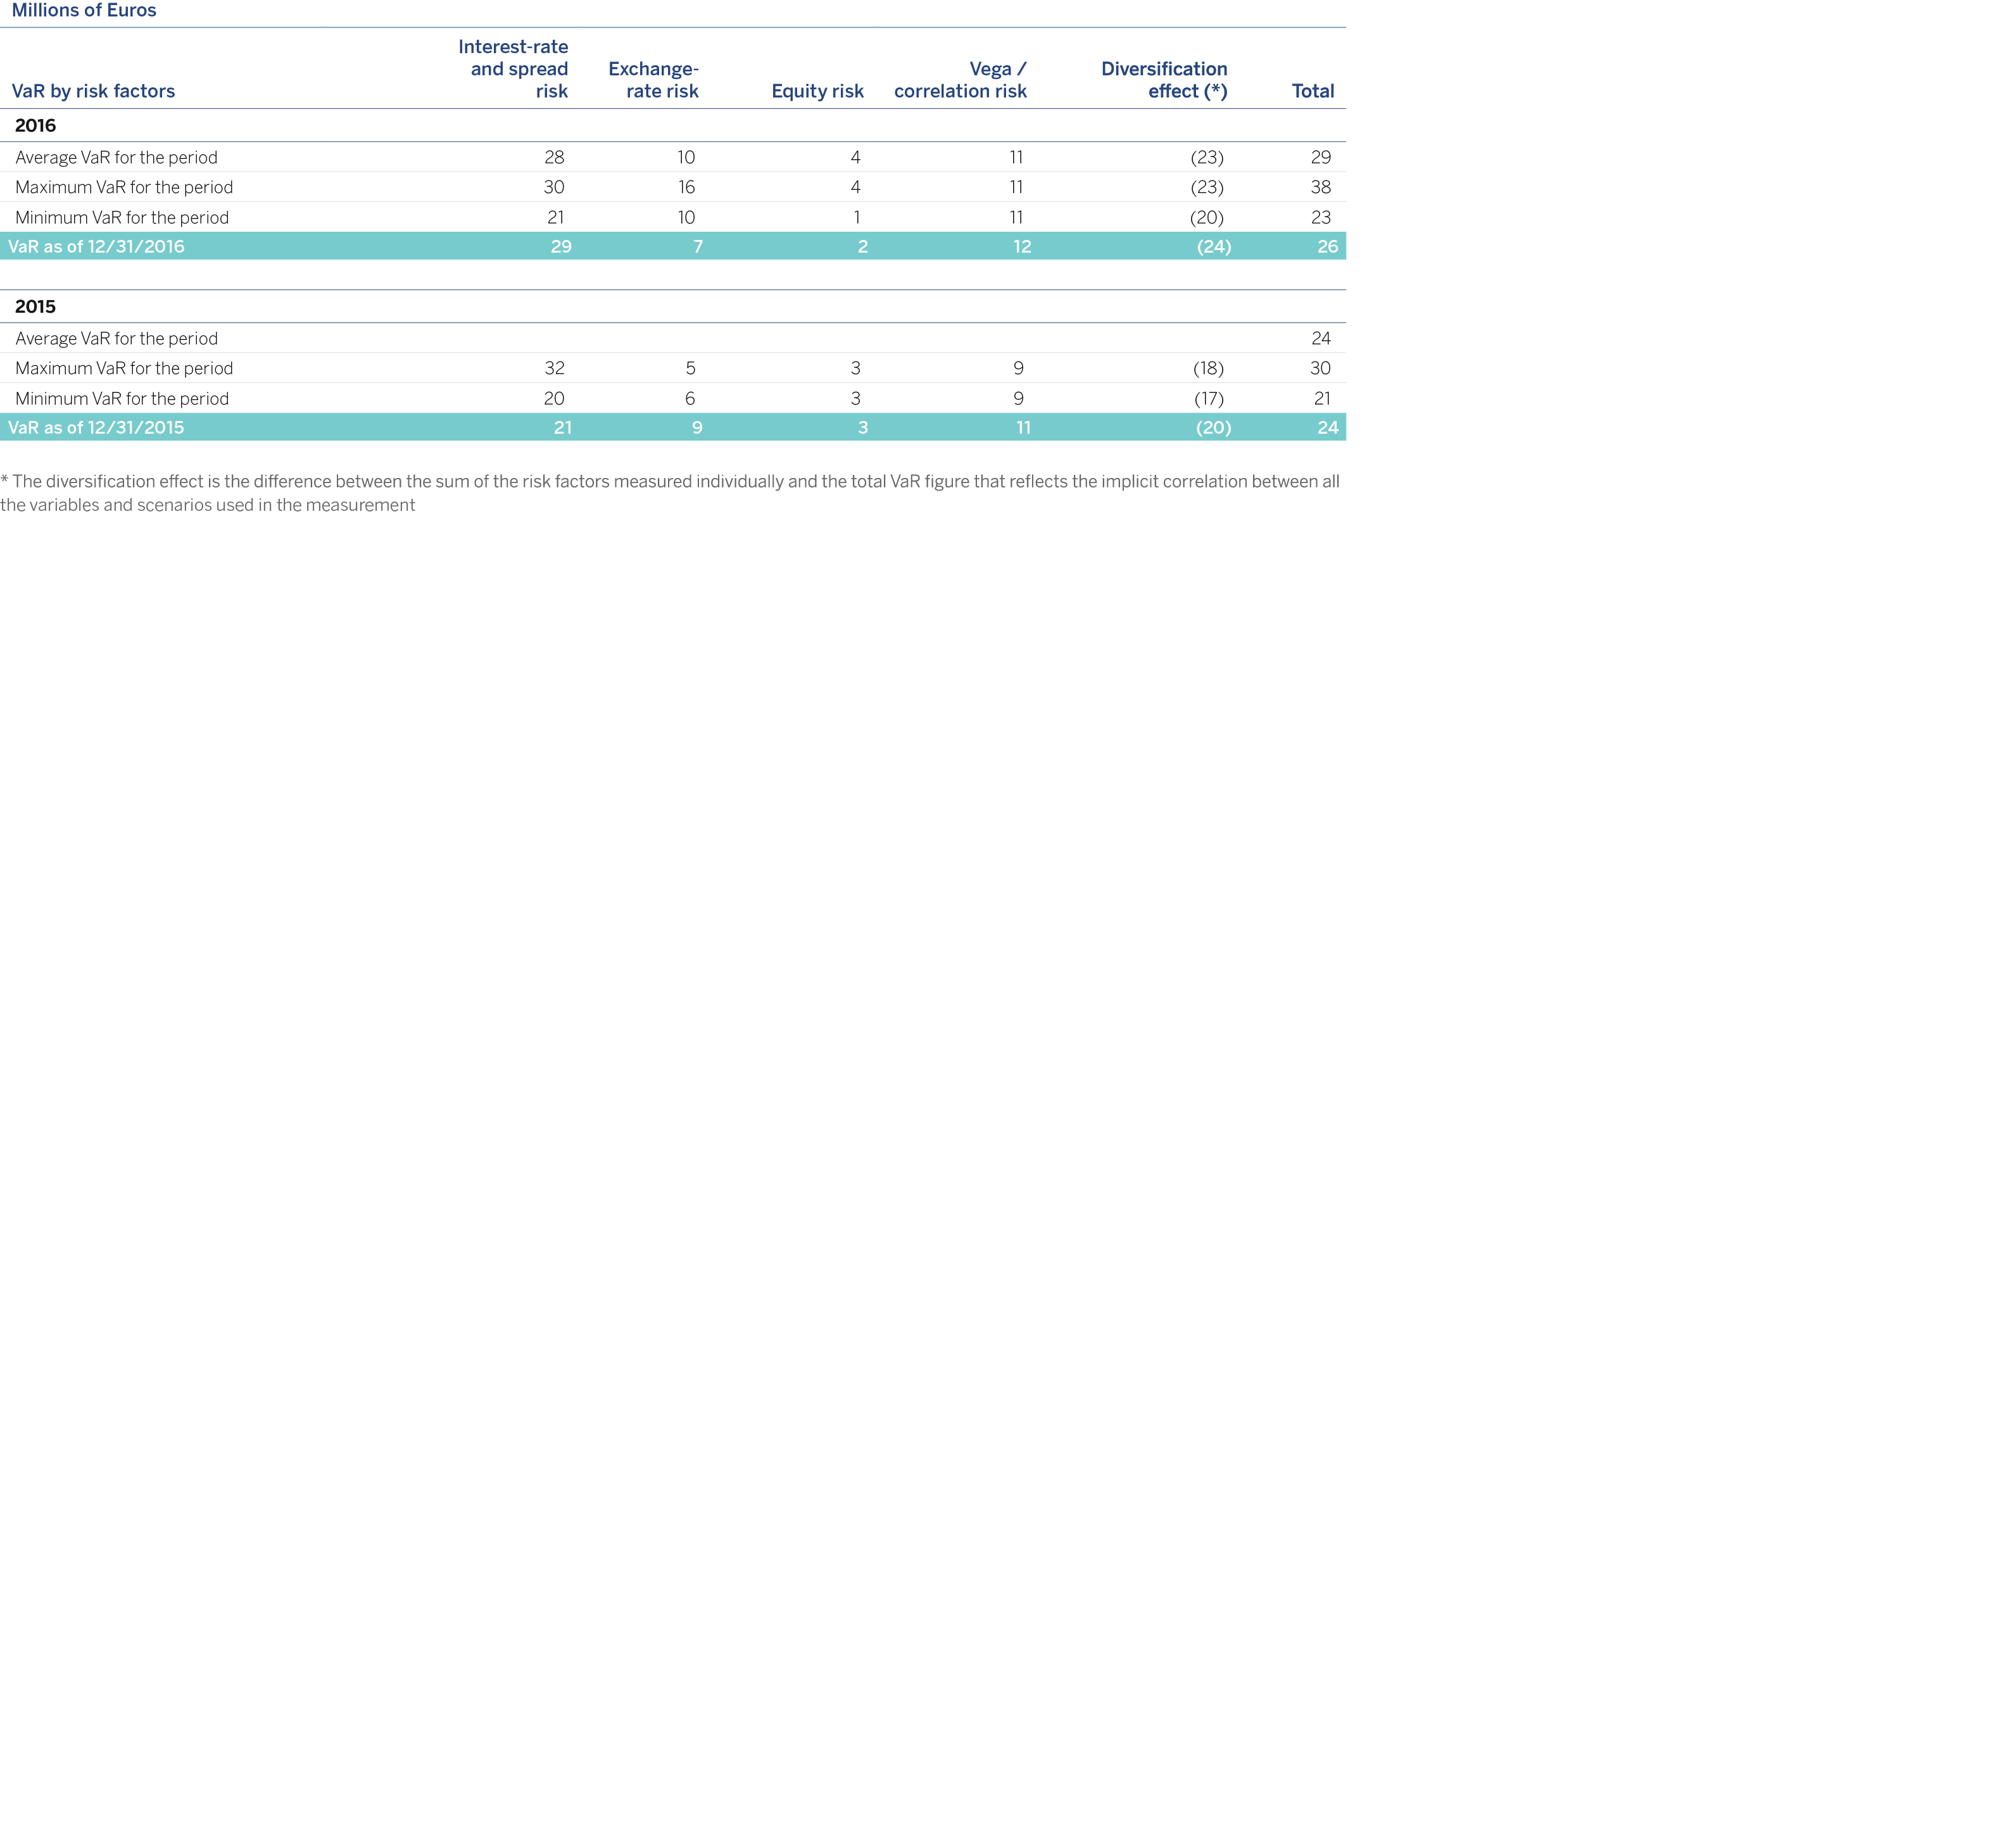
By type of market risk assumed by the Group's trading book, the main risk factor in the Group continues to be the one linked to interest rates, with a weight of 58% of the total at the end of 2016 (this figure includes the spread risk), with the relative weight increasing compared to the close of 2015 (48%). Foreign exchange risk accounts for 13%, decreasing its proportion compared with December 2015 (21%). Equity risk and volatility and correlation risk have also decreased, with a weight of 29% at the close of 2016 (vs. 32% at the end of 2015).
In accordance with article 455 e) of the CRR –corresponding to the breakdown of information on internal market risk models–, the elements comprising the shareholders' equity requirements referred to in articles 364 and 365 of the CRR are presented below.
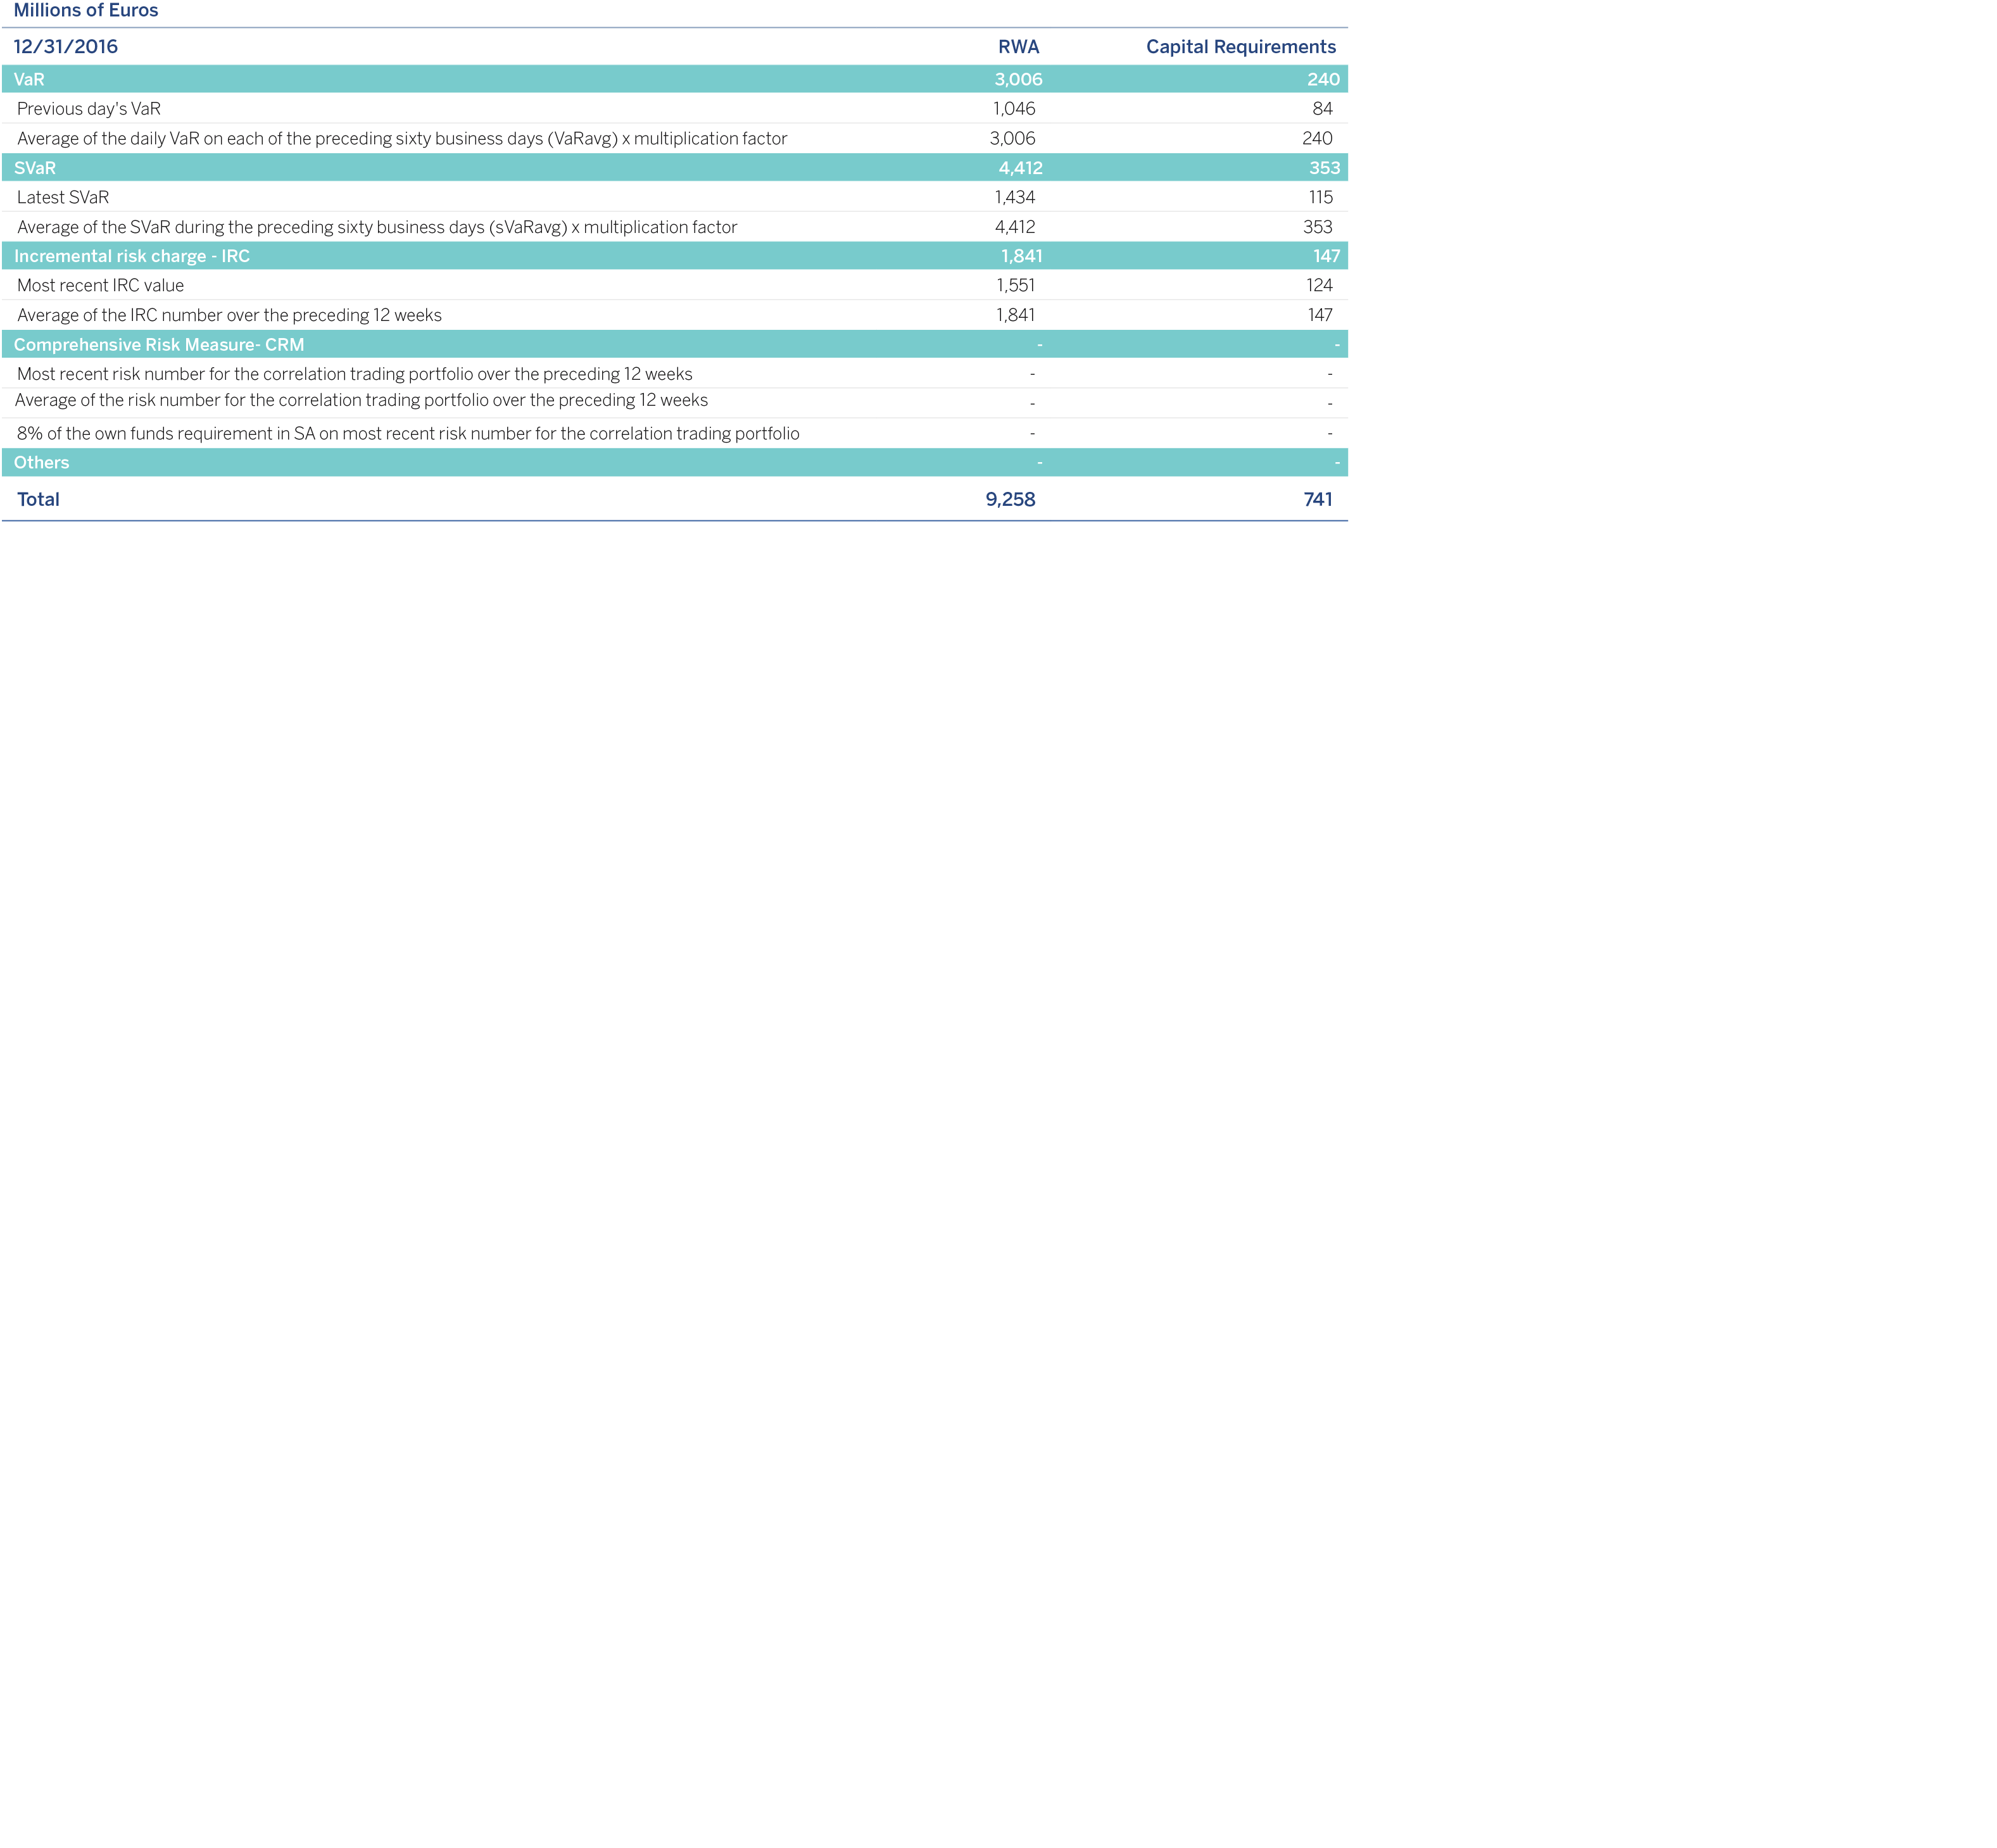
Below are the main changes in the market RWAs, calculated using the method based on internal models:
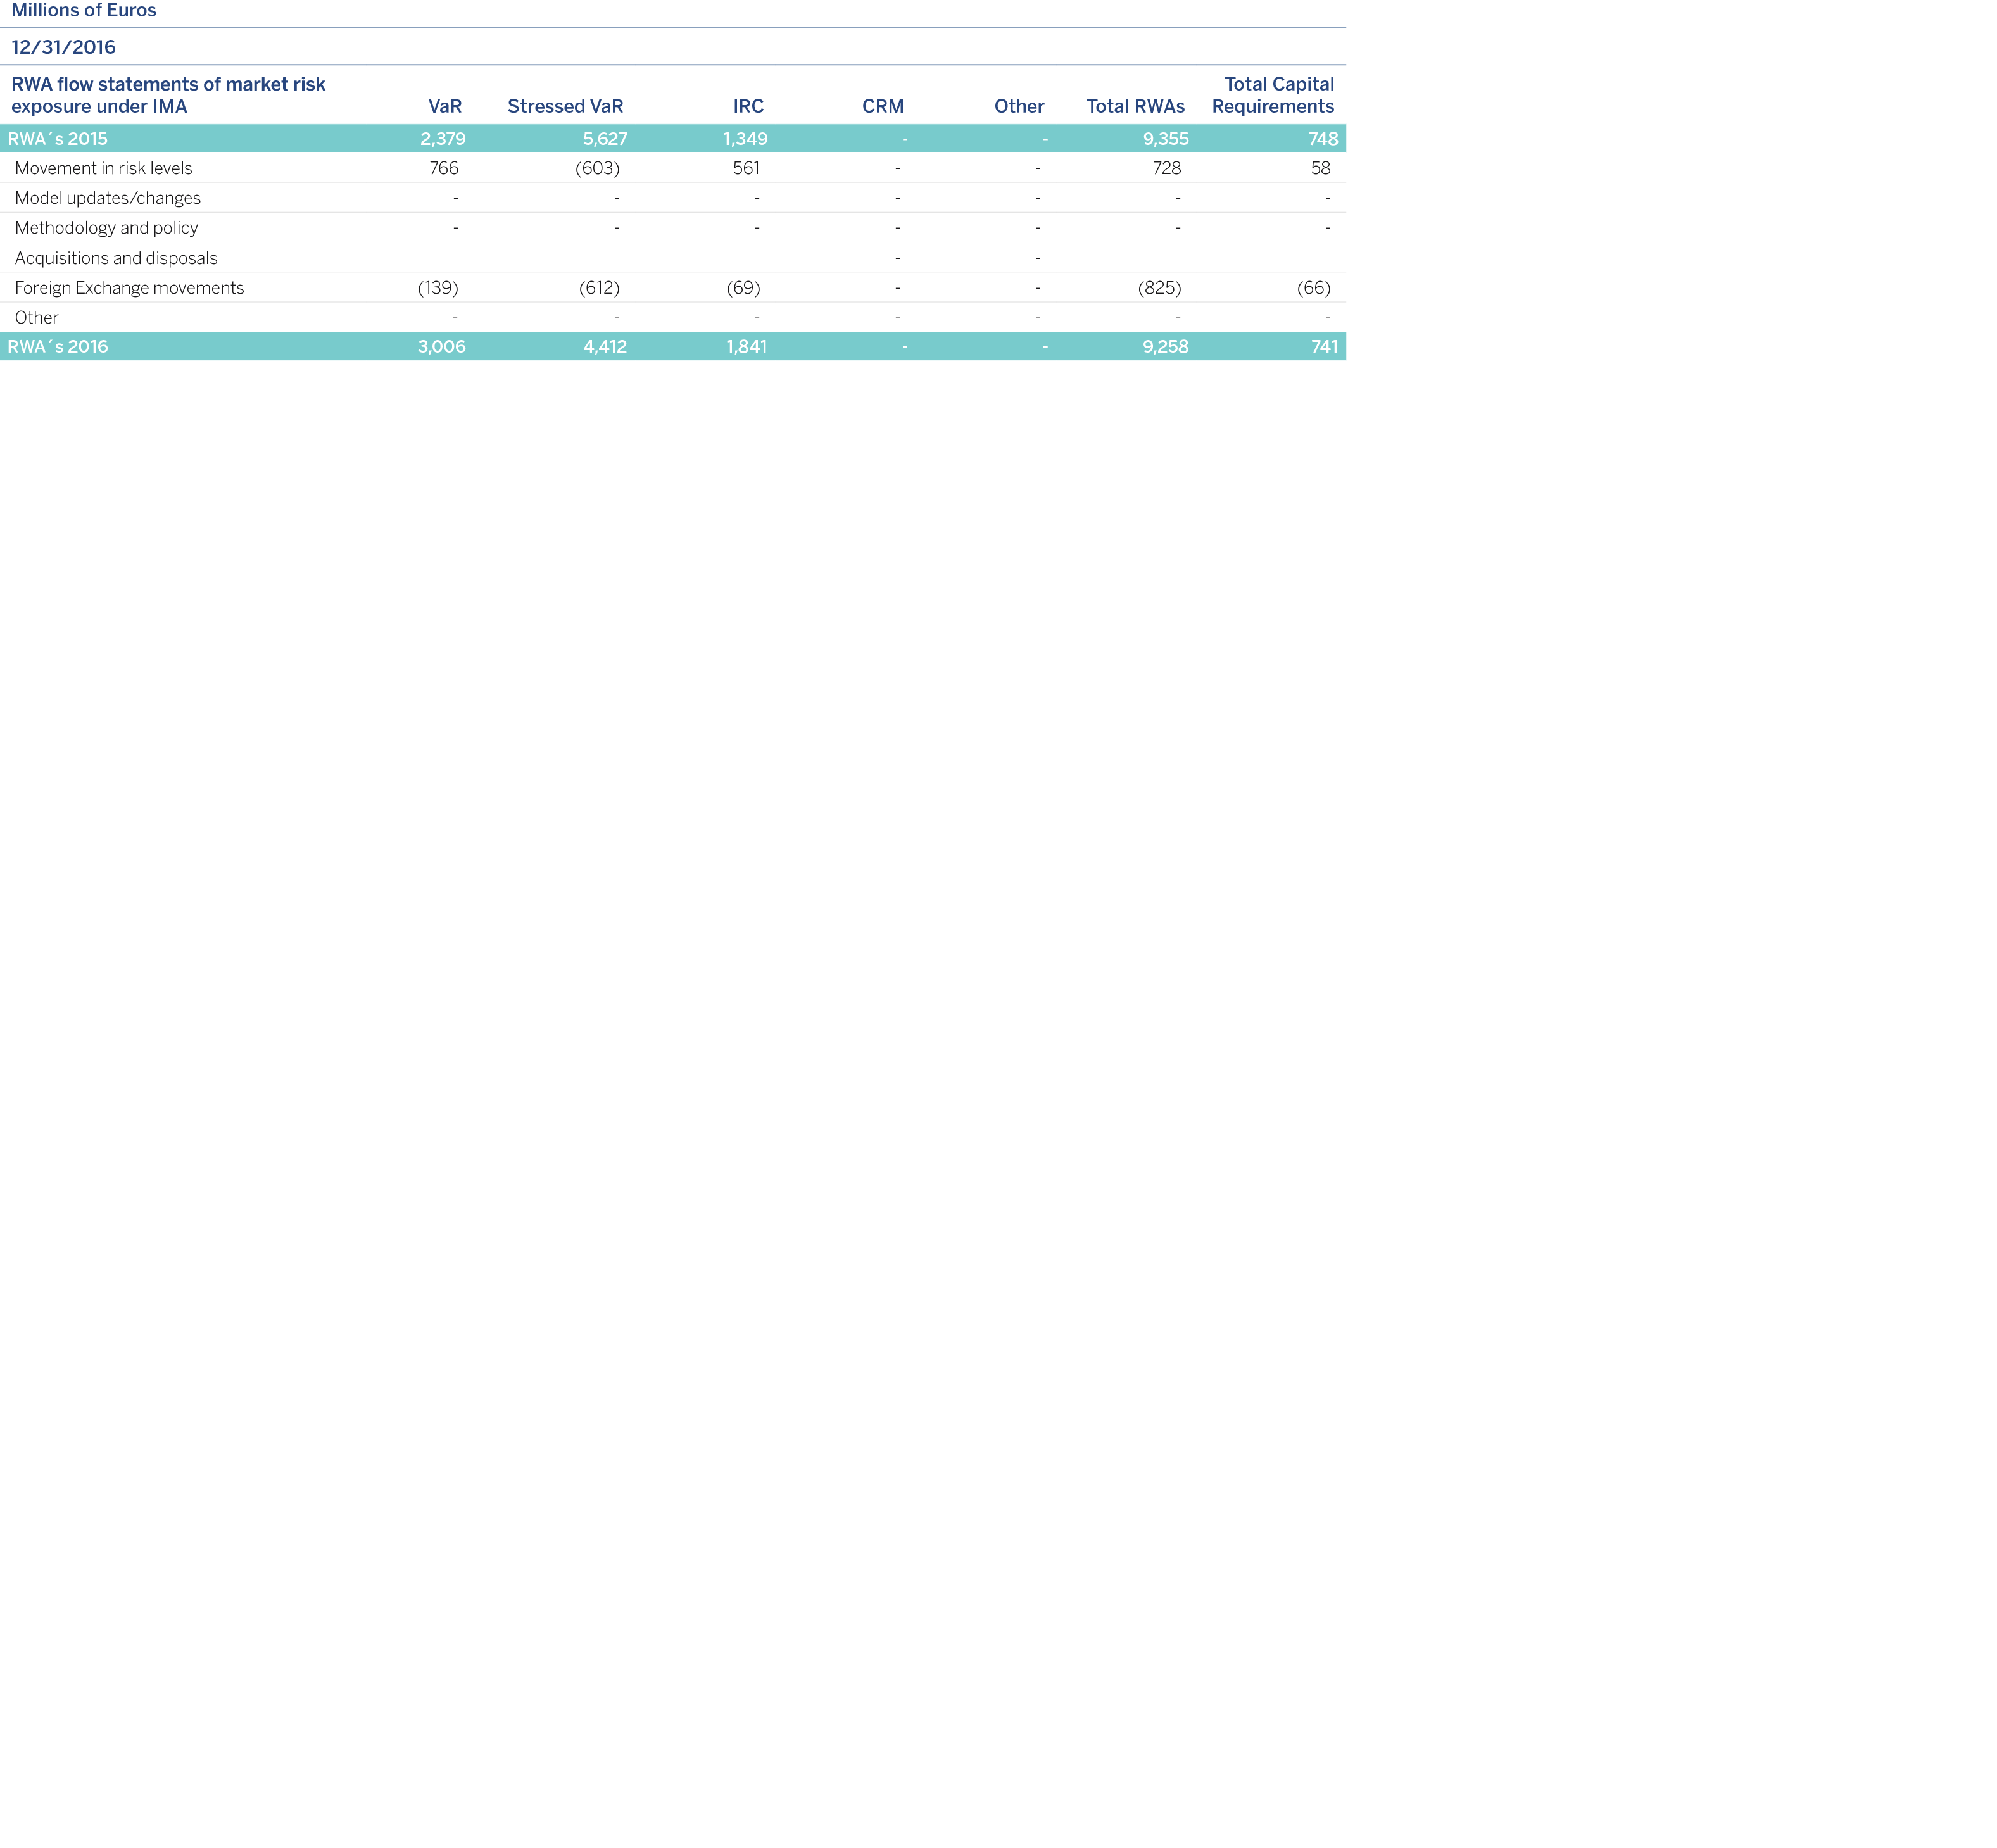
The variation is due to changes in market positions, mainly caused by volatility and correlations.
All the tasks associated with stress, methodologies, scenarios of market variables or reports are undertaken in coordination with the Group’s Risk Areas.
Different stress test exercises are performed on the BBVA Group's trading portfolios. Both local and global historical scenarios are used, which replicate the behavior of a past extreme event, for example, the collapse of Lehman Brothers or the Tequila crisis. These stress exercises are supplemented with simulated scenarios which aim to generate scenarios that have a significant impact on the different portfolios, but without being restricted to a specific historical scenario.
Lastly, for certain portfolios or positions, fixed stress test exercises are also prepared that have a significant impact on the market variables that affect those positions.
The base historical stress scenario in the BBVA Group is that of Lehman Brothers, whose sudden collapse in September 2008 had a significant impact on the behavior of financial markets at a global level. The most relevant effects of this historical scenario include:
1) Credit shock: reflected mainly in the increase in credit spreads and downgrades of credit ratings.
2) Increased volatility in most financial markets (giving rise to much variation in the prices of the different assets (currencies, equity, debt)).
3) Liquidity shock in the financial systems, reflected in major fluctuations in interbank curves, particularly in the shortest sections of the euro and dollar curves.
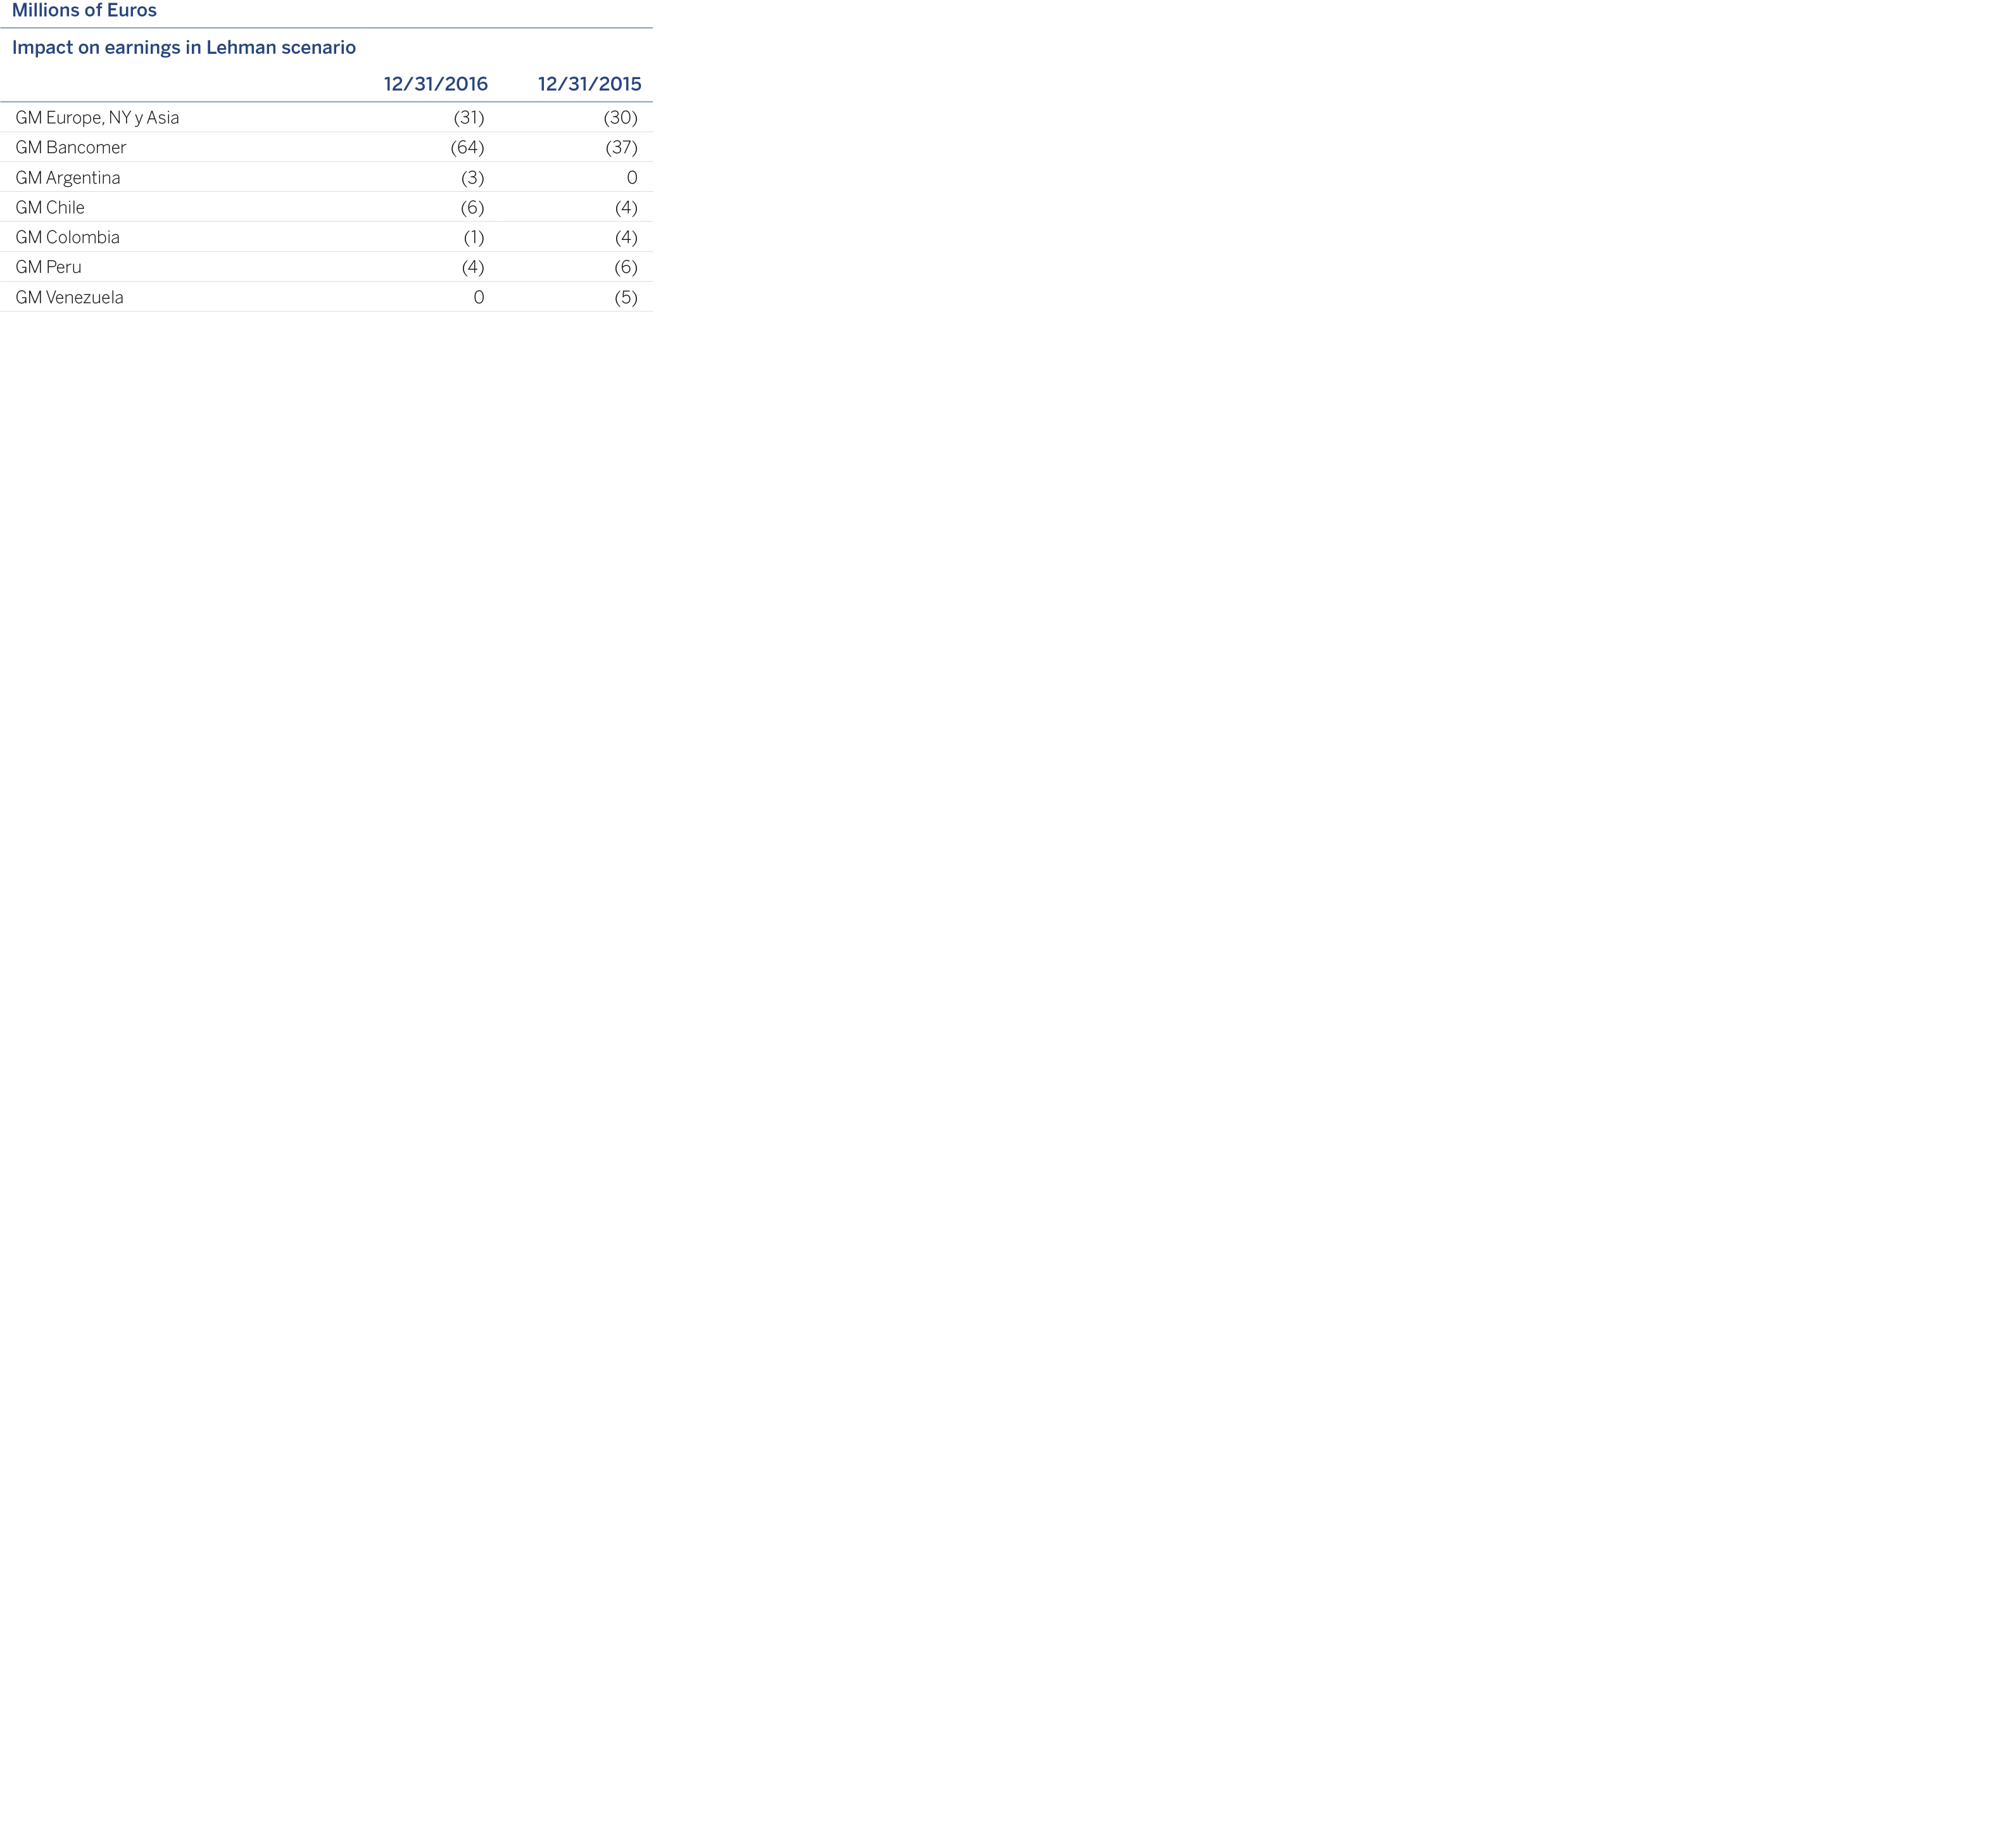
Simulated scenarios
Unlike the historical scenarios, which are fixed and, thus, do not adapt to the composition of portfolio risks at any given time, the scenario used to perform the economic stress exercises is based on the Resampling method. This methodology is based on the use of dynamic scenarios that are recalculated on a regular basis according to what the main risks in the trading portfolios are. A simulation exercise is carried out in a data window wide enough to include different stress periods (data is taken from 1-1-2008 until today) by the re-sampling of historical observations. This generates a distribution of gains and losses that allows an analysis of the most extreme events in the selected historical window.
The advantage of this methodology is that the stress period is not pre-established, but rather a function of the portfolio held at any given time; and the large number of simulations (10,000) means that the expected shortfall analysis can include richer information than that available in scenarios included in the VaR calculation.
The main features of this methodology are as follows:
a) The simulations generated follow the data correlation structure
b) It provides flexibility in terms of including new risk factors
c) It enables a great deal of variability to be introduced (which is desirable for considering extreme events)
The impact of the stress tests by simulated scenarios (Stressed VaR 95% at 20 days, Expected Shortfall 95% at 20 days and Stressed VaR 99% at 1 day) is shown below:
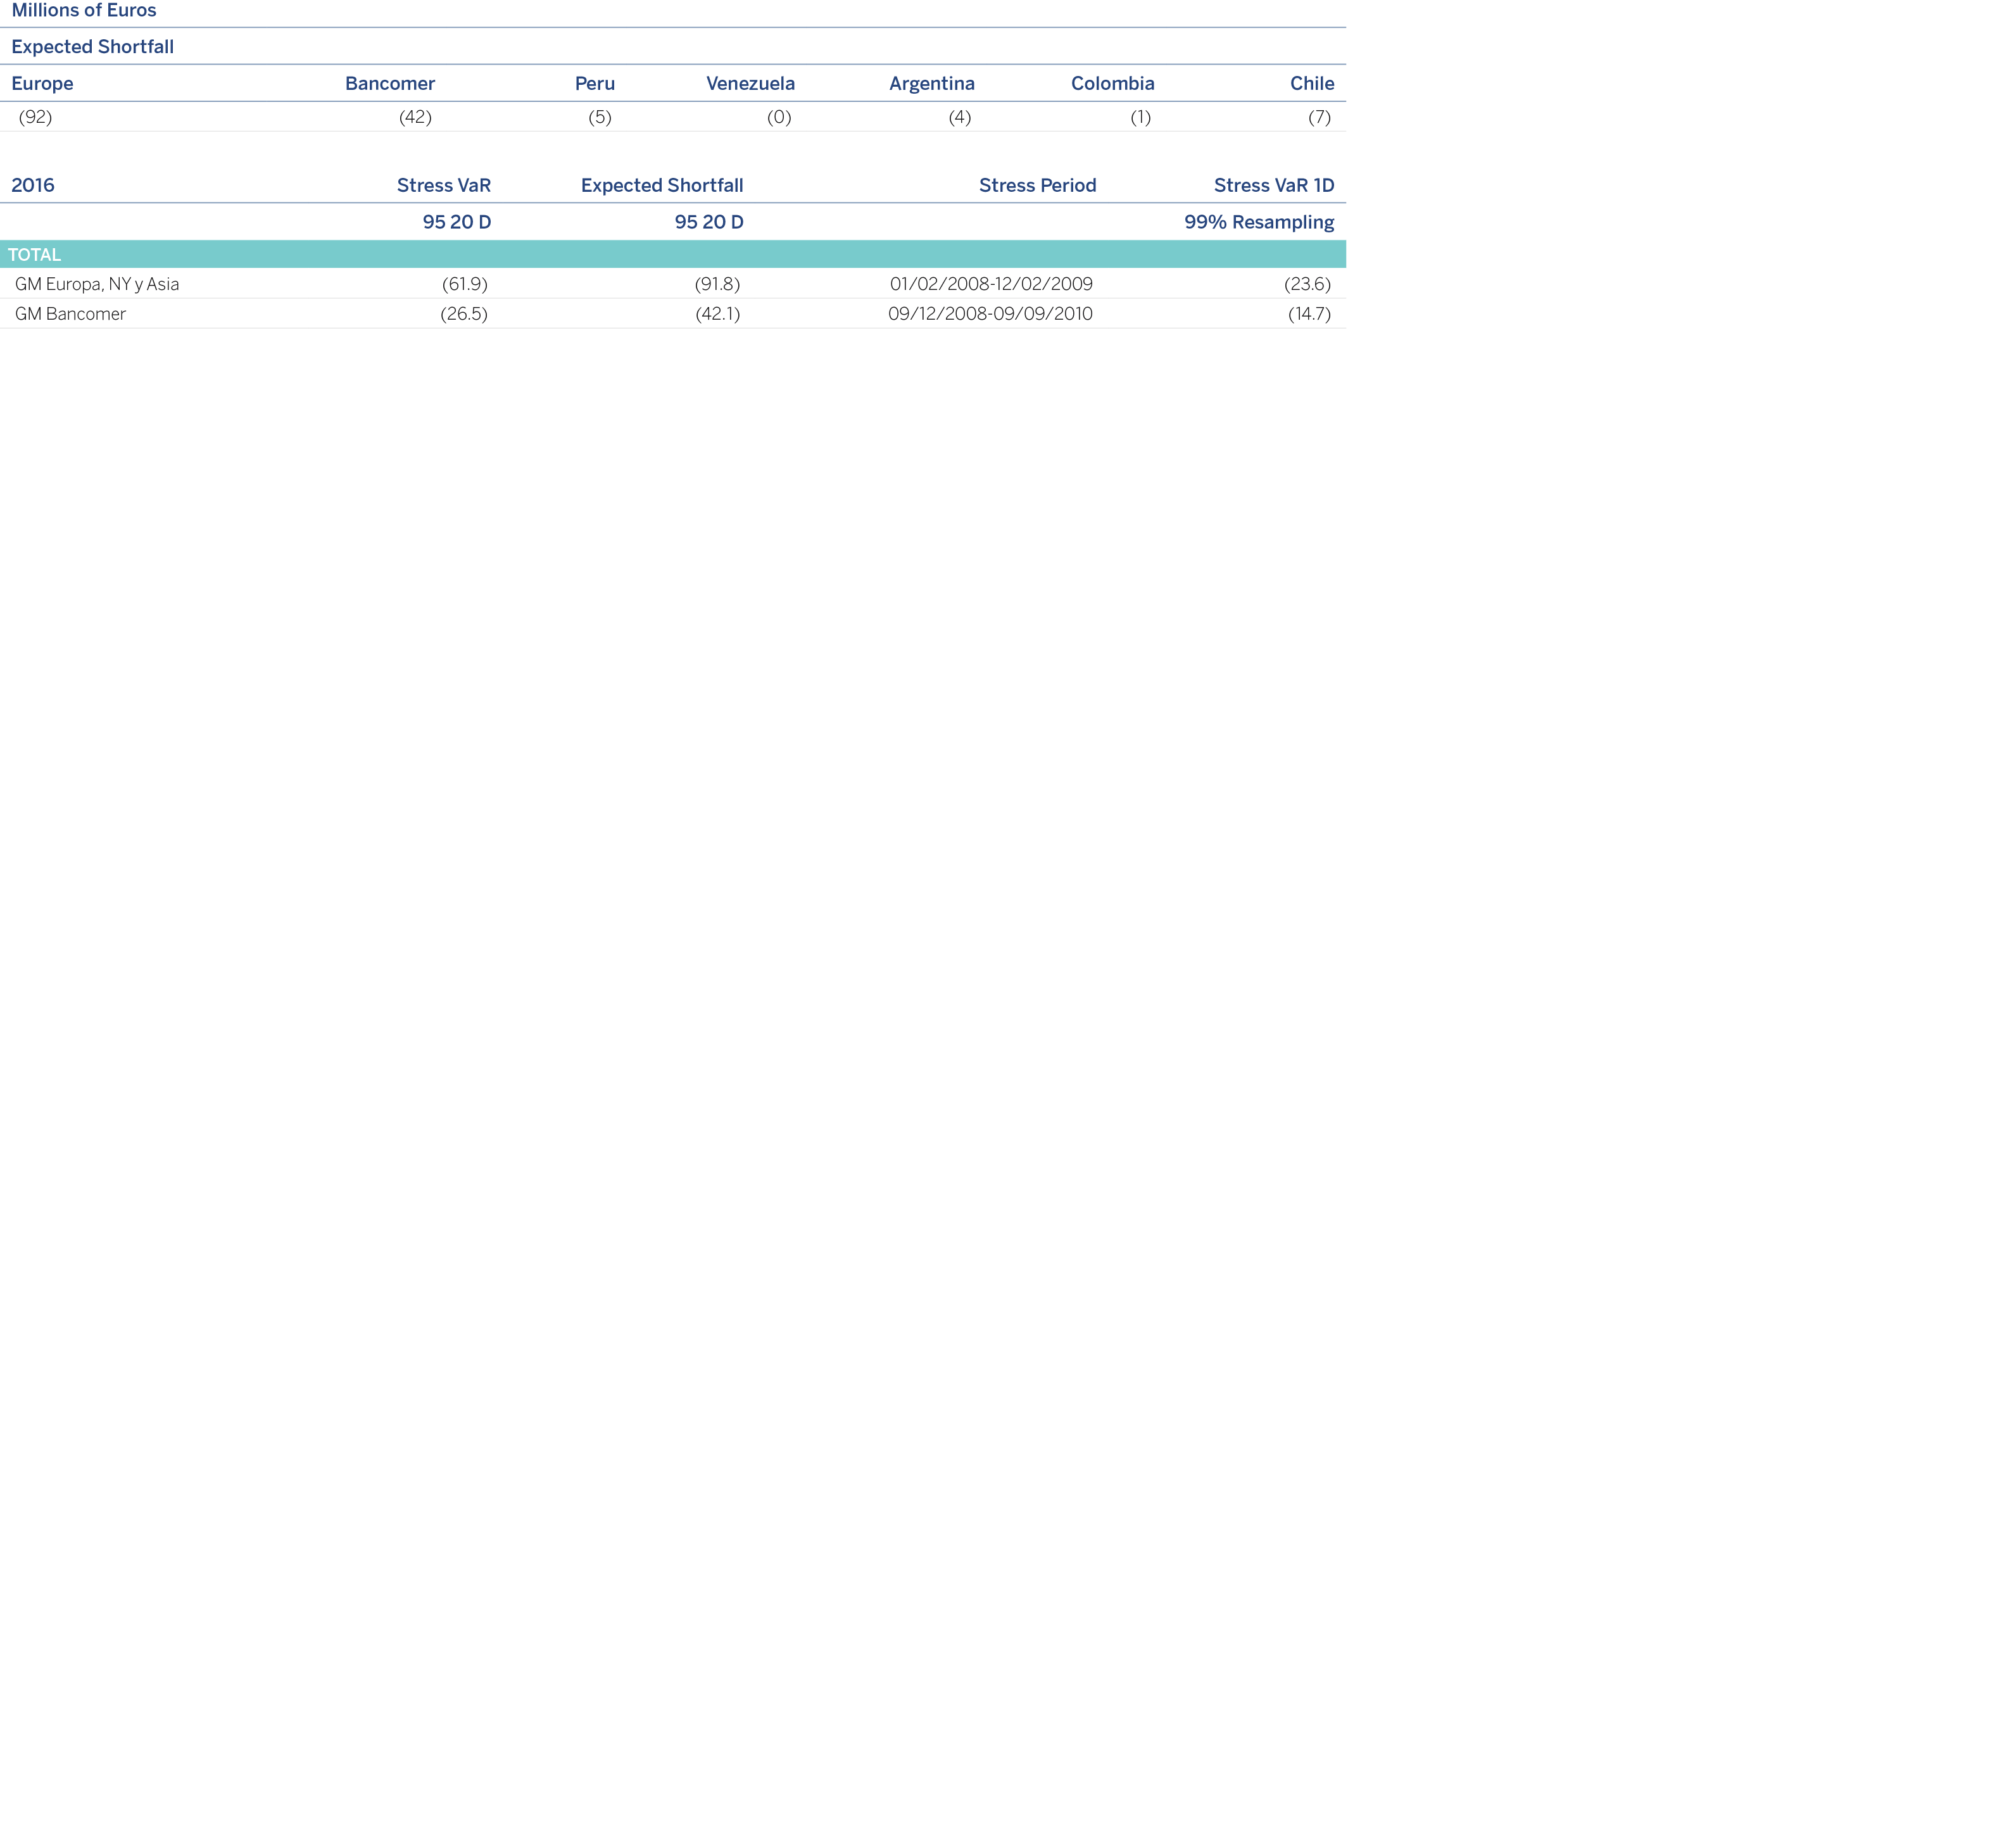
The Group’s market risk measurement model needs to have a back-testing or selfvalidation program, which assures that the risk measurements being made are suitable.
The internal market risk model is validated on a regular basis by backtesting in both BBVA S.A. and Bancomer.
The purpose of backtesting is to validate the quality and accuracy of the internal model used by the BBVA Group to estimate the maximum daily loss for a portfolio, for a 99% confidence level and a time horizon of 250 days, by comparing the Group's results and the risk measures generated by the model.
These tests confirmed that the internal market risk model used by BBVA S.A. and Bancomer is adequate and accurate.
Two types of backtesting were performed in 2016:
a. "Hypothetical" backtesting: the daily VaR is compared with the results obtained without taking into account the intraday results or the changes in the portfolio's positions. This validates that the market risk metric is appropriate for the end-ofday position.
b. "Real" backtesting: the daily VaR is compared with the total results, including intraday operations, but deducting any possible allowances or commissions generated. This type of backtesting incorporates the intraday risk in the portfolios.
In addition, each of these two types of backtesting was performed at risk factor or type of business level, thus providing a more in-depth comparison of results versus risk measures.


The Group has a risk management system in place which is appropriate for the volume of risks managed, complying with the functions set out in the Corporate Policy on Market Risks in Market Activities.
The risk units must have:
A suitable organization (means, resources and experience) in line with the nature and complexity of the business.
Segregation of functions and independence in decision-making.
Performance under integrity and good governance principles, driving the best practices in the industry and complying with the rules, both internal (policies, procedures) and external (regulation, supervision, guidelines).
The existence of channels for communication with the relevant corporate bodies at local level according to their corporate governance system, as well as with the Corporate Area.
All market risks existing in the business units that carry out their activity in markets must be adequately identified, measured and assessed, and procedures must be in place for their control and mitigation.
The Global Market Risk Unit (GMRU), as the unit responsible for managing market risk at Group level, must promote the use of objective and uniform metrics for measuring the different types of risks.
The BBVA Group’s exposure to structural risk in the equity portfolio basically results from the holdings in industrial and financial companies, with medium/long-term investment horizons. It includes the holdings consolidated in the Group, although their variations in value have no immediate effect on equity in this case.
This exposure is mitigated through net short positions held in derivatives on their underlying assets, which are used to limit portfolio sensitivity to potential falls in prices.
The GRM corporate area acts as an independent unit that is responsible for monitoring and analyzing risks, standardizing risk management metrics and providing tools that can anticipate potential deviations from targets.
It also monitors the level of compliance with the limits set, according to the Risk Appetite and as authorized by the Executive Committee. It reports on these levels regularly to the Global Risk Management Committee (GRMC), the Board's Risk Committee and the Executive Committee, particularly in the case of overruns of the limits set.
The mechanisms of risk control and limitation hinge on the key aspects of exposure, earnings and economic capital. The structural equity risk management metrics designed by GRM according to the corporate model contribute to effective risk monitoring by estimating the sensitivity figures and the capital necessary to cover possible unexpected losses due to the variations in the value of the companies making up the Group’s equity portfolio, at a confidence level that corresponds to the institution’s target rating, and taking into account the liquidity of the positions and the statistical performance of the assets under consideration.
To carry out a more in-depth analysis, stress tests and sensitivity analyses are carried out from time to time against different simulated scenarios, using both past crisis situations and forecasts by BBVA Research as the base. This checks that the risks are limited and that the tolerance levels set for the Group are not endangered.
On a monthly basis, backtesting is carried out on the risk measurement model used.
The financial instruments contained in the available-for-sale financial assets portfolio are valued at their fair value both in their initial entry and on subsequent valuations.
These changes are recorded in equity unless objective evidence exists that the fall in value is due to asset impairment where the amounts recorded will be written-off from equity and they will be taken directly to the income statement.
The portfolio held for sale is reflected in accounting terms by the entry entitled availablefor-sale assets. In the case of capital instruments, this portfolio will include the capital instruments of institutions that are not strategic, which are not classified as the Group's subsidiaries, associates, or jointly controlled businesses, and that have not been included in the fair value through profit or loss category.
The portfolio held for strategic purposes is included for accounting purposes under the heading of available-for-sale financial assets. An investment in capital instruments is considered strategic when it has been made with the intent of setting up or maintaining a long-term operating relationship with the subsidiary, although there is no significant influence on it, if at least one of the following situations is in place:
Representation on the Board of Directors or equivalent management body in the subsidiary.
Participation in the policy setting process, including those related to dividends and other payouts.
The existence of significant transactions between the investing institution and the subsidiary.
The exchange of senior management staff.
The supply of expert information of an essential nature.
The accompanying table shows the book value, exposure and RWAs of portfolios held for Value of equity investments and capital instruments:
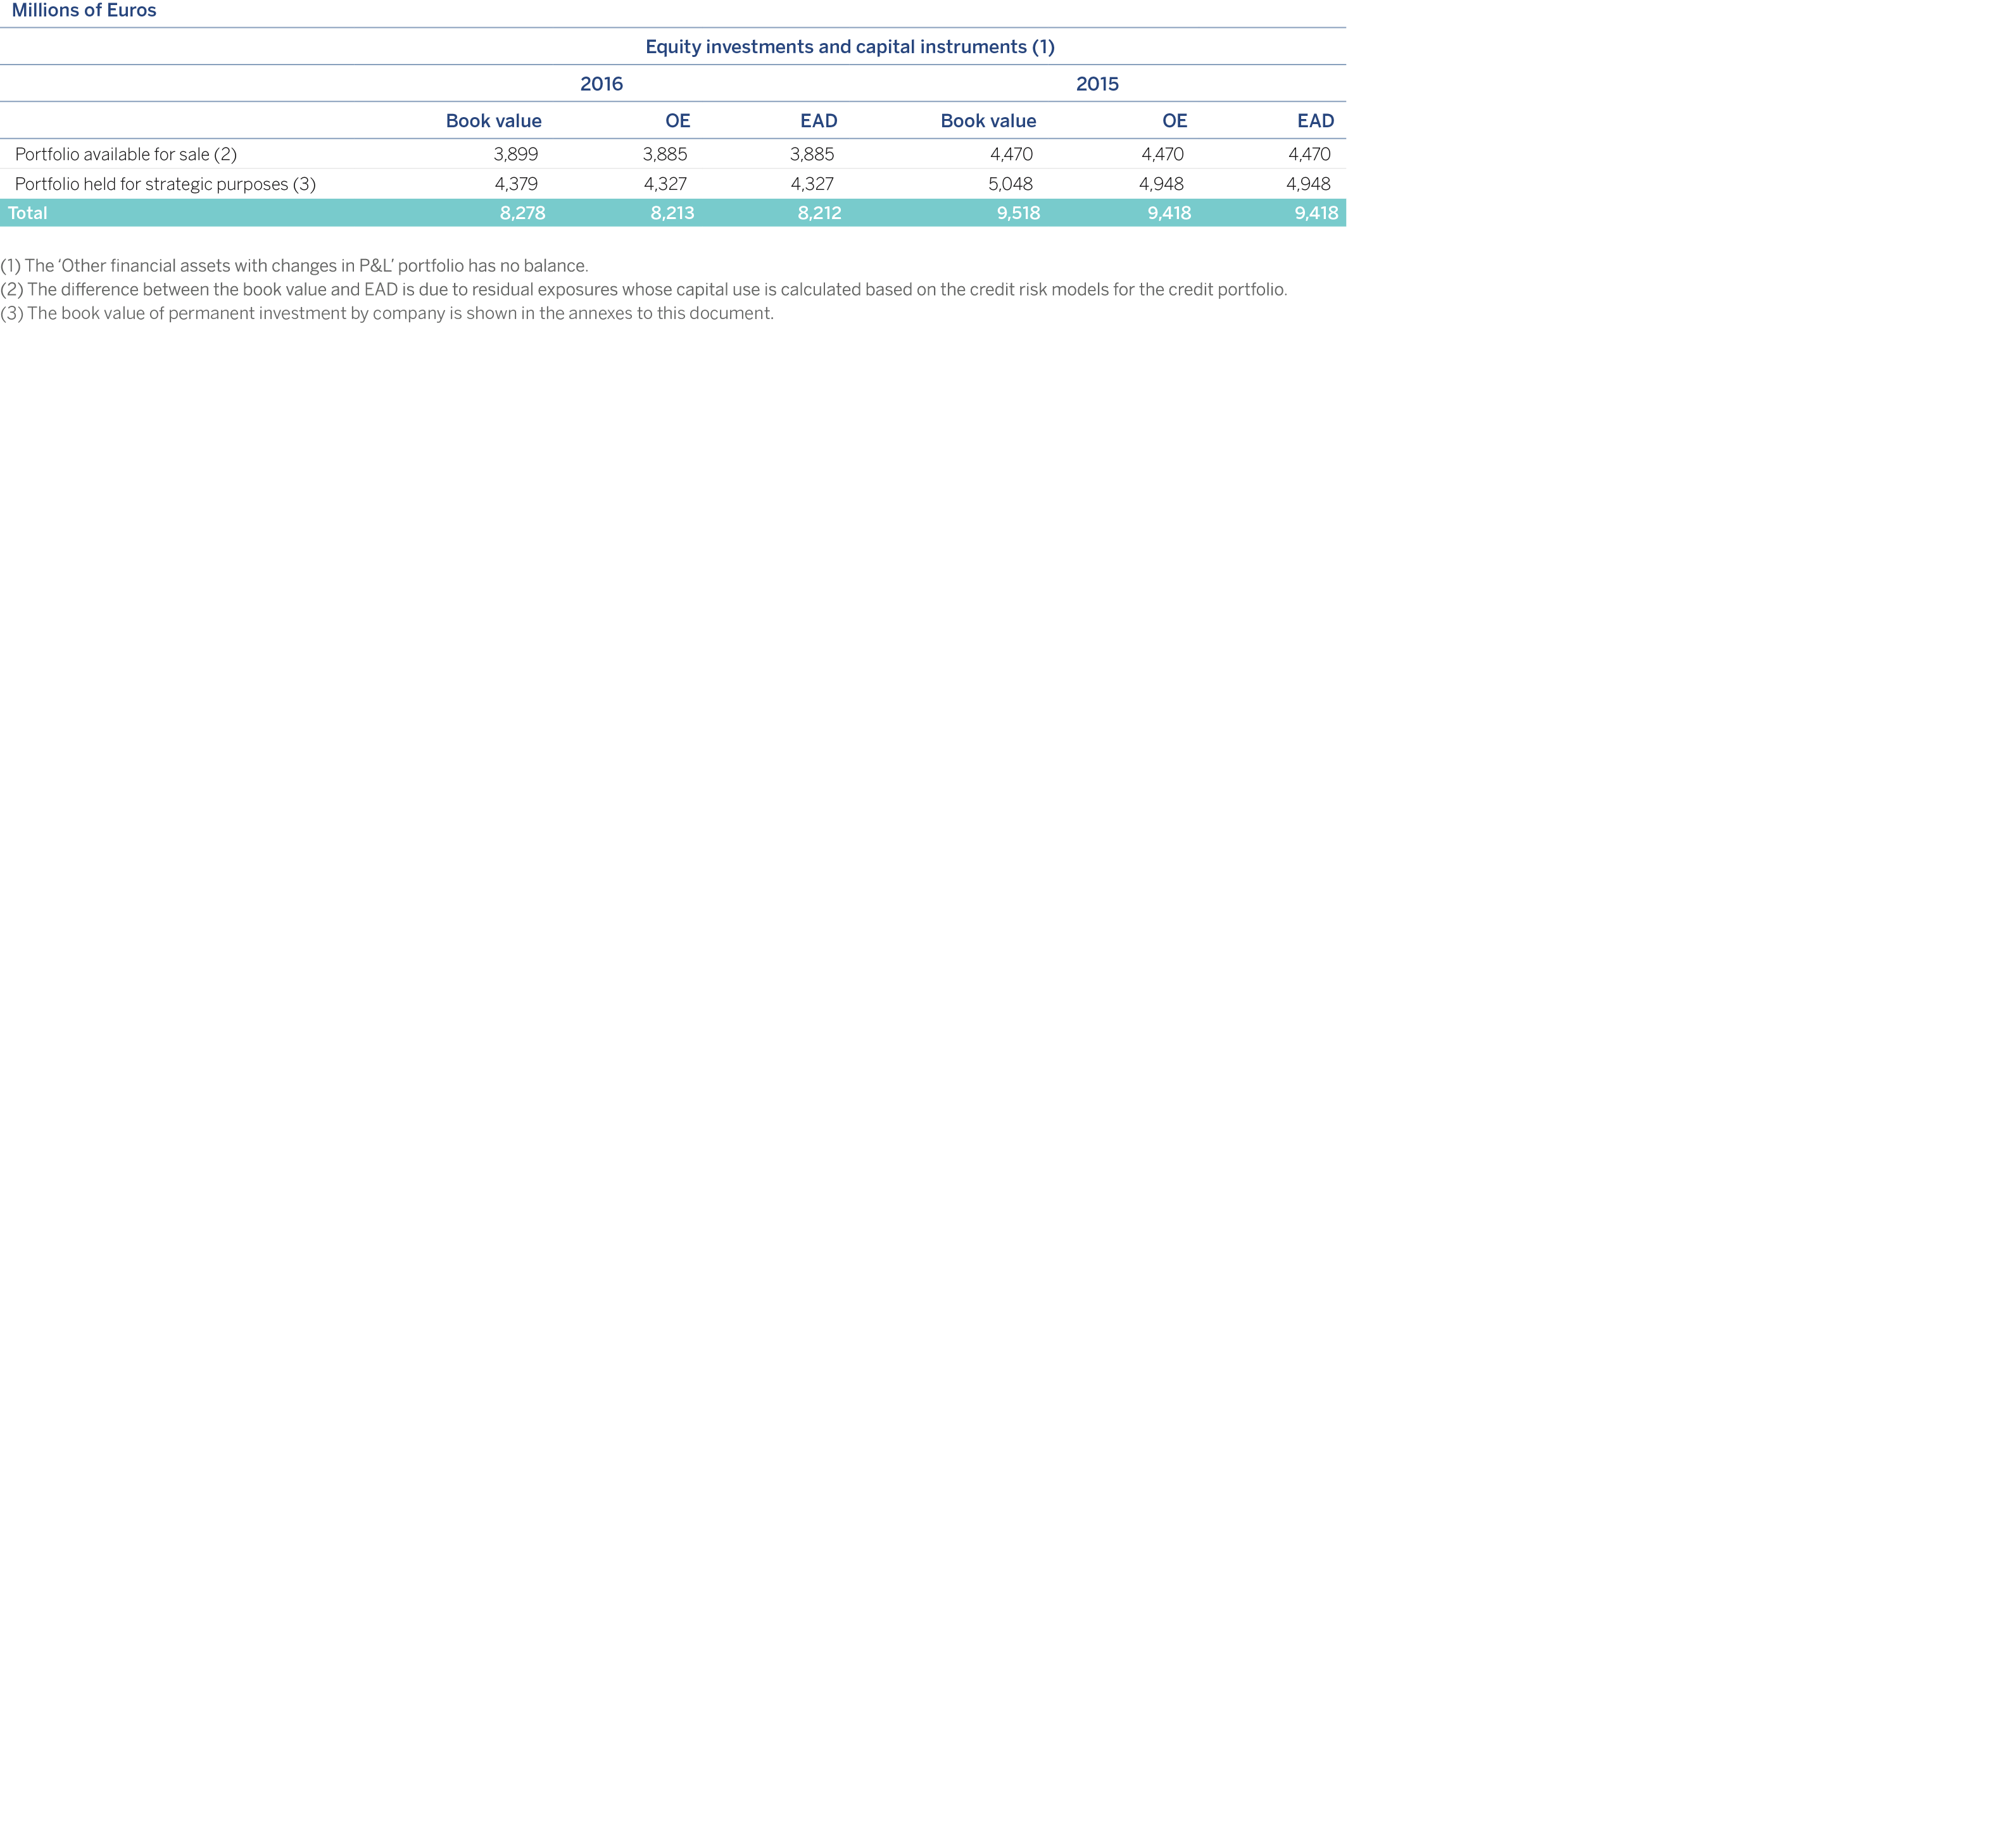
The accompanying table shows the types, nature and amounts of the original exposures in equity investments listed or unlisted on a stock market, with an item differentiating sufficiently diversified portfolios and other unlisted instruments:
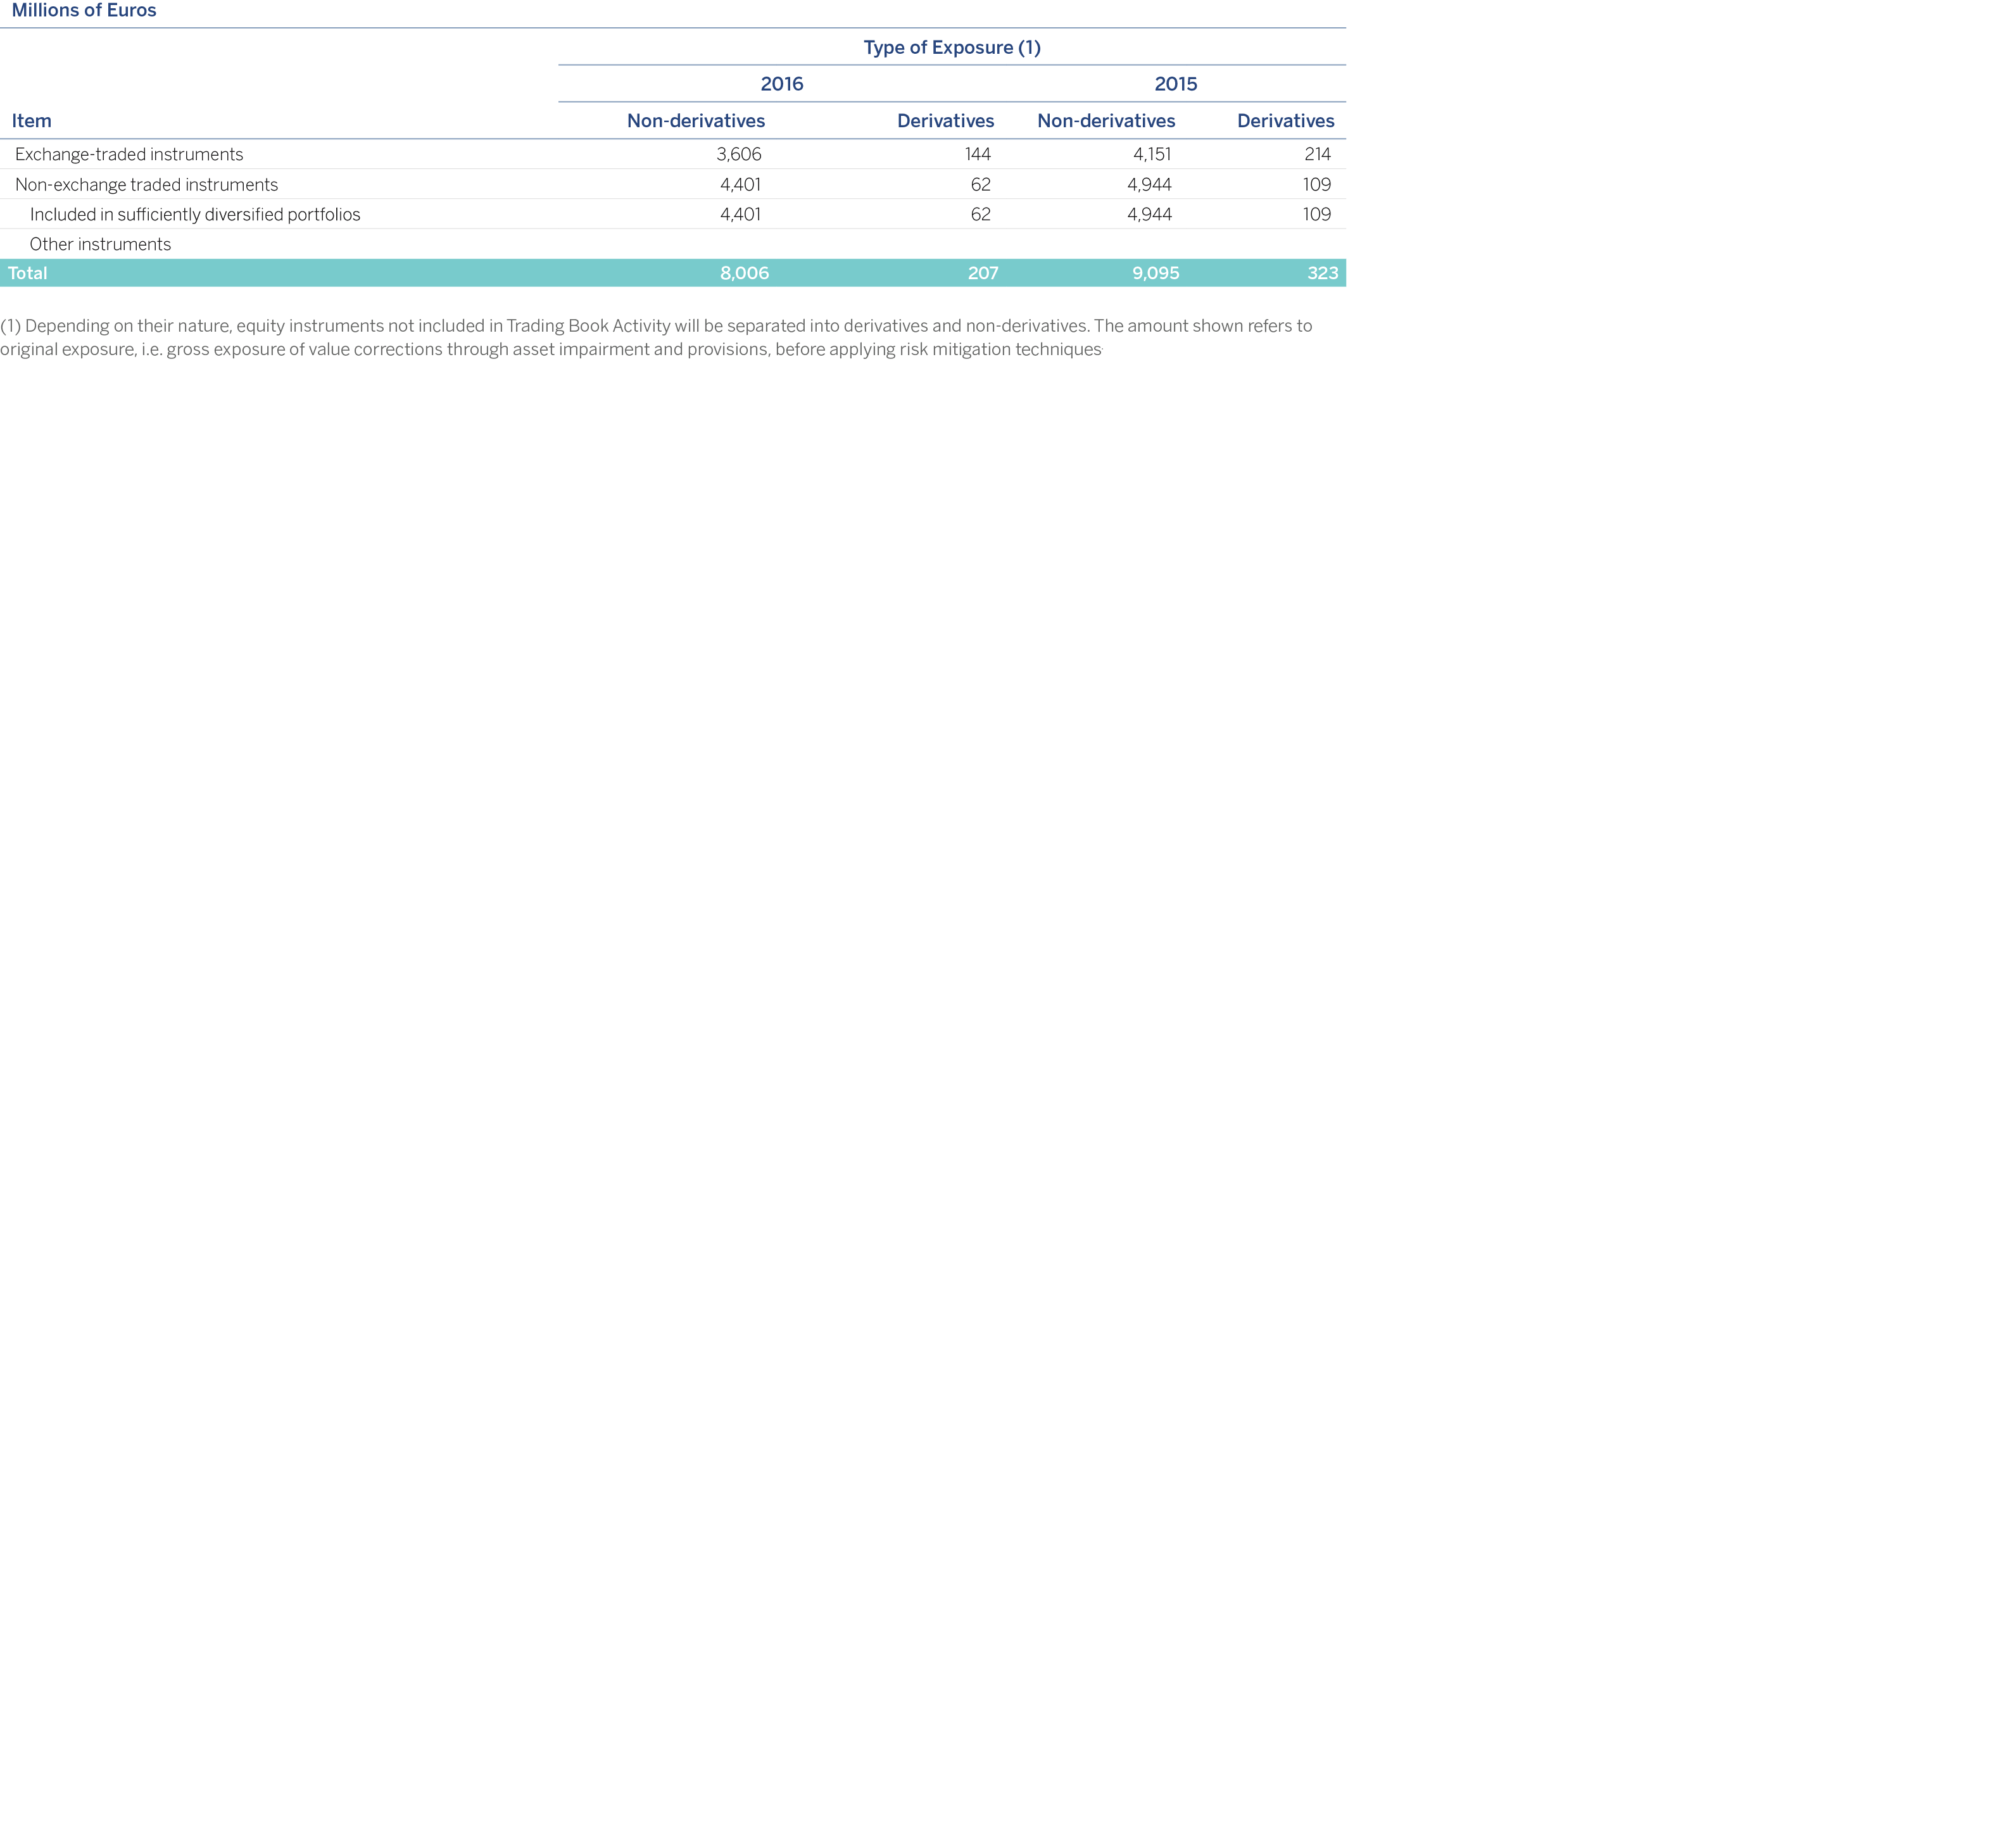
Below is a breakdown of the RWAs by applicable method corresponding to equity investments and capital instruments as of December 31, 2016 and December 31, 2015:
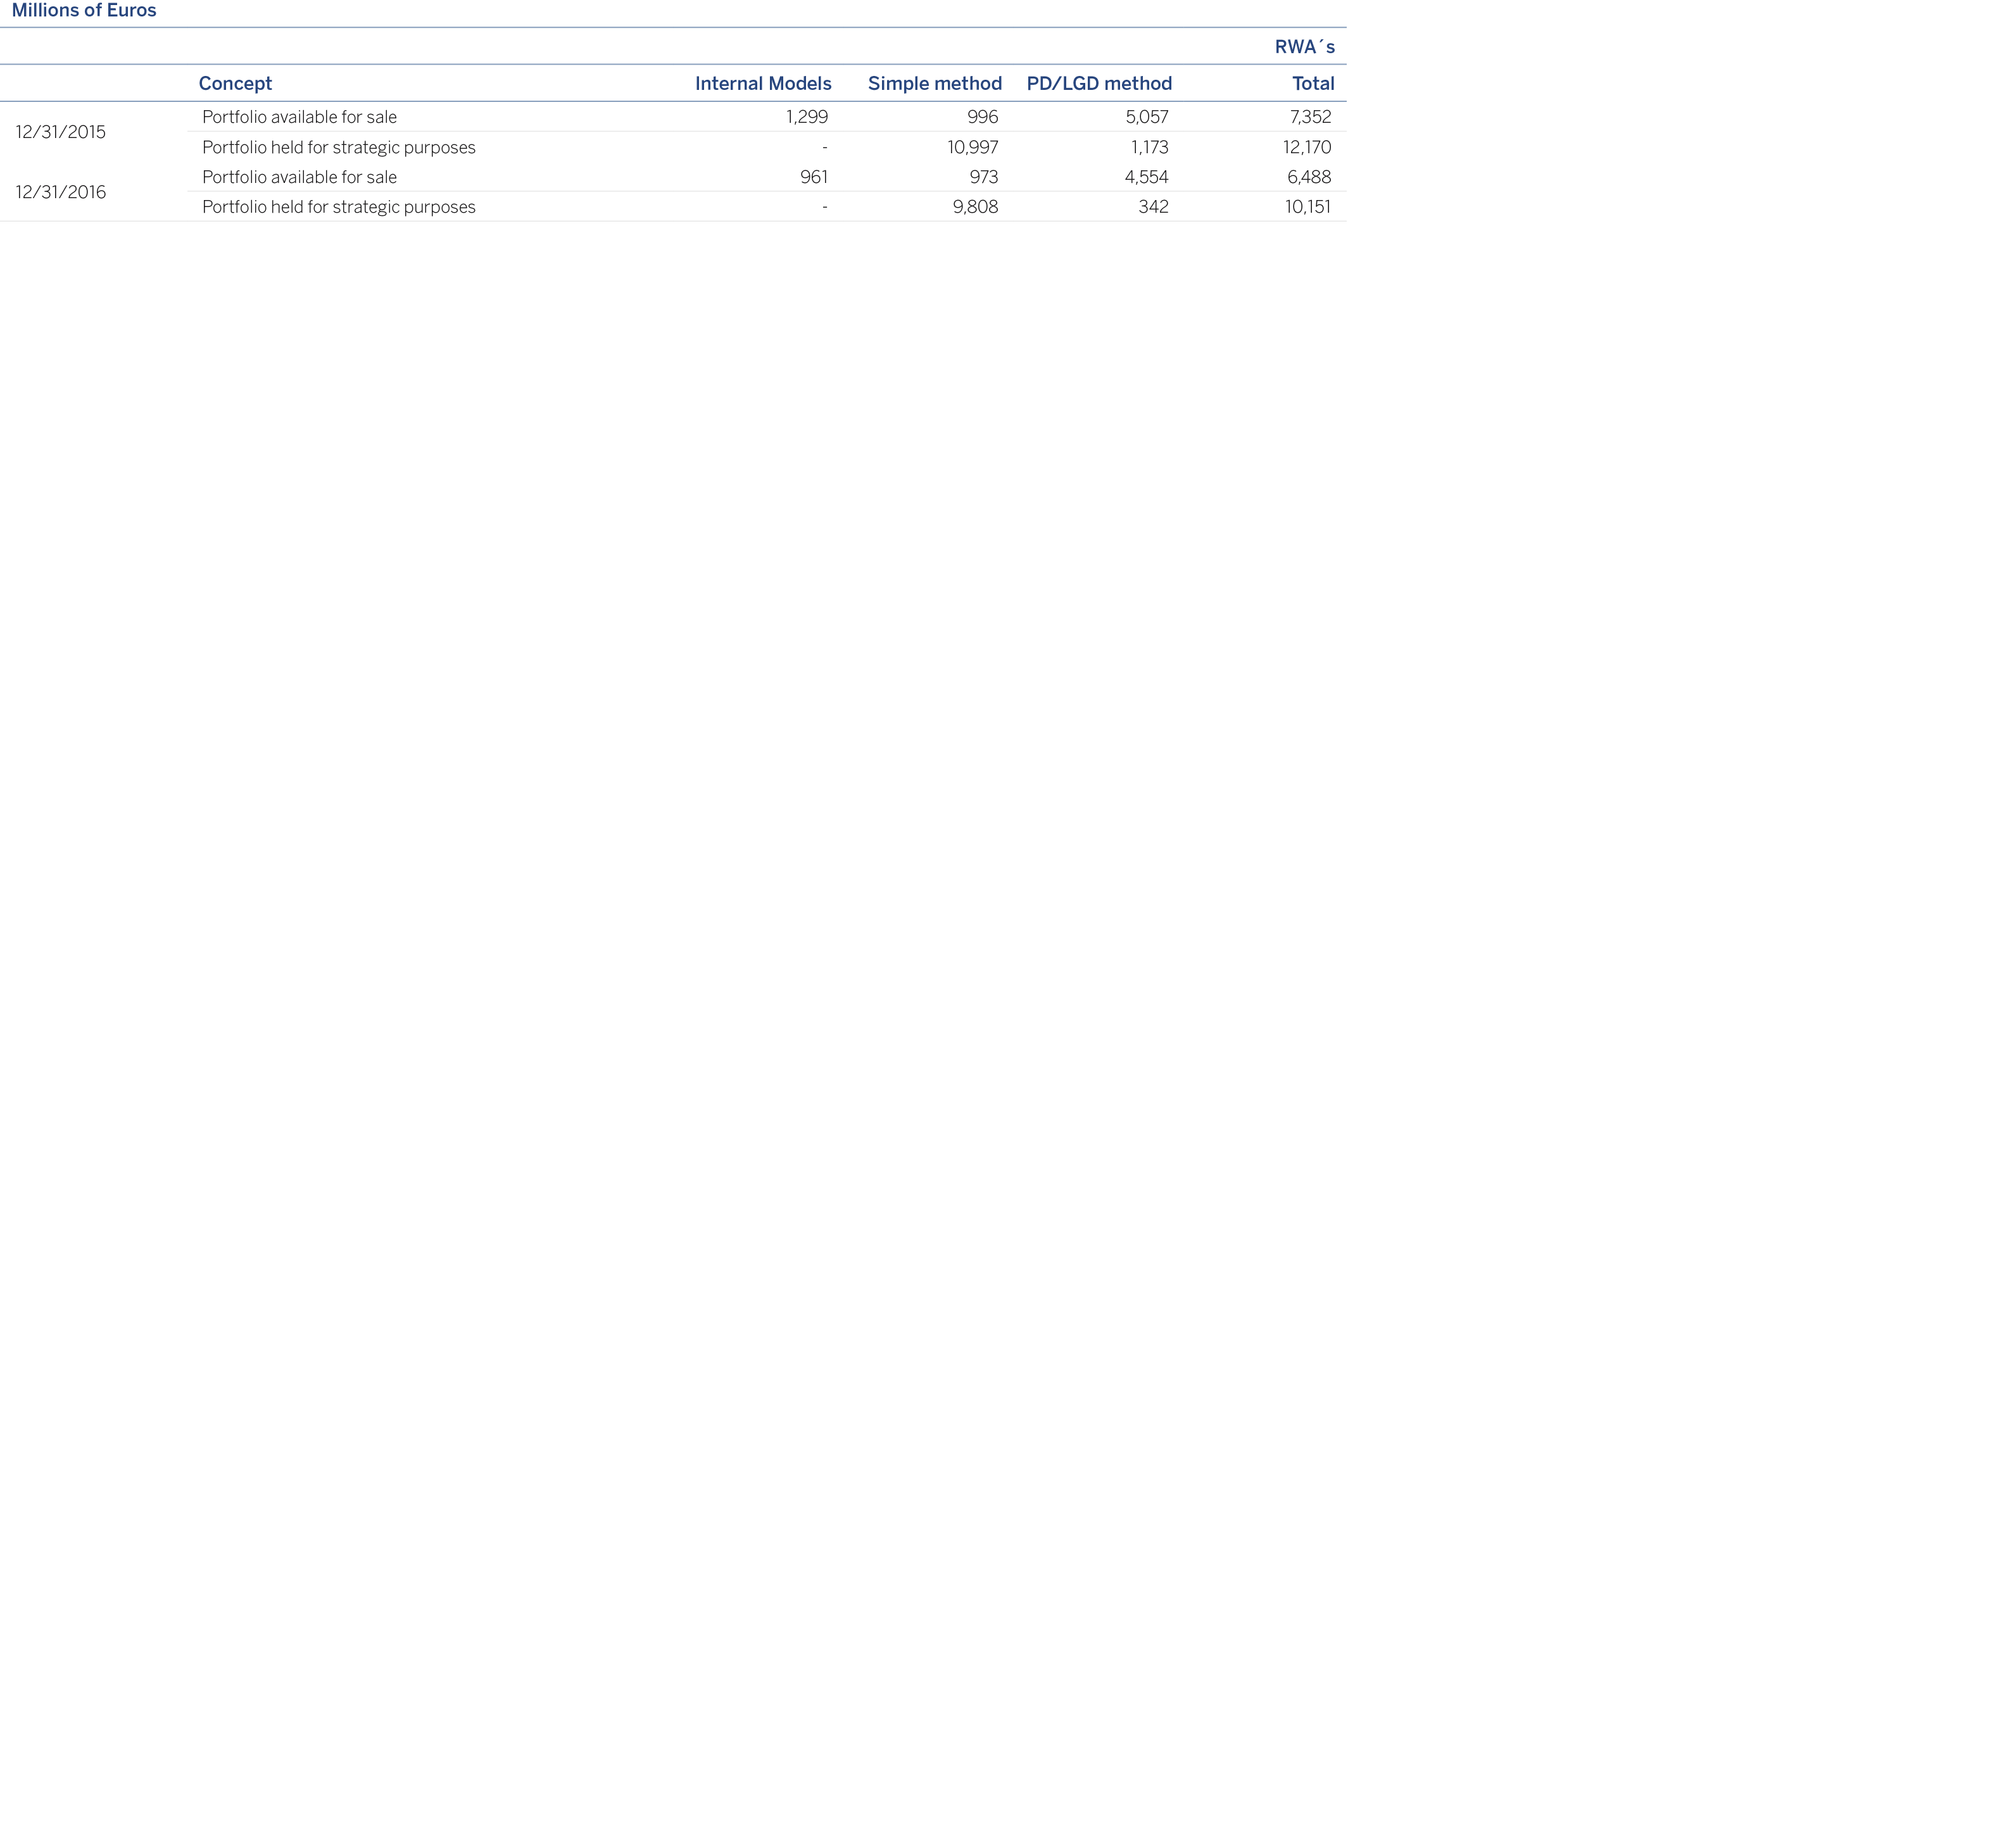
The flows and main changes in capital use are described below for the positions subject to Equity Credit Risk as of December 31, 2016:

The variations in the period occurred for the following reasons:
Exposure: Derived from the mark-to-market fluctuations of the DPV portfolio.
Acquisitions and disposals: Throughout 2016 partial sale of the BBVA Group stake in CNCB has continued.
Exchange rate: The negative variation of the exchange rate can be explained by the impact of the general depreciation of certain local currencies such as the Turkish lira, Mexican and Argentinean peso and the Venezuelan bolivar against the euro.
Below is a breakdown as of December 31, 2016 and December 31, 2015 of the profit and loss through the sale and settlement of equity investments and capital instruments and by type of portfolio applicable.
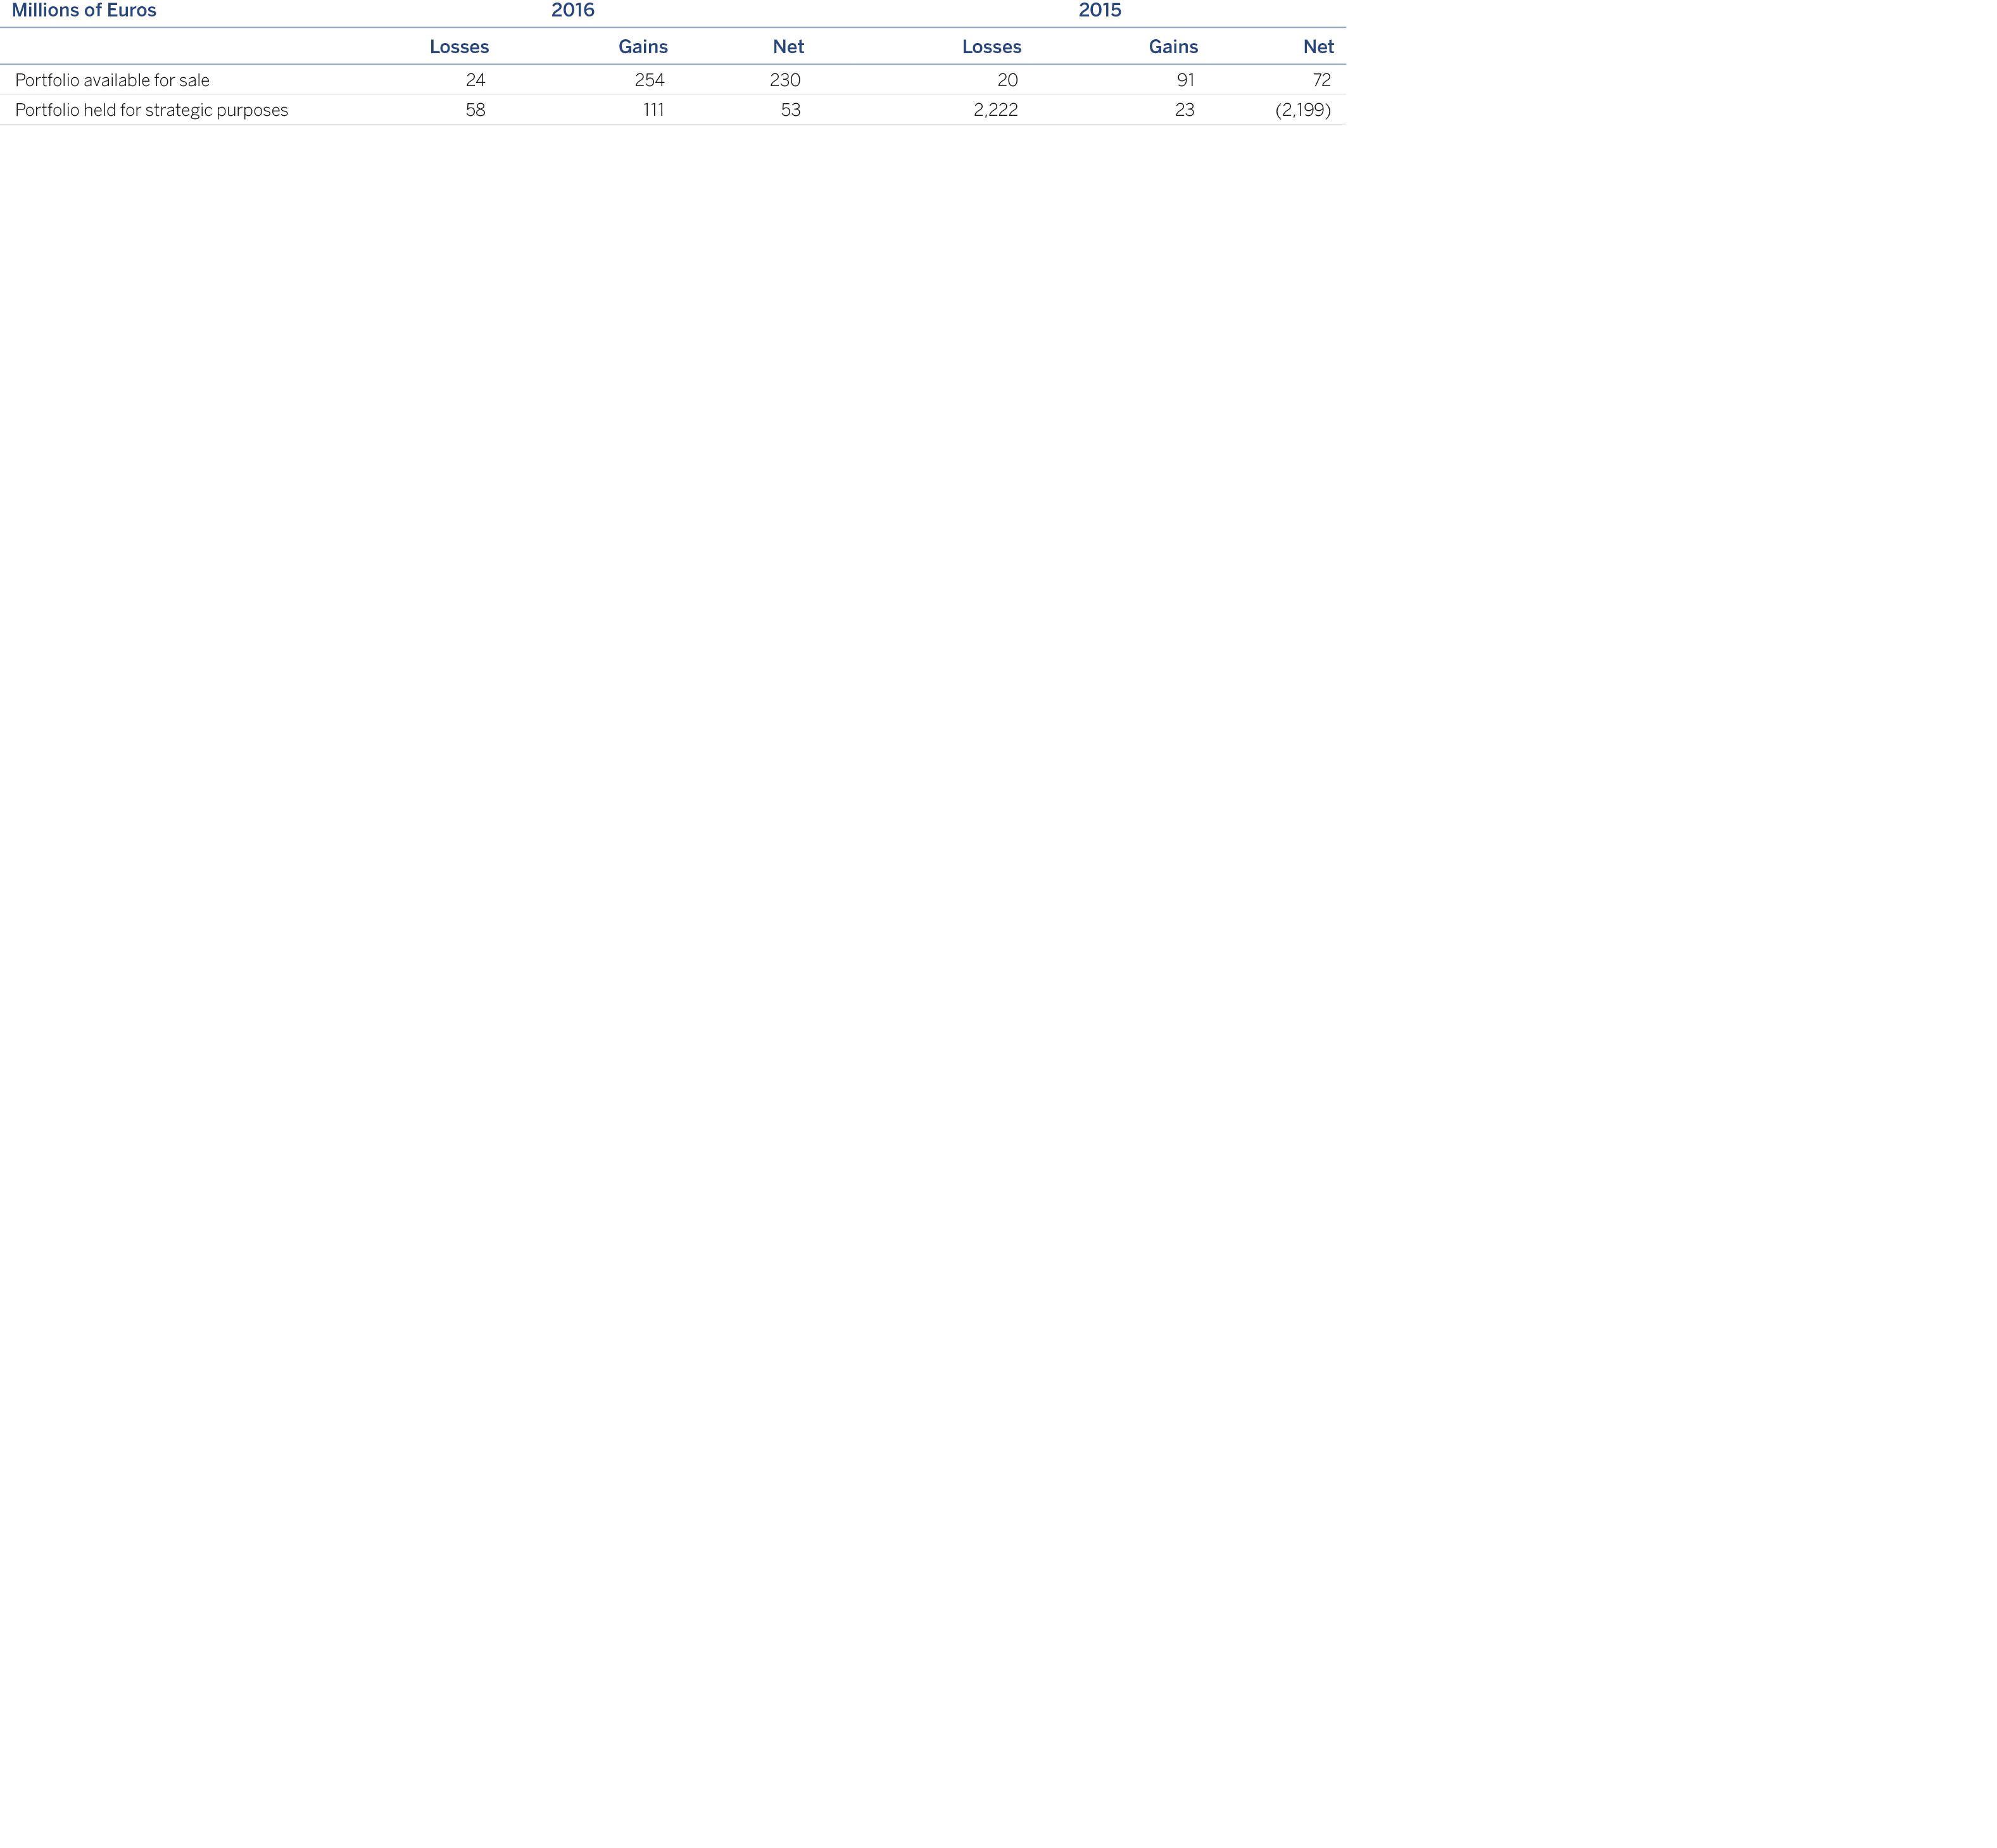
In 2015, the realized losses basically corresponded to the valuation at fair value of the stake held in the Garanti Group due to the change of the method of consolidation.

In BBVA Group, structural currency risk arises mainly from the consolidation of holdings in subsidiaries with functional currencies other than the euro. Its management is centralized in order to optimize the joint handling of permanent foreign currency exposures, taking into account the diversification.
The GRM corporate area acts as an independent unit that is responsible for monitoring and analyzing risks, standardizing risk management metrics and providing tools that can anticipate potential deviations from targets.
It also monitors the level of compliance of established risk limits, and reports regularly to the Global Risk Management Committee (GRMC), the Board of Directors' Risks Committee and the Executive Committee, particularly in the case of deviation or tension in the levels of risk assumed.
The Corporate Balance Sheet Management unit, through ALCO, designs and executes the hedging strategies with the main purpose of controlling the potential negative effects of exchange-rate fluctuations on capital ratios, as well as assuring the equivalent value in euros of the foreign-currency earnings of the Group's subsidiaries, considering the transactions according to market expectations and their costs.
The risk tracking metrics in the limits are integrated in the management and supplemented with additional evaluation indicators. Within the corporate scope, they are based on probabilistic metrics that measure the maximum deviation in capital, CET1 (“Common Equity Tier 1”) ratio, and attributable profit. Probabilistic metrics enable an estimation of the overall impact of the exposure on the various currencies, considering the broad variability in listed currencies and their correlations.
The goodness of fit of these metrics on the risk estimate is regularly reviewed through backtesting exercises. A structural exchange-rate risk control is supplemented with an analysis of scenarios and stress with a view to proactively identifying possible future threats to the future compliance of risk appetite levels to enable the adoption, as the case may be, of the pertinent preventive actions. The scenarios are based on historical and risk model-simulated situations, and the risk scenarios provided by BBVA Research.
The level of exposure to structural currency risk at the Group has decreased since the end of 2015 mainly due to the increase in hedging, focused on the Mexican peso and Turkish lira. The risk mitigation level of the capital adequacy ratio by the carrying amount of BBVA Group's holdings in foreign currency has remained at around 70% and the hedging for management purposes of foreign-currency earnings amounted to 47% for 2016, likewise focused on the Mexican peso and Turkish lira. Sensitivity of the CET1 ratio to a 1% appreciation in the euro's exchange rate against each foreign currency is: US dollar: +1.2 pbs; Mexican peso -0.2 pbs; Turkish lira -0.2 pbs; remaining currencies: -0.3 pbs.
The variations in terms of RWAs are due to the trend in structural positions and increased hedging on those positions.
Below is a visual display of the changes in the main currencies that make up the Group's structural exchange-rate risk and that explain the trends in the exposure and RWAs of foreign companies due to the effect of changing currency prices.

With respect to the markets, in 2016 the dollar and currencies of the Andean countries were strong, and in contrast the Mexican peso and Turkish lira depreciated against the dollar, affected by greater uncertainty and doubts about growth expectations in these economies./p>
The aim of managing balance-sheet interest rate risk is to maintain BBVA Group's exposure to variations in interest rates at levels in line with its strategy and target risk profile.
Movements in interest rates lead to changes in a bank’s net interest income and book value, which constitute a key source of asset and liability interest-rate risk.
The extent of these impacts will depend on the bank's exposure to changes in interest rates. This exposure is mainly the result of the time difference between the different maturity and repricing terms of the assets and liabilities on the banking book and the offbalance-sheet positions.
A financial institution’s exposure to adverse changes in market rates is a risk inherent in the banking business, while at the same time representing an opportunity to generate value. That is the reason why the structural interest rate should be managed effectively and have a reasonable relation both to the bank's capital base and the expected economic result. This function is handled by the Global ALM unit, within Financial Management area. Through the Asset and Liability Committee (ALCO) it aims to guarantee the generation of recurrent earnings and preserve the entity's solvency.
In pursuance of this, the ALCO develops strategies based on its market expectations, within the risk profile defined by BBVA Group's management bodies and balance the expected results and the level of risk assumed.
BBVA has a transfer pricing system, which centralizes the Bank’s interest-rate risk on ALCO’s books and is designed to facilitate proper balance-sheet risk management.
The corporate GRM area is responsible for controlling and monitoring structural interestrate risk, acting as an independent unit to guarantee that the risk management and control functions are properly segregated. This policy is in line with the Basel Committee on Banking Supervision recommendations. It constructs the asset and liability interest-rate risk measurements used by the Group's management, as well as designing models and measurement systems and developing monitoring, information and control systems. At the same time, the Global Risk Management Committee (GRMC) carries out the function of risk control and analysis reporting to the main governing bodies, such as the Executive Committee and the Board of Director’s Risk Committee.
BBVA's structural interest-rate risk management procedure has a sophisticated set of metrics and tools that enable its risk profile to be monitored precisely. This model is based on a carefully studied set of hypotheses which aim to characterize the behavior of the balance sheet exactly. The measurement of interest-rate risk includes probabilistic metrics, as well as a calculation of sensitivity to a parallel movement of +/- 100 basis points in the market curves.
There is regular measurement of the Bank's banking book earnings at risk (EaR) and economic capital, defined as the maximum adverse deviations in net interest income and economic value, respectively, for a particular confidence level and time horizon.
The deviations are obtained by applying a method for simulating interest-rate curves that takes into account other sources of risk in addition to changes in direction, such as changes in the slope and curvature, as well as considering the diversification between currencies and business units. The model is subject to regular internal validation, which includes backtesting.
The risk measurement model is supplemented by analysis of specific scenarios and stress tests. Stress tests have taken on particular importance in recent years. Progress has therefore been made in the analysis of extreme scenarios in a possible breakthrough in both current interest-rate levels and historical correlations and volatility. At the same time, the evaluation of scenarios forecast by the Economic Research Department has been maintained.
The Group’s exposure to variations in market interest rates is one of the main financial risks linked to the pursuit of its banking operations.
The risk of repricing, which stems from the difference between the periods for reviewing interest rates or the maturity of investment transactions vis-à-vis their financing, constitutes the basic interest rate risk to be considered. Nonetheless, other risks such as the exposure to changes in the slope and shape of interest rate curves and the risk of optionality present in certain banking transactions are also taken into consideration by risk control mechanisms.
The sensitivity measurements of the Group’s net interest income and economic value in the face of variations in market interest rates are supplemented with forecast and stress scenarios and risk measurements using curve simulation processes, thereby allowing an assessment of the impact of changes on the slope, curvature and parallel movements of varying magnitude.
Especially important in the measurement of structural interest rate risk, which is carried out every month, is the establishment of hypotheses on the evolution and performance of certain items on the balance sheet, especially those involving products with no explicit or contractual due date.
The most significant of these hypotheses are those established on current and savings accounts, since they largely condition risk levels given the volume they represent within the liabilities of the Group’s financial institutions.
A prior step to the study of these liabilities necessarily involves “account segmentation.” To do so, the balances on the balance sheet are broken down by products, analyzed separately and subsequently grouped according to their common features, especially with regard to the type of customer and the criteria on the remuneration of each account, independently of the accounting standards on grouping.
A first stage involves analyzing the relationship between the trends in market interest rates and the interest rates of those accounts with no contractual due date. This relationship is established by the models which allow a determination of what the percentage impact of the variations in market interest rates is on the account’s remuneration and with what delay it occurs, for each type of account and customer and according to the interest-rate levels.
Subsequently, an analysis is made of the changes over time of the balances in each category in order to establish their overall trend against the seasonal variations in the balance. It is assumed that these seasonal variations mature in the very short term, whereas the trend in the balance is assigned a long-term maturity. This prevents oscillations in the level of risks caused by momentary variations in balances, thus favoring the stability of balance-sheet management. This breakdown of amounts is made by the regressions that best adjust historical changes to the balance over time.
Group companies have opted for different procedures to determine the maturity of transactional liabilities, taking into account the varying nature of markets and the availability of historical data. In the corporate model, a descriptive analysis of the data is used to calculate the average contractual period of the accounts and the conditioned probability of maturity for the life cycle of the product. A theoretical distribution of maturities of the trend balance is then estimated for each of the products, based on the average life of the stock and the conditioned probability.
A further aspect to be considered in the model’s hypotheses is the analysis of the prepayments (implicit optionality) associated with certain positions, especially with the loanbook, mortgage portfolios and customer deposits. Changes in market interest rates, together with other variables, condition the incentives for the Bank’s customers to cancel loans or deposits early, thus modifying the future behavior of the balances on the balance sheet with respect to forecasts in accordance with the contractual calendar of maturities.
The analysis of historical information relating to prepayments, and to changes in interest rates, establishes the relationship between the two at any particular moment and estimates future prepayment in a given interest-rate scenario.
The following tables present the average levels of interest-rate risk in terms of the sensitivity of net interest income and economic value for the Group’s main financial institutions in 2016.
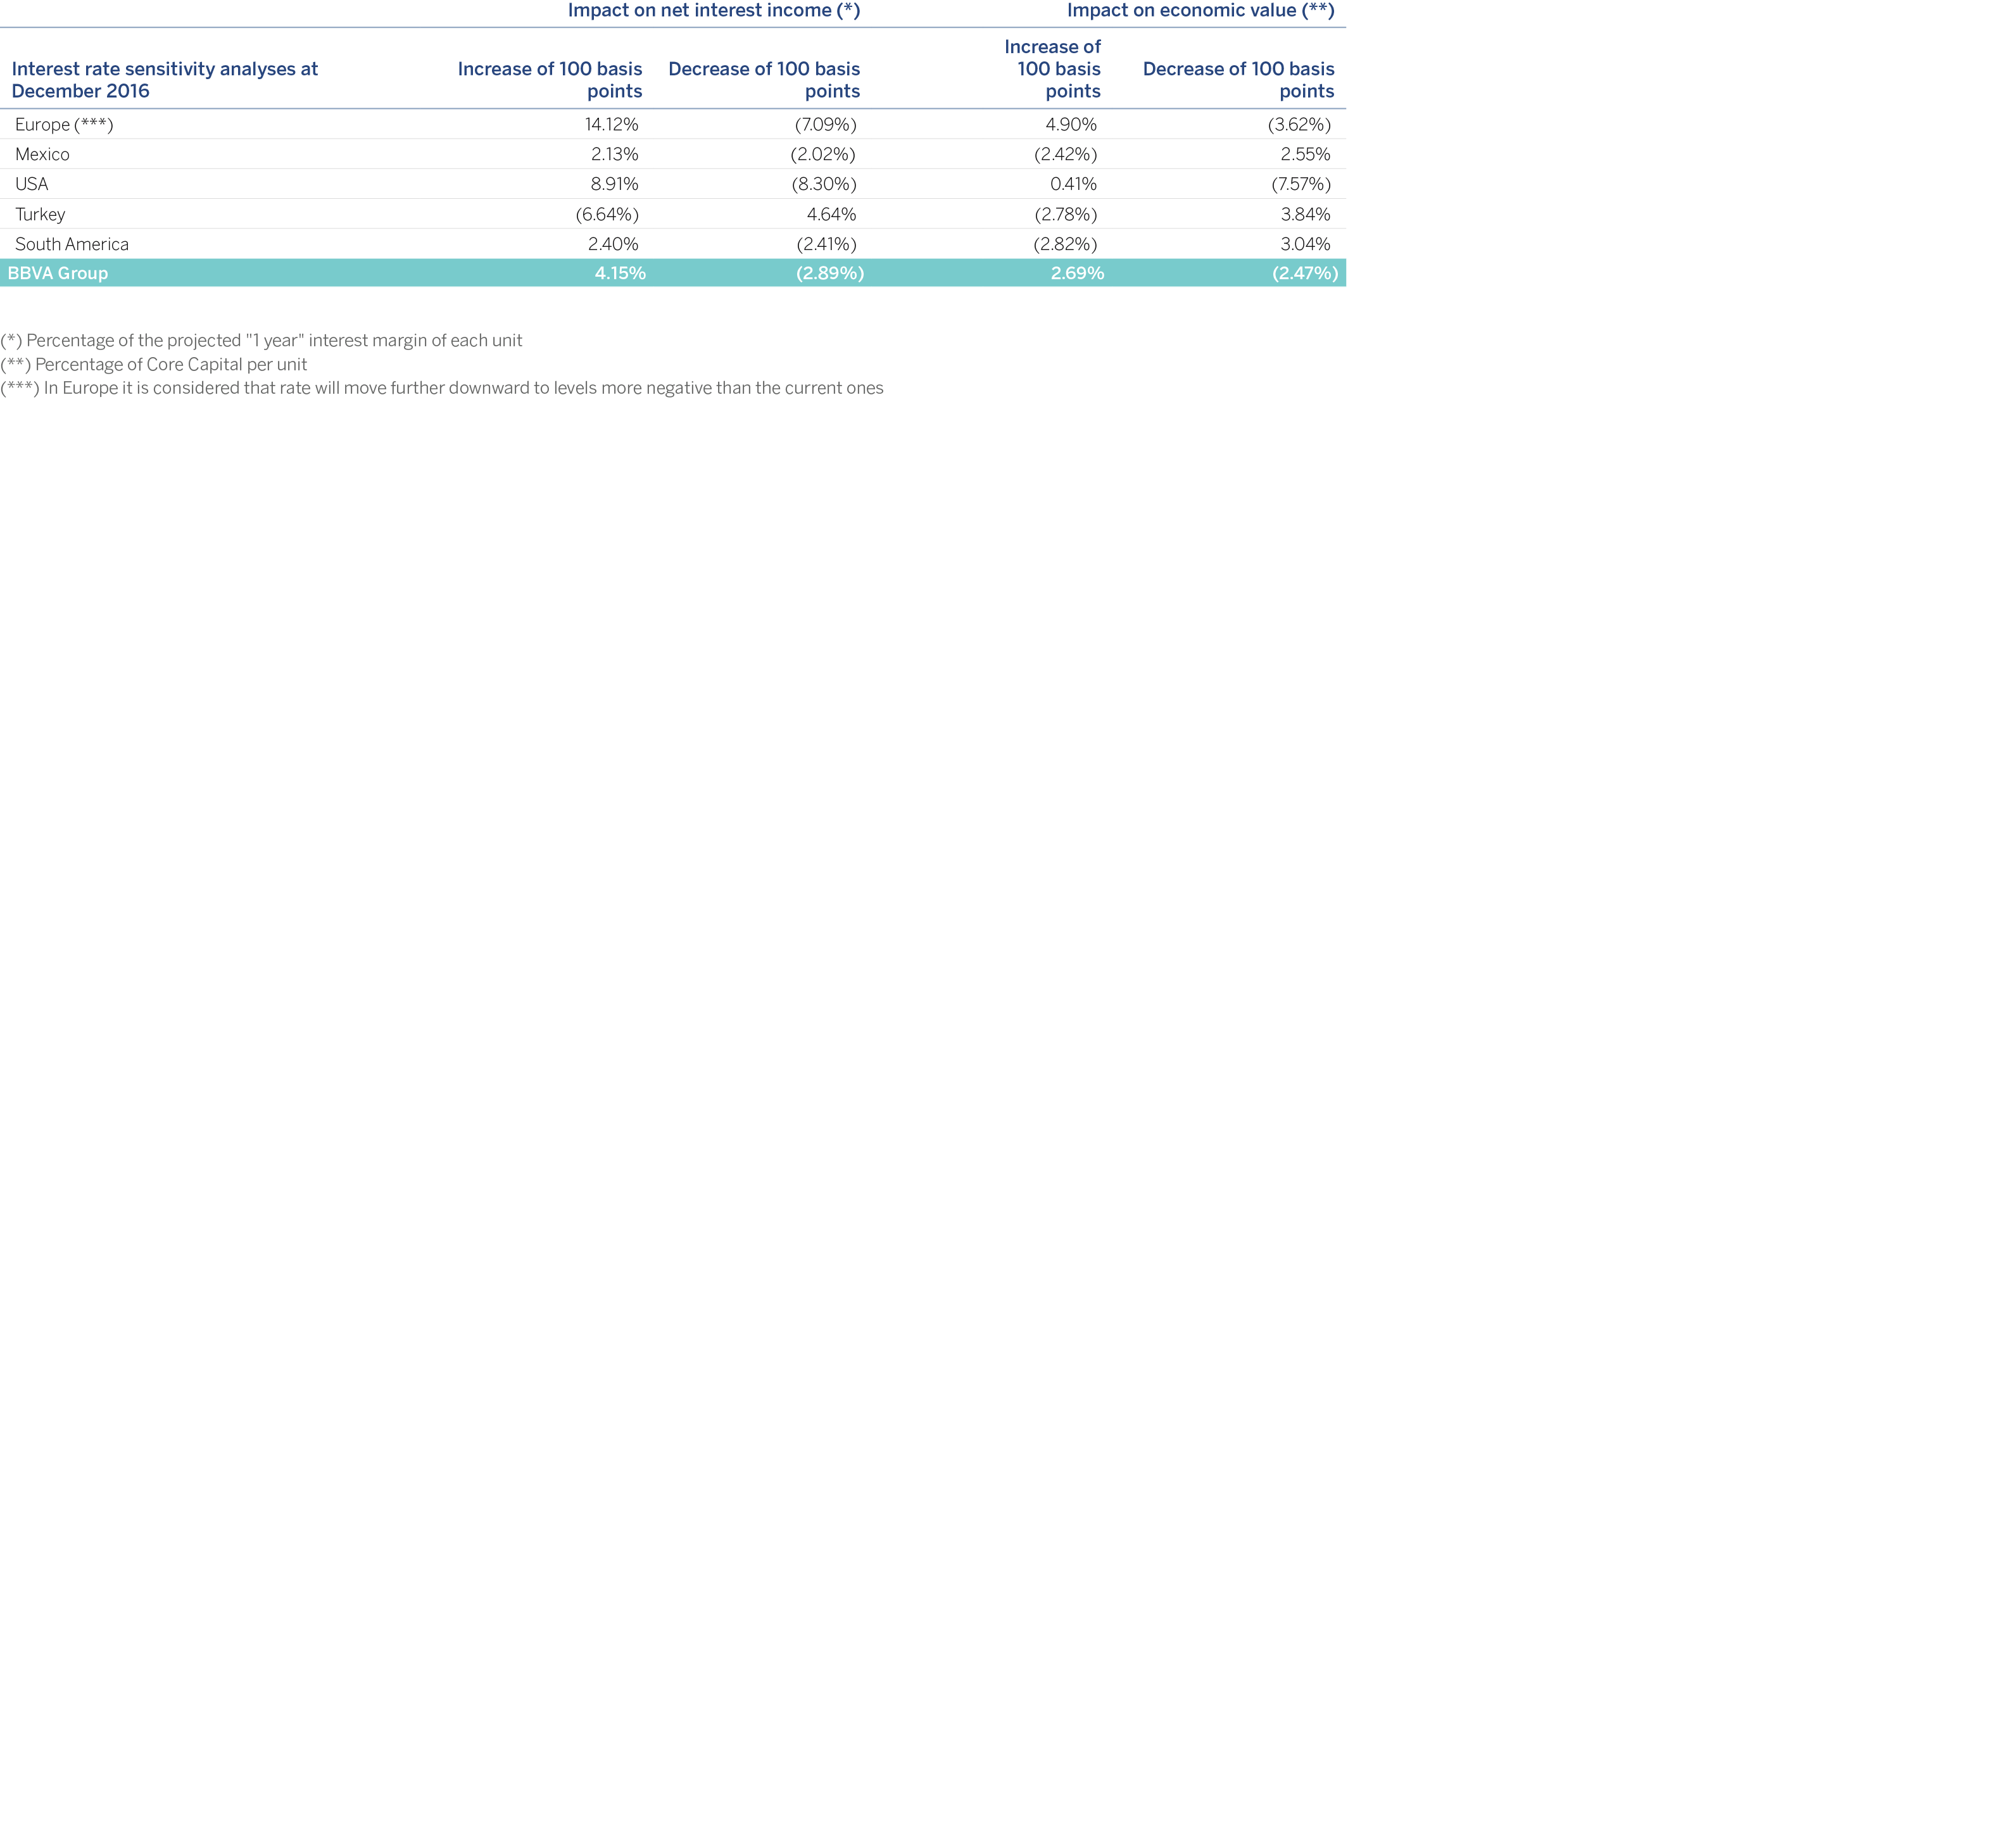
The BBVA Group's balance has negative exposure to a fall in interest rates caused primarily by balances in euros and USD.
However, in Europe, the movement of falling rates is clipped as a result of the current interest rate level, which is very close to or even under zero, thus preventing the occurrence of extremely adverse scenarios. Contrariwise, the rise scenarios have a greater range, which generates a positive asymmetry in the potential results of the BBVA Group insofar as the rates.
Liquidity and funding risk management aims to ensure in the short term that a bank does not have any difficulties in duly meeting its payment commitments, and that it does not have to resort to funding under difficult conditions which may harm the bank's image or reputation.
In the medium term the aim is to ensure that the Group’s financing structure is ideal and that it is moving in the right direction with respect to the economic situation, the markets and regulatory changes. Management of structural funding and short-term liquidity is decentralized in BBVA Group.
Management of structural funding and liquidity within BBVA Group is based on the principle of financial self-sufficiency of the entities that make it up. This approach helps prevent and limit liquidity risk by reducing the Group’s vulnerability during periods of high risk.
This decentralized management prevents possible contagion from a crisis affecting only one or a few BBVA Group entities, which must act independently to meet their liquidity requirements in the markets where they operate.
As regards liquidity and funding management, BBVA Group is organized around twelve Liquidity Management Units (UGL) made up of the parent company and the banking subsidiaries in each geographical area, plus their dependent branches, even when these branches raise funding in different currencies.
BBVA Group's policy for managing liquidity and funding risk is also the basis of the model's robustness in terms of planning and integration of risk management into the budgeting process of each UGL, according to the appetite for funding risk it decides to assume in its business.
In order to implement this principle of anticipation, limits are set on an annual basis for the main management metrics that form part of the budgeting process for the liquidity balance. This framework of limits contributes to the planning of the joint evolutionary performance of:
The loan portfolio, considering the types of assets and their degree of liquidity, as well as their validity as collateral in collateralized funding.
Stable customer funds, based on the application of a methodology for establishing which segments and customer balances are considered to be stable or volatile funds based on the principle of sustainability and recurrence of these funds.
The credit gap projection, in order to require a degree of self-funding that is defined in terms of the difference between the loan-book and stable customer funds.
Incorporating the planning of securities portfolios into the banking book, which include both fixed-interest and equity securities, and are classified as available-forsale or held-to-maturity portfolios, and additionally on trading portfolios.
The structural gap projection, as a result of assessing the funding needs generated both from the credit gap and by the securities portfolio in the banking book, together with the rest of on-balance-sheet wholesale funding needs, excluding trading portfolios. This gap therefore needs to be funded with customer funds that are not considered stable or on wholesale markets.
As a result of these funding needs, BBVA Group plans the target wholesale funding structure according to the tolerance set in each UGL target.
Thus, once the structural gap has been identified and after resorting to wholesale markets, the amount and composition of wholesale structural funding is established in subsequent years, in order to maintain a diversified funding mix and guarantee that there is not a high reliance on short-term funding (short-term wholesale funding plus volatile customer funds).
In practice, the execution of the principles of planning and self-funding at the different UGLs results in the Group's main source of funding being customer deposits, which consist mainly of demand deposits, savings deposits and time deposits.
As sources of funding, customer deposits are complemented by access to the interbank market and the domestic and international capital markets in order to address additional liquidity requirements, implementing domestic and international programs for the issuance of commercial paper and medium and long-term debt.
The Finance area, through Global ALM, manages BBVA Group's liquidity and funding, planning and executing the funding of the structural long-term gap of each UGL and proposing to ALCO the actions to be taken on this matter, in accordance with the policies and limits established by the Executive Committee.
The Group's objective behavior, in terms of liquidity and funding risk, is measured through the Liquidity Coverage Ratio (LCR) and the Loan-to-Stable Customer Deposits (LtSCD) ratio.
The LCR ratio is a regulatory metric designed to guarantee the resistance of entities in a scenario of liquidity tension within a time horizon of 30 days. Within the plan for adapting risk management to regulatory ratios, BBVA has established a required Liquidity Coverage Ratio (LCR) compliance level for the entire Group and for each individual UGL. The required internal levels aim to comply efficiently and sufficiently in advance with the implementation of the 2018 regulatory requirement at a level above 100%.
Throughout 2016, the LCR level for BBVA Group remained above 100%. At European level the LCR ratio entered into force on October 1, 2015, with an initial requirement of 60%, and a phased-in ratio of up to 100% in 2018.
The Loan-to-Stable Customer Deposits (LtSCD) ratio measures the relationship between net lending and stable customer funds. The aim is to preserve a stable funding structure in the medium term for each UGL making up BBVA Group, taking into account that maintaining an adequate volume of stable customer funds is key to achieving a sound liquidity profile. These stable resources in each UGL are calculated by analyzing the performance of the balances in the different customer segments identified as eligible to provide stability to the funding structure; prioritizing customer loyalty and applying greater haircuts to the funding lines for less stable customers.
In order to establish the target (maximum) levels of LtSCD in each UGL and provide an optimal funding structure reference in terms of risk appetite, the corporate Structural Risks unit of GRM identifies and assesses the economic and financial variables that condition the funding structures in the different geographical areas.
The second element in liquidity and funding risk management aims to achieve a proper diversification of the funding structure, avoiding excessive reliance on short-term funding by establishing a maximum level of short-term funding raising, comprising wholesale funding and volatile customer funds.
The residual maturity profile of long-term wholesale funding has no significant concentrations, which matches the schedule of planned issues to the best possible financial conditions of markets, as shown in the chart below. Finally, concentration risk is monitored at UGL level, with the aim of ensuring a correct diversification of both the counterparty and type of instrument.
The third main element is promoting the short-term resistance of the liquidity risk profile, guaranteeing that each UGL has sufficient collateral to deal with the risk of the close of wholesale markets.
The basic capacity is the short-term liquidity risk management and control metric, which is defined as the ratio between the available explicit assets and the maturities of wholesale liabilities and volatile funds, at different terms, with special relevance being given to 30-day maturities.
Stress tests are carried out as a fundamental element of the liquidity and funding risk monitoring scheme. They enable deviations from the liquidity targets and limits set in the appetite to be anticipated, and establish tolerance ranges in the different management areas. They also play a major role in the design of the Liquidity Contingency Plan and the definition of specific measures to be adopted to rectify the risk profile if necessary.
For each scenario, it is verified whether the UGL has a sufficient stock of liquid assets to guarantee its capacity to meet the liquidity commitments/outflows in the different periods analyzed. Four scenarios are considered in the analysis: one central and three crisisrelated (systemic crisis; unexpected internal crisis with a considerable rating downgrade and/or affecting the ability to issue in wholesale markets and the perception of business risk by the banking intermediaries and the Entity's customers; and a mixed scenario, as a combination of the two aforementioned scenarios). Each scenario considers the following factors: the liquidity existing in the market, customer behavior and sources of funding, impact of rating downgrades, market values of liquid assets and collateral, and the interaction between liquidity requirements and the development of the UGL's asset quality.
Together with the results of the stress tests and the risk metrics, the early warning indicators play an important role within the corporate model and the Liquidity Contingency Plan. They are mainly indicators of the funding structure, in relation to asset encumbrance, counterparty concentration, flights of customer deposits, unexpected use of credit facilities, and of the market, which help anticipate possible risks and capture market expectations.
During 2016, BBVA Group has maintained a robust and dynamic funding structure with a clearly retail nature, where customer resources represent the main source of funding.
Thus, the performance of the indicators show that the robustness of the funding structure remained steady during 2016, in the sense that all UGLs held self-funding levels with stable customer resources above the requirements.
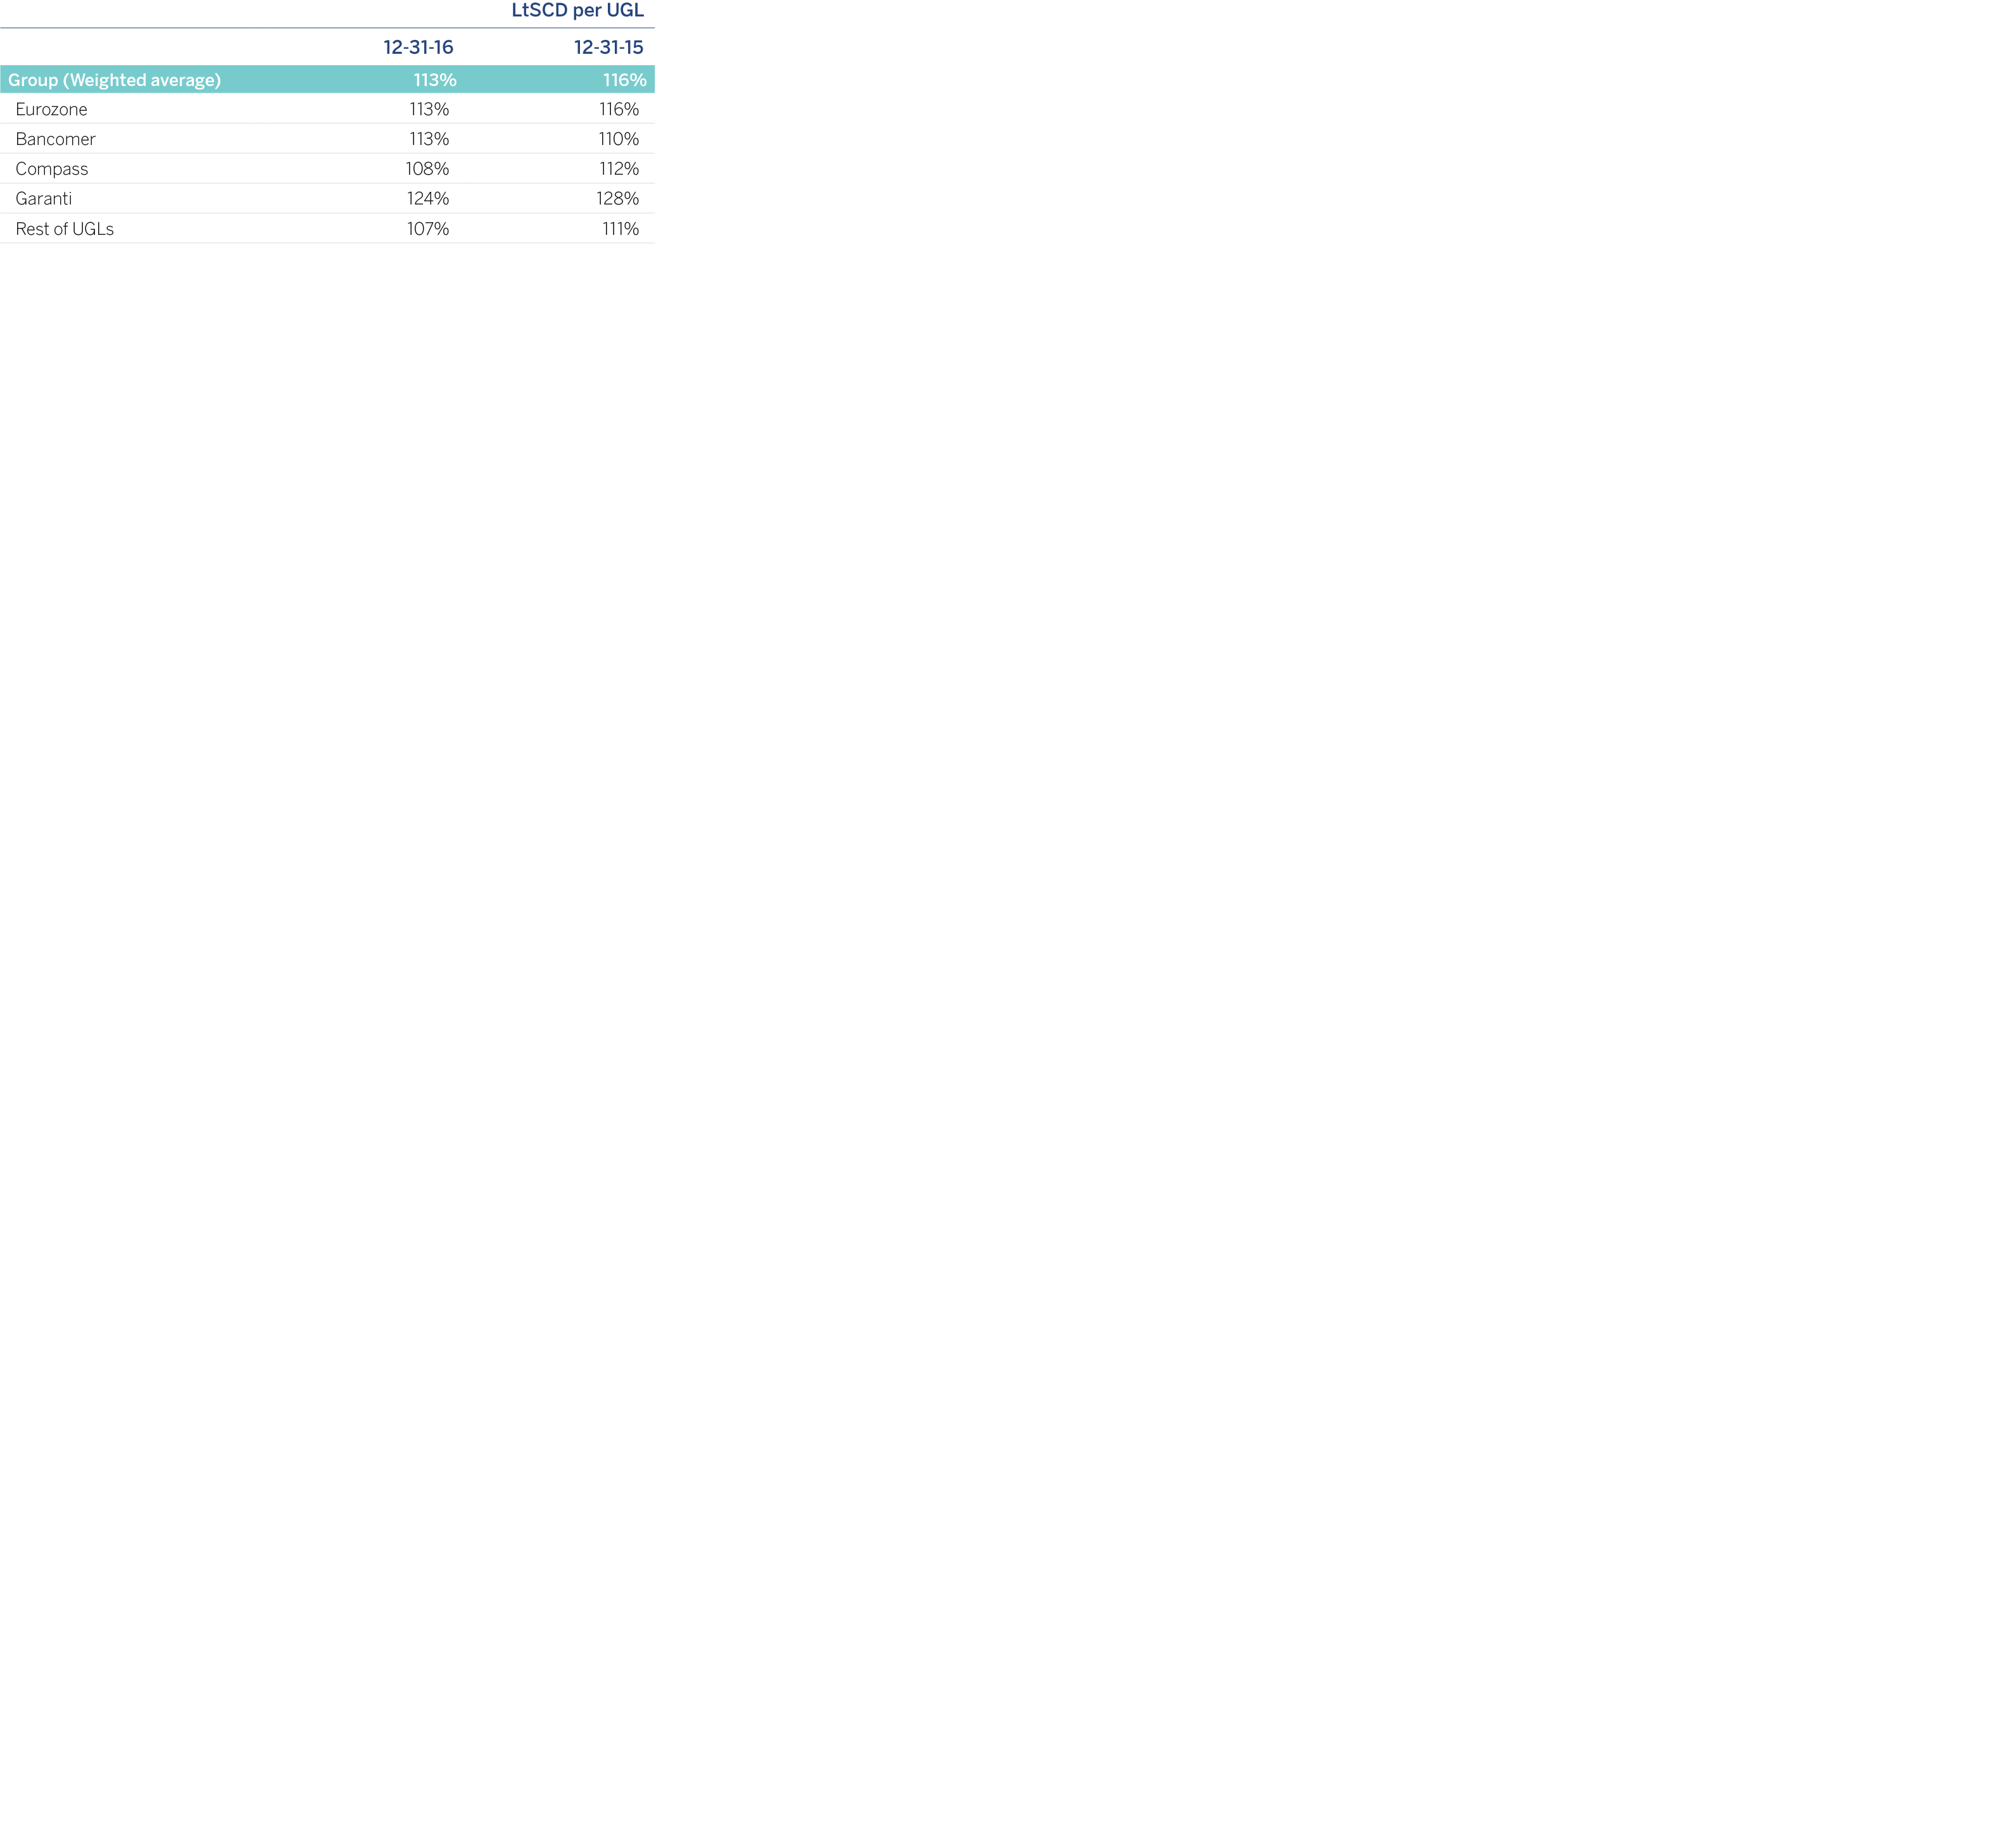
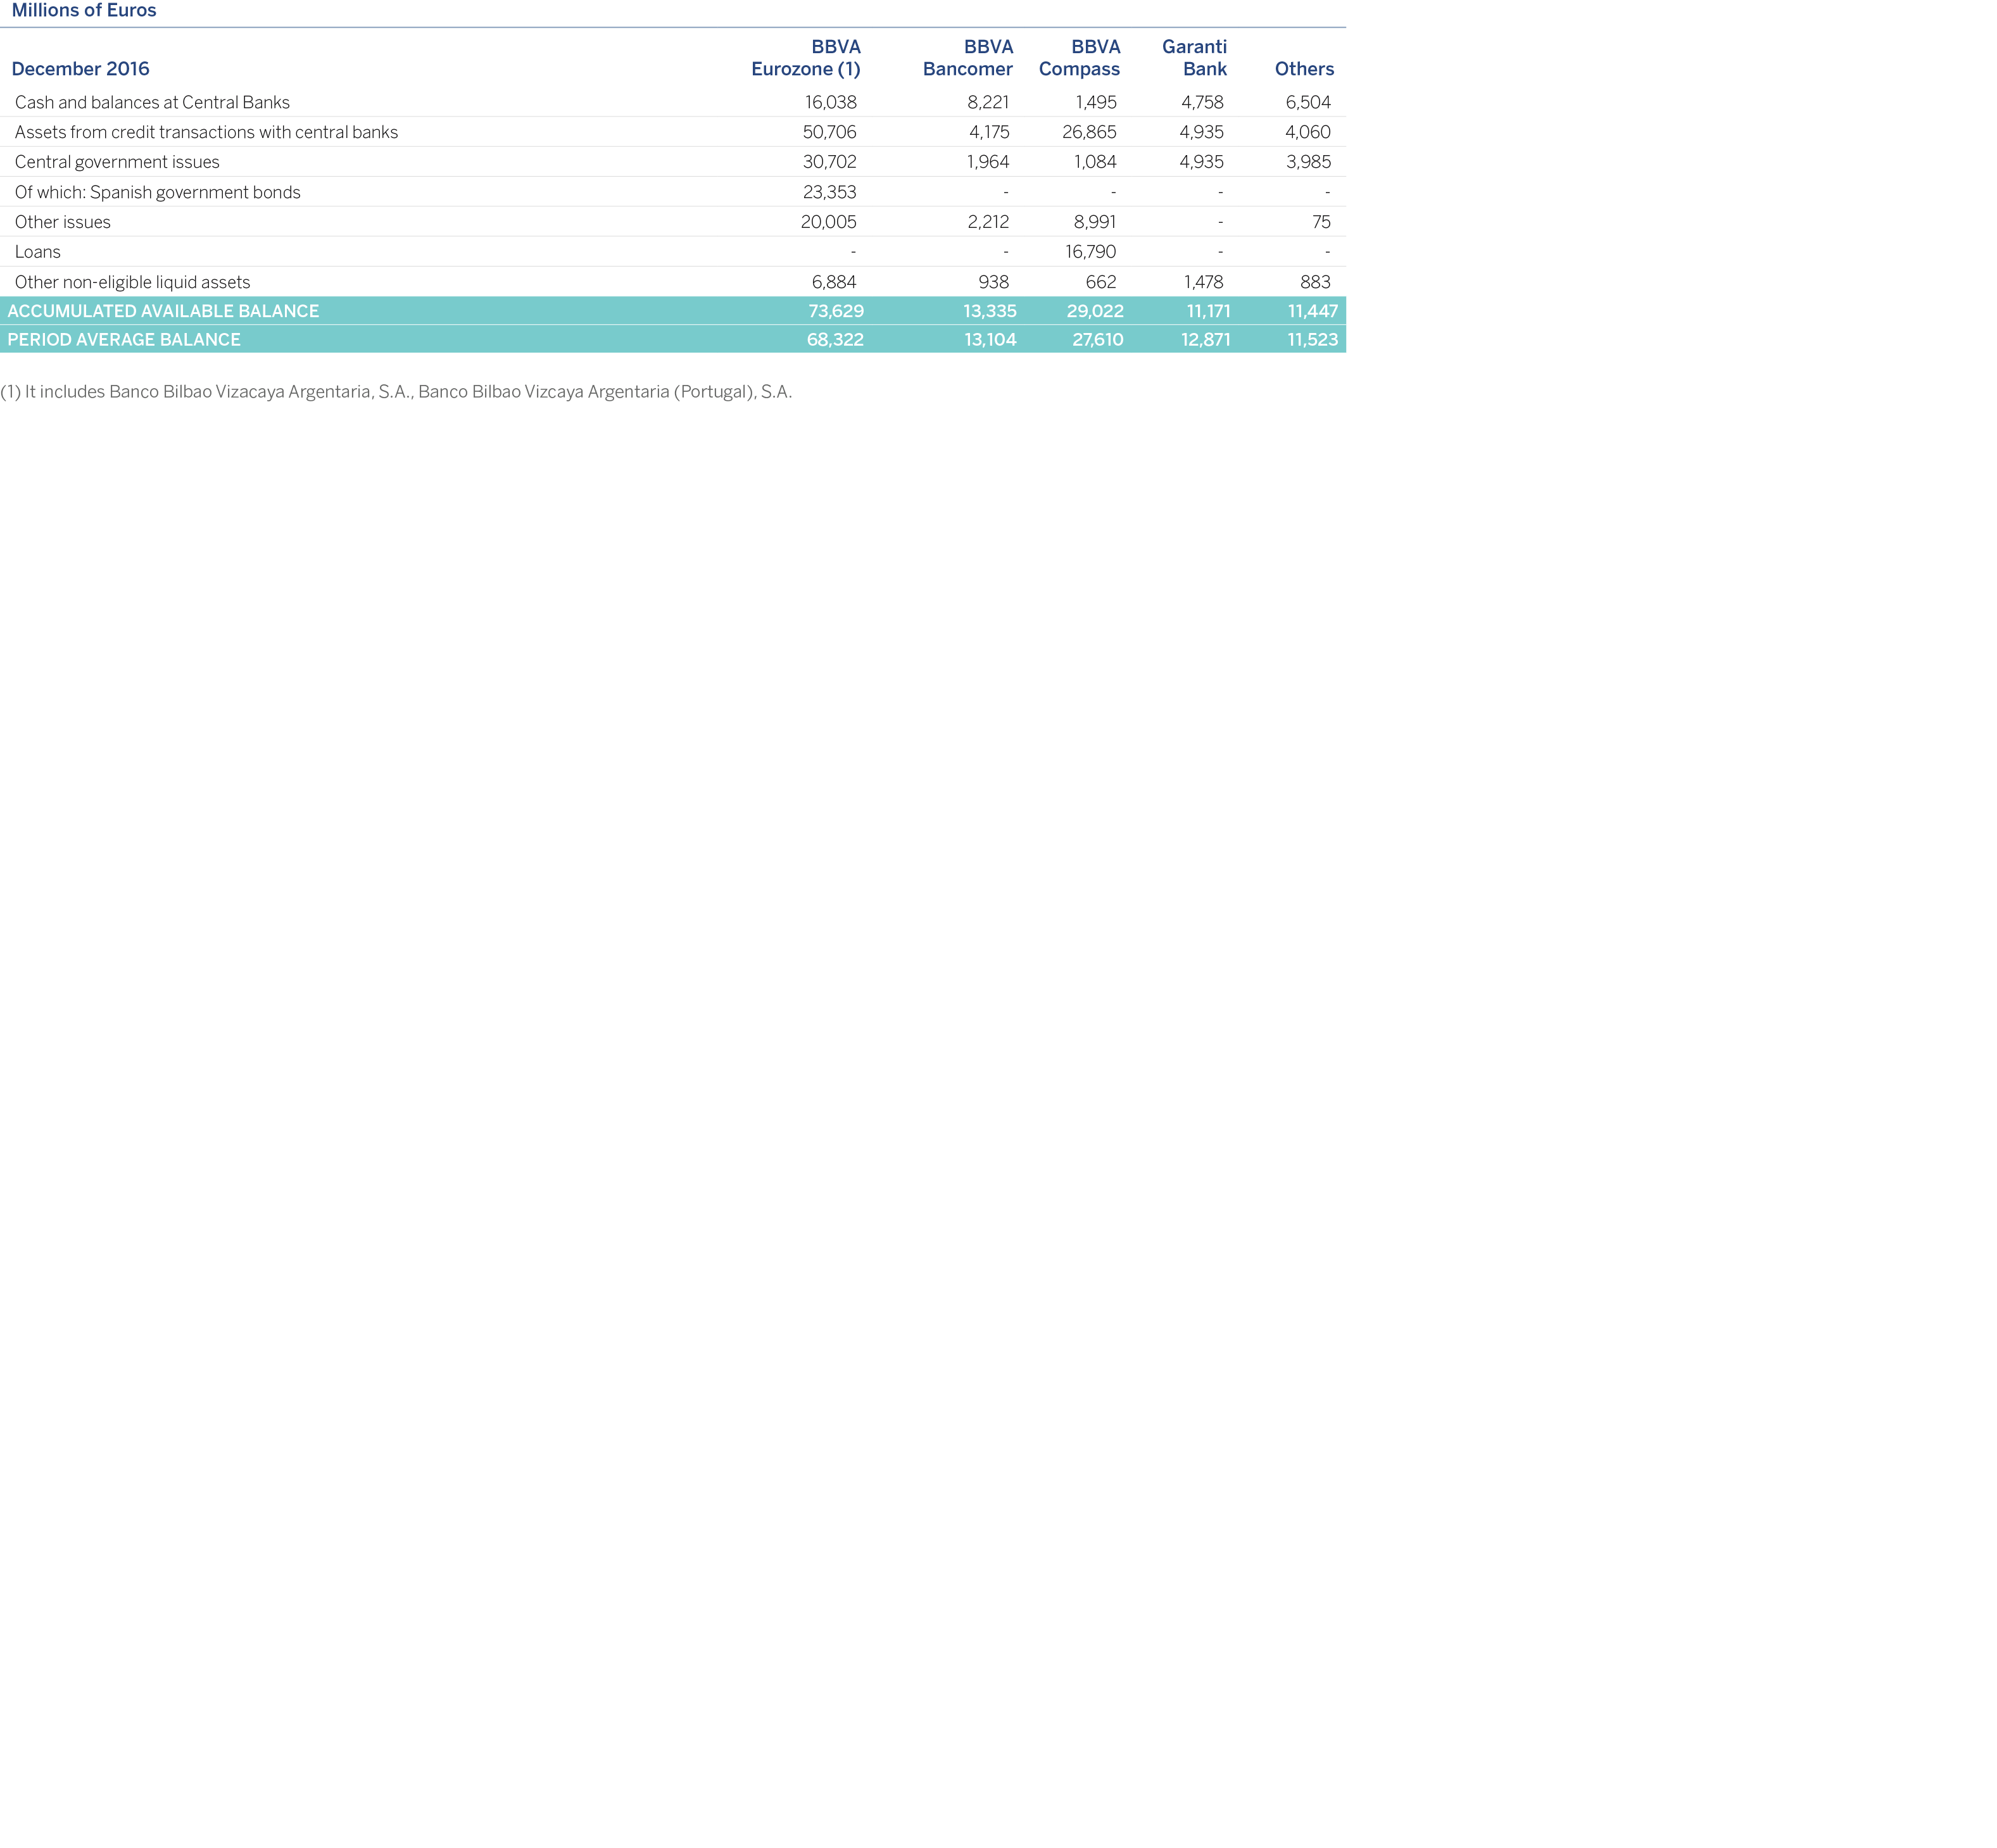
The stress tests conducted on a regular basis reveal that BBVA maintains a sufficient buffer of liquid assets (stress buffer) to deal with the estimated liquidity outflows in a scenario resulting from the combination of a systemic crisis and an unexpected internal crisis, during a period of longer than 3 months in general for the different UGLs, including in the scenario a significant downgrade of the Bank's rating by up to three notches.
Based on prudential supervisory information, the following matrix is presented by contractual terms with residual maturity as of December 31, 2016:
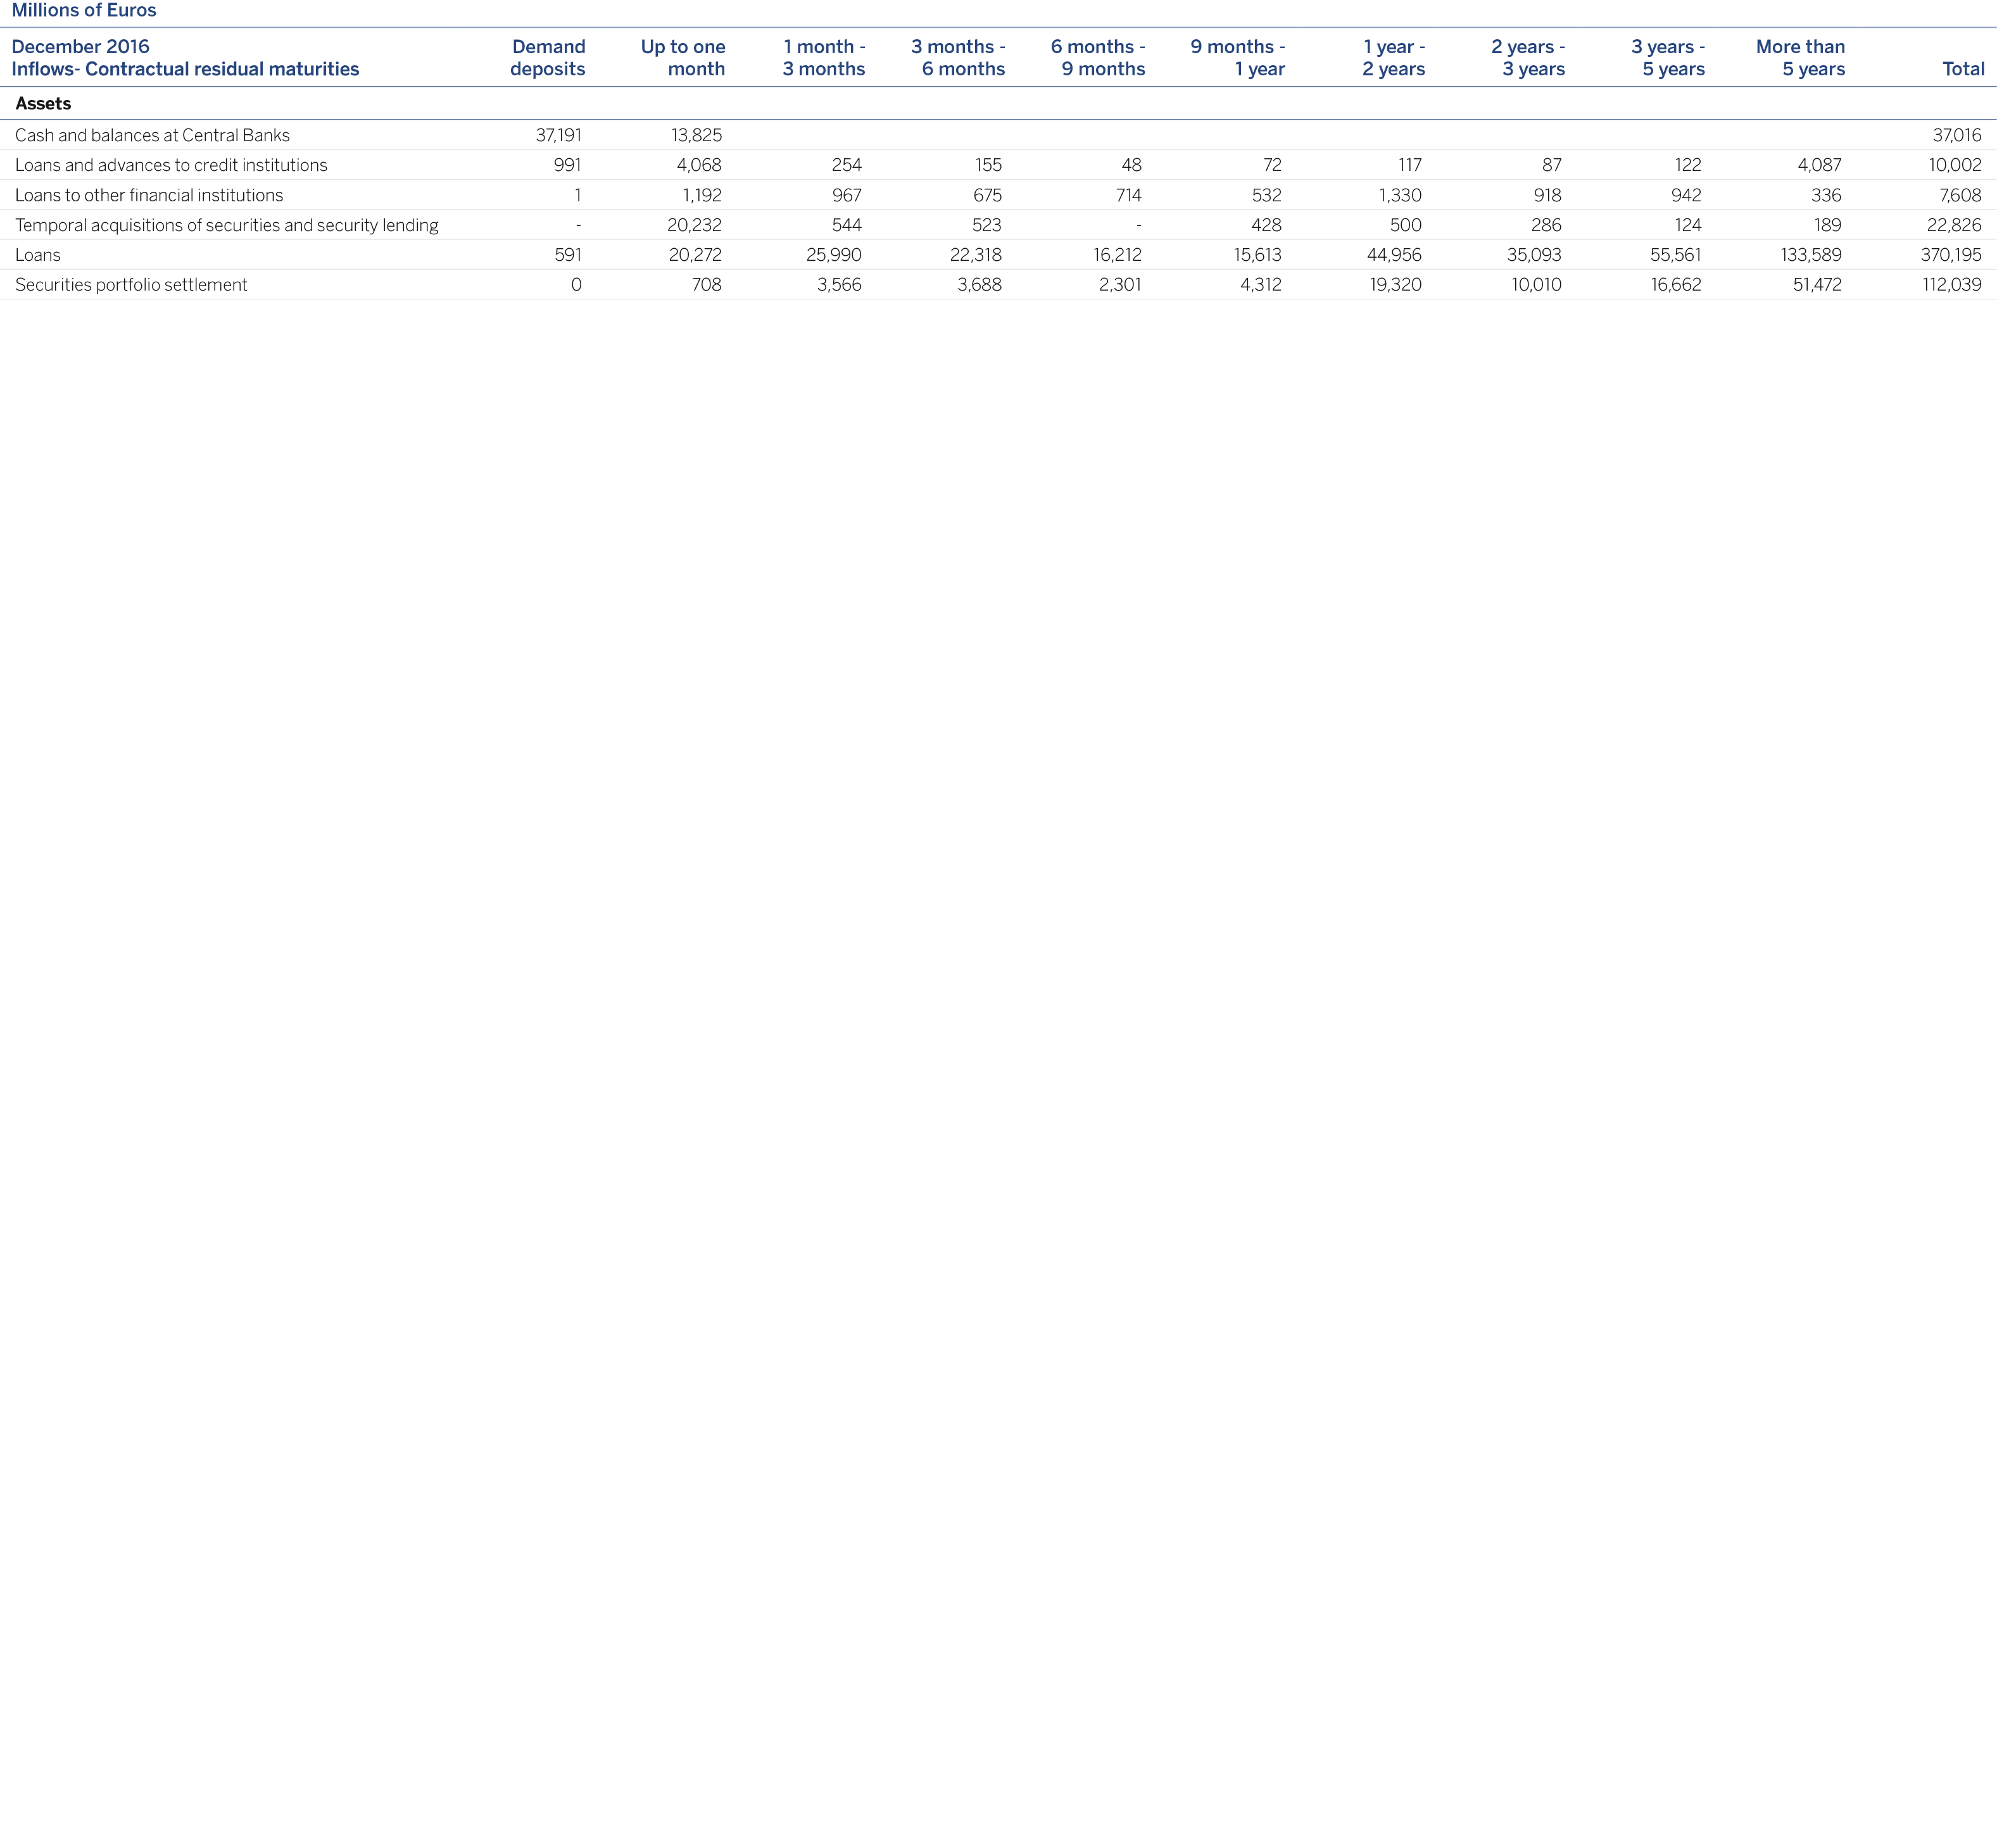

The funding structure is clearly stable, with the loan portfolio mostly funded from customer deposits. The outgoing demand section primarily contains current accounts of the retail customer base, whose behavior displays an elevated stability and for which, according to internal methods, the average maturity is estimated at over three years.
The long and short-term wholesale funding markets in the Eurozone were stable in 2016. The ECB began its new Targeted Longer-Term Refinancing Operations program (TLTRO II), consisting in four quarterly auctions maturity at four years, with a view to fostering the channeling of credit and improving the financial conditions of the European economy as a whole. The Euro UGL took part in the first auction of this program with a volume of €23.7 billion after repaying €14 billion of previous TLTROs. In addition, in the year as a whole, the Euro UGL has issued €6,350 million, providing long-term funding under favorable price conditions.
In Mexico, the liquidity position continues to be sound, despite the market volatility following the U.S. elections. There is still a relatively low level of dependence on wholesale funding, with the positive performance of customer funds allowing less use of wholesale markets (satisfied on the local market).
In the United States, the narrowing credit gap over the year has reduced wholesale funding, with the liquidity position in 2016 remaining comfortable.
In Turkey, despite the geopolitical tension and Moody's downgrade of its credit rating, the domestic environment has remained stable, without pressure on the sources of funding, supported by global stability and the measures adopted by the Central Bank of Turkey (CBRT).
The liquidity position in the rest of the subsidiaries has remained in a comfort zone, holding a solid position of liquidity in all jurisdictions where which the Group operates. Access to capital markets by these subsidiaries has continued with recurring issuance on the local market.
In this context of improved access to the market, BBVA has maintained its objectives of, on the one hand, strengthening the funding structure of the Group's various franchises based on growing its self-funding from stable customer funds, and on the other, guaranteeing a sufficient buffer of fully available liquid assets, diversifying the different sources of funding and optimizing the generation of collateral to deal with situations of tension in the markets.
BBVA Group has entered 2017 with a comfortable liquidity status across its entire global footprint. The financing structure slanting toward the long term and proven access capacity to capital markets enables to comfortably meet the moderate volume of maturities expected for the upcoming quarters.
The following is a breakdown of maturities of wholesale issues of the most significant units of the Group by the nature of the issues.
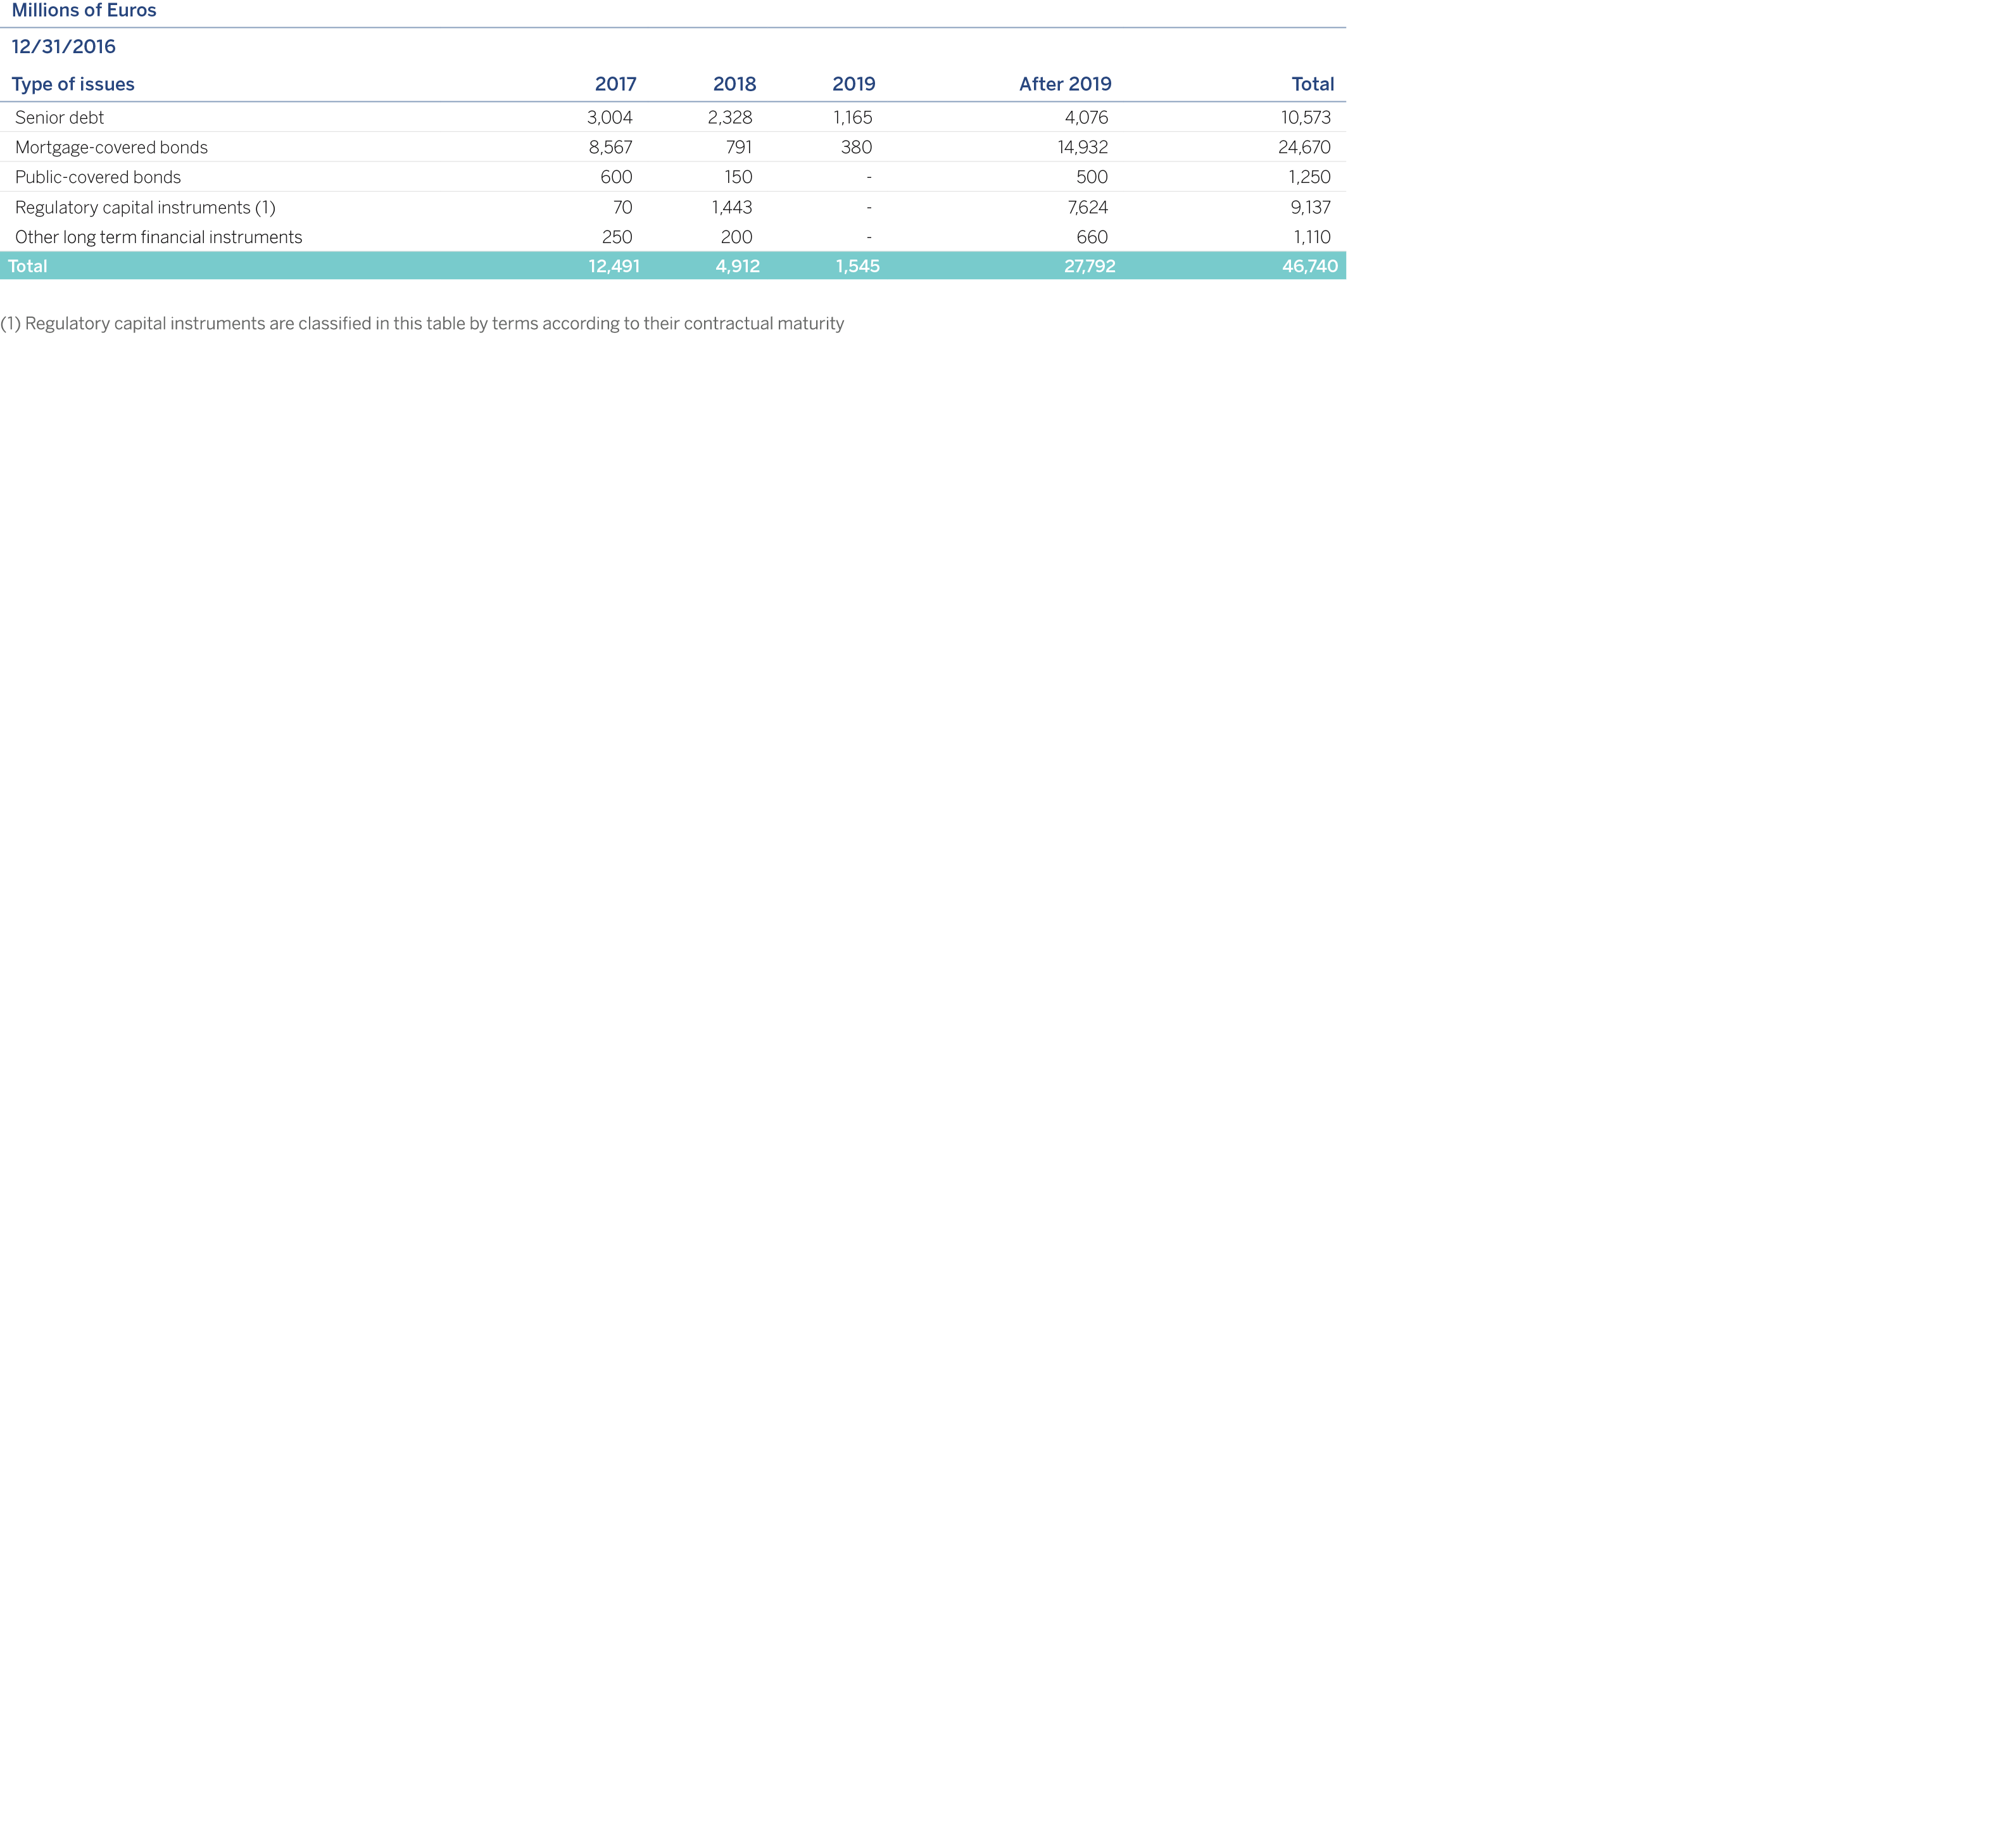
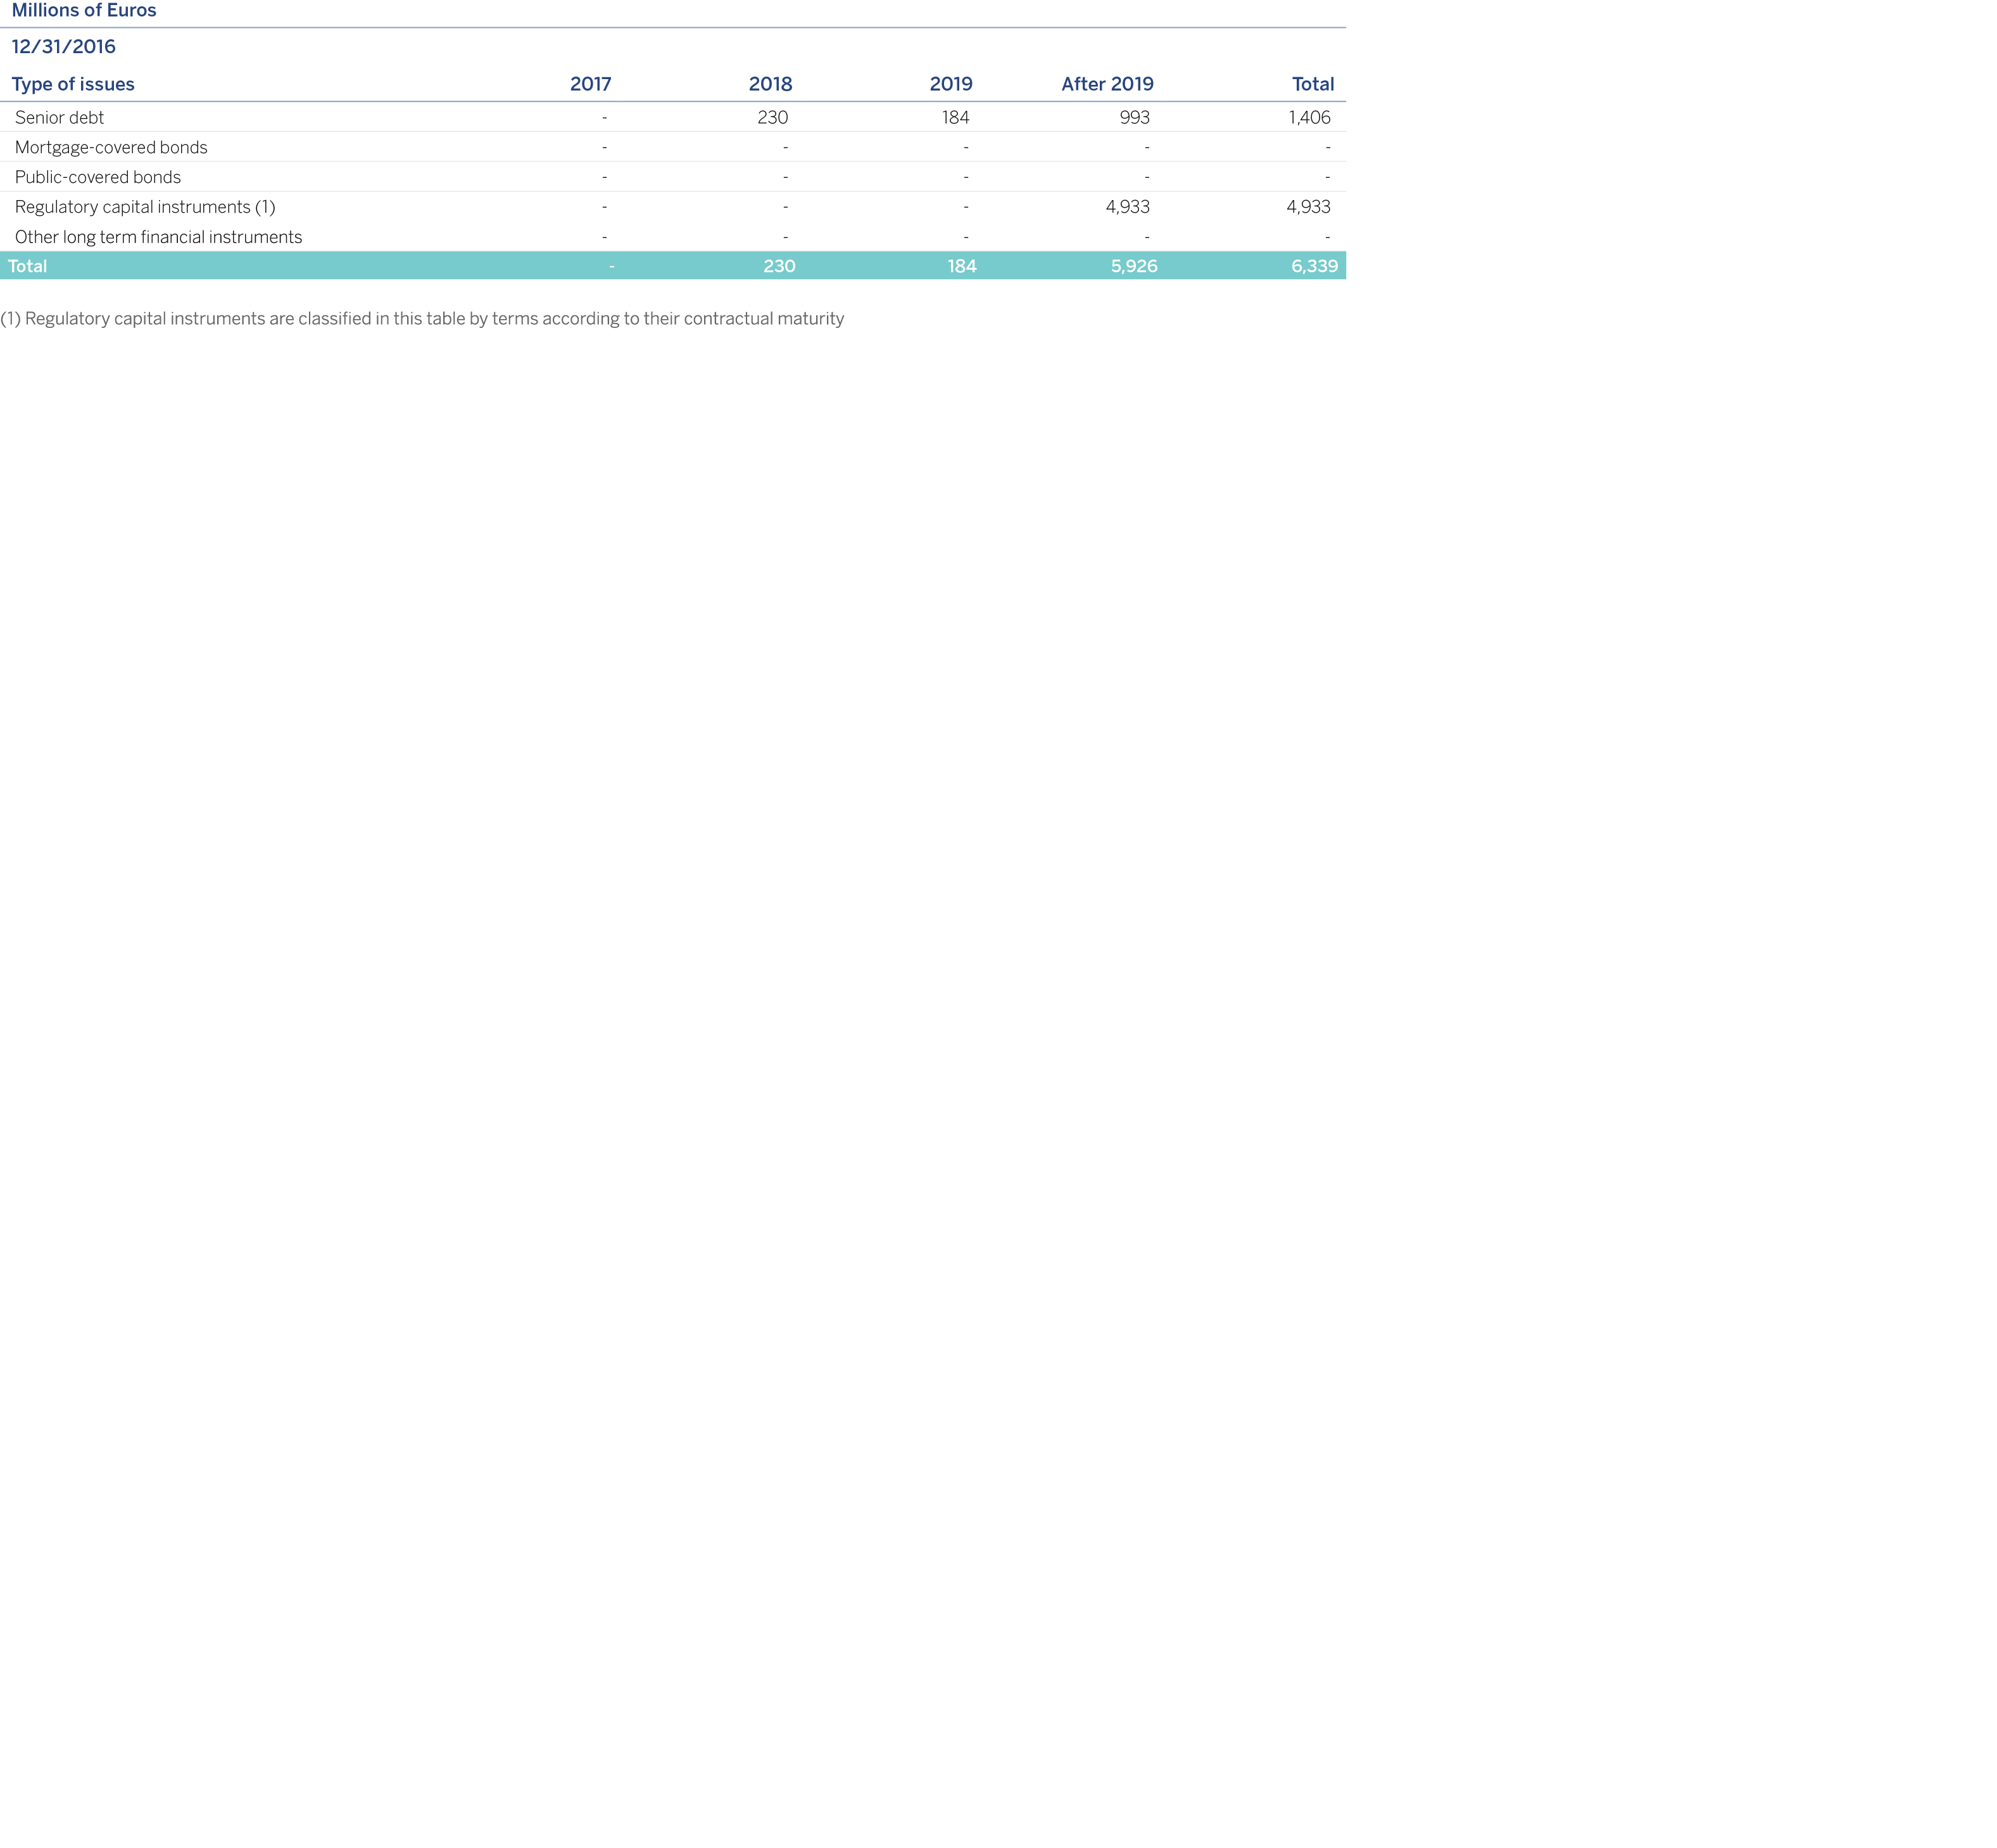
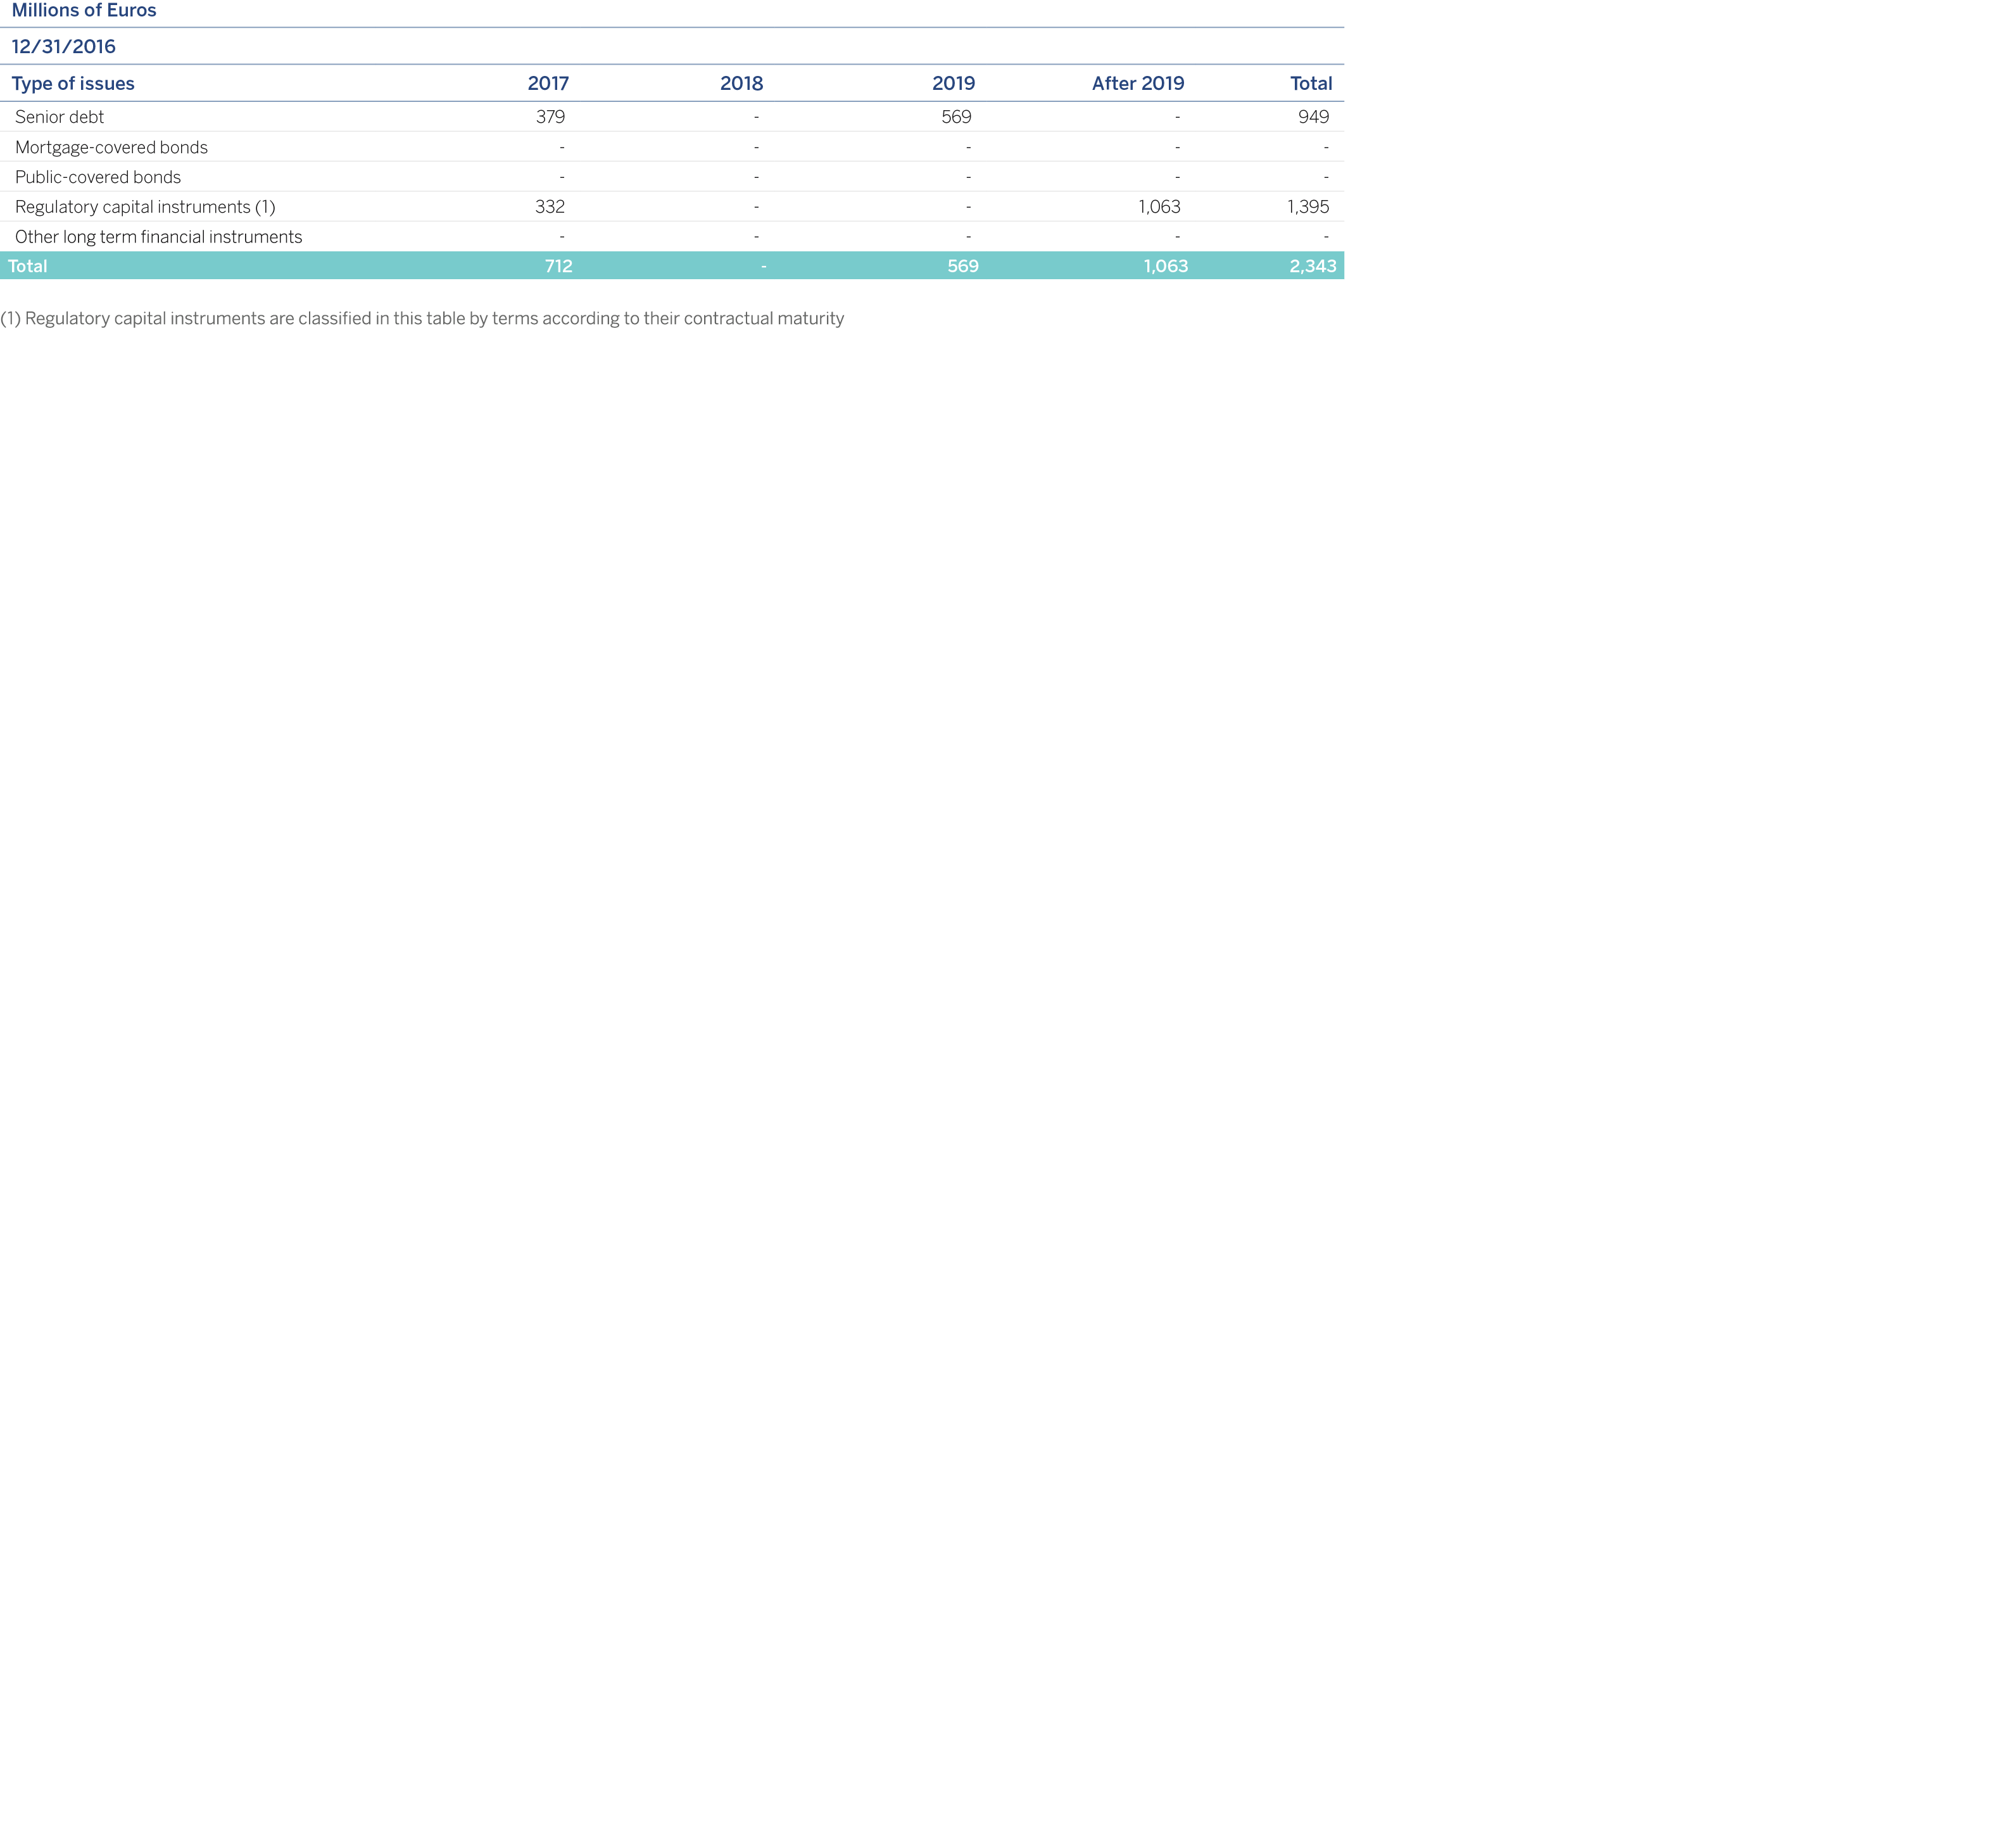

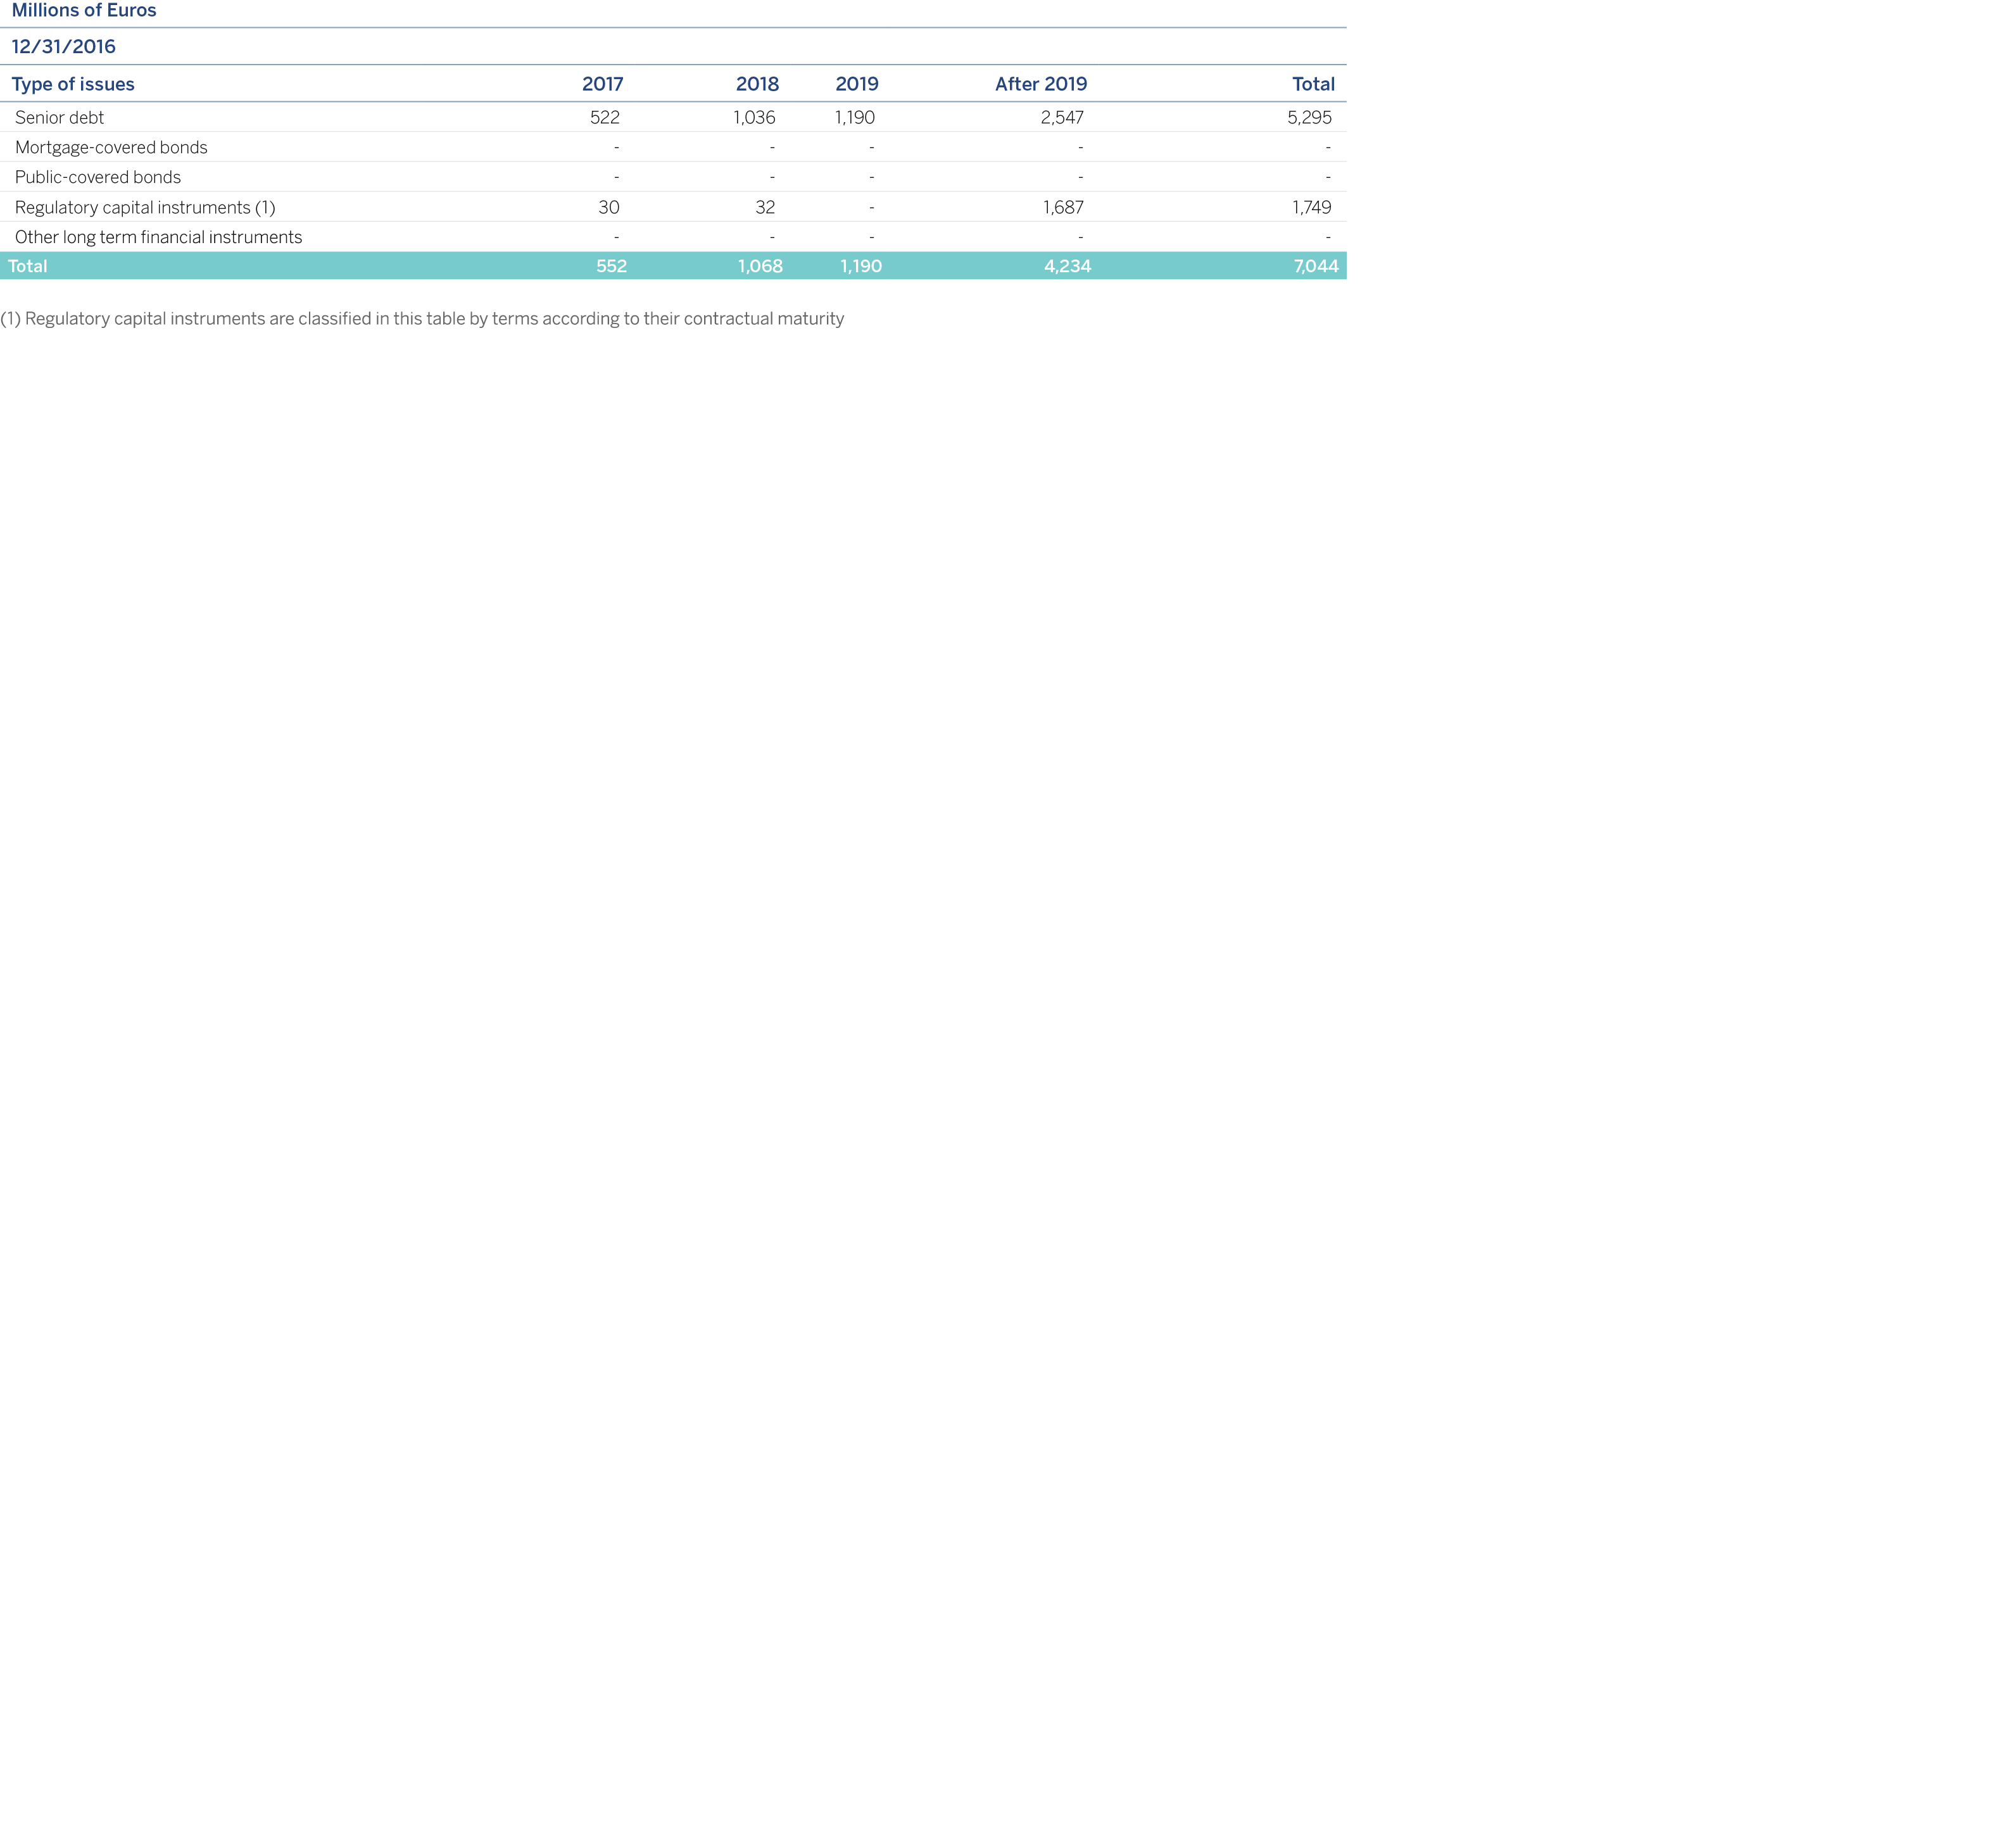
For 2017, the main goals of BBVA Group's funding strategy is to maintain the strength of the funding structure and the diversification of the different sources of funding, ensuring the availability of sufficient levels of collateral, both for complying with regulatory ratios and for the rest of the internal metrics for monitoring liquidity risk, including stress scenarios.
As of December 31, 2016, the encumbered assets (provided as collateral or security with respect to certain liabilities) and those unencumbered are as follows:
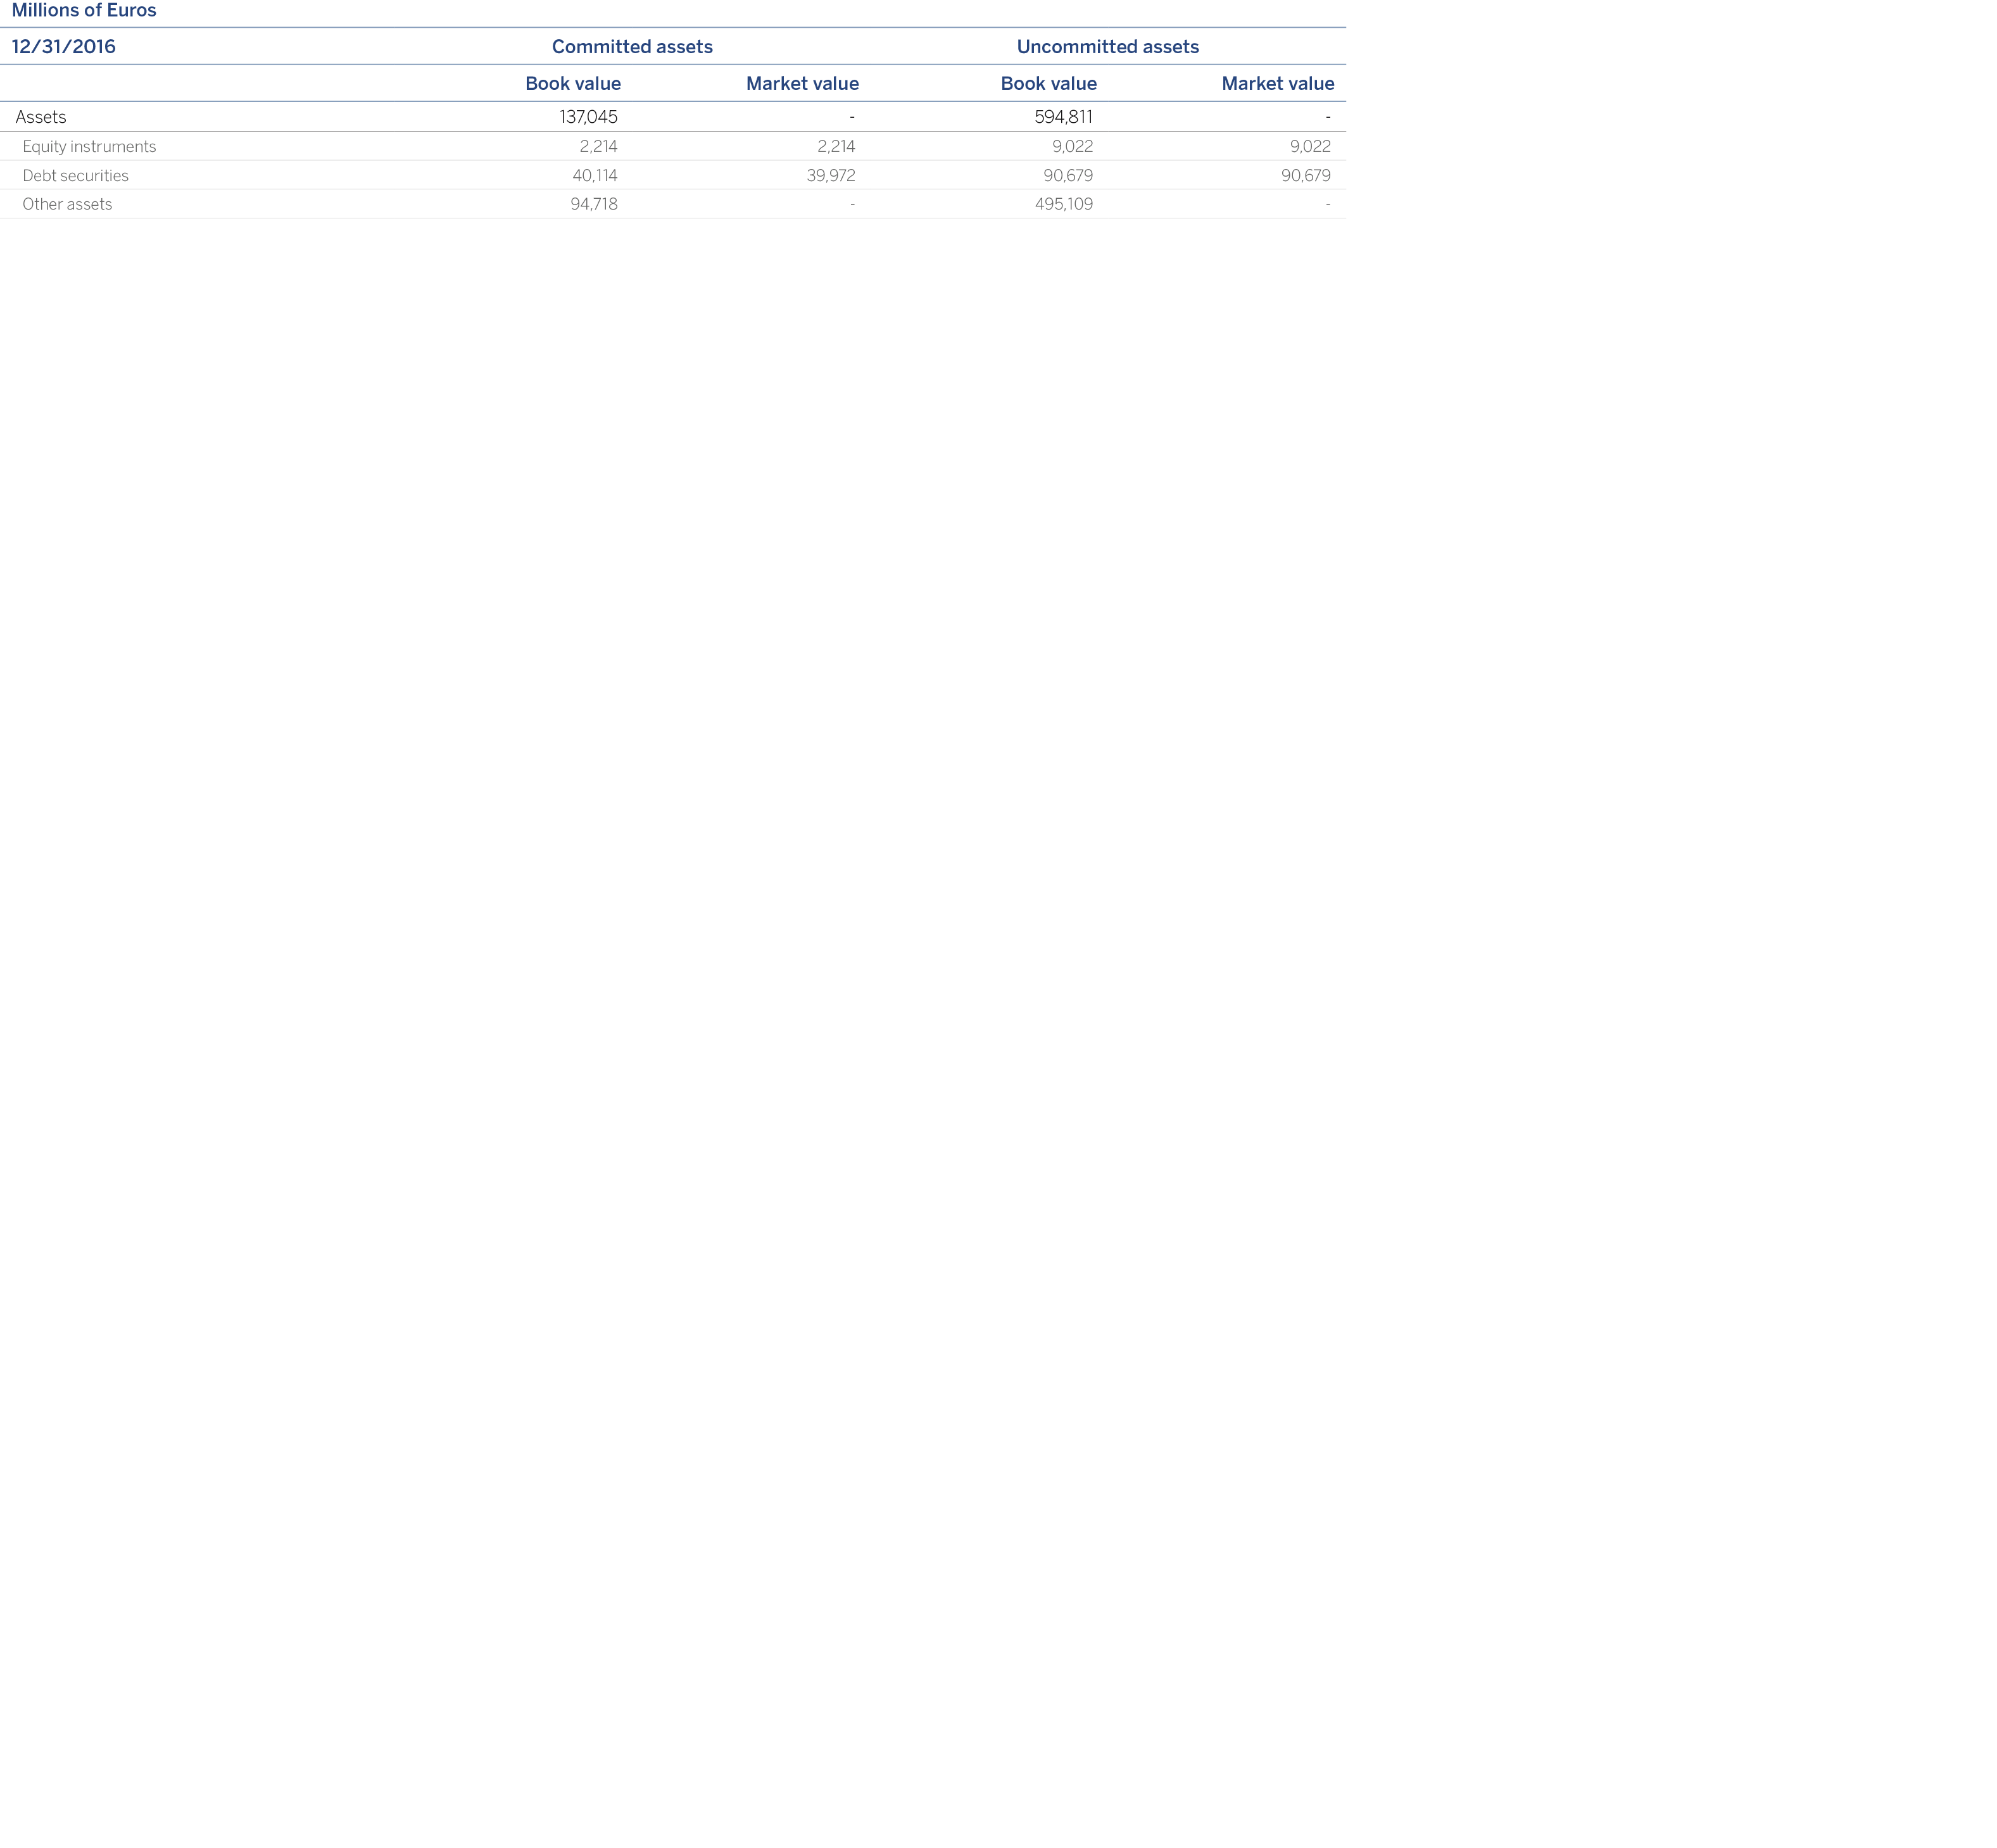
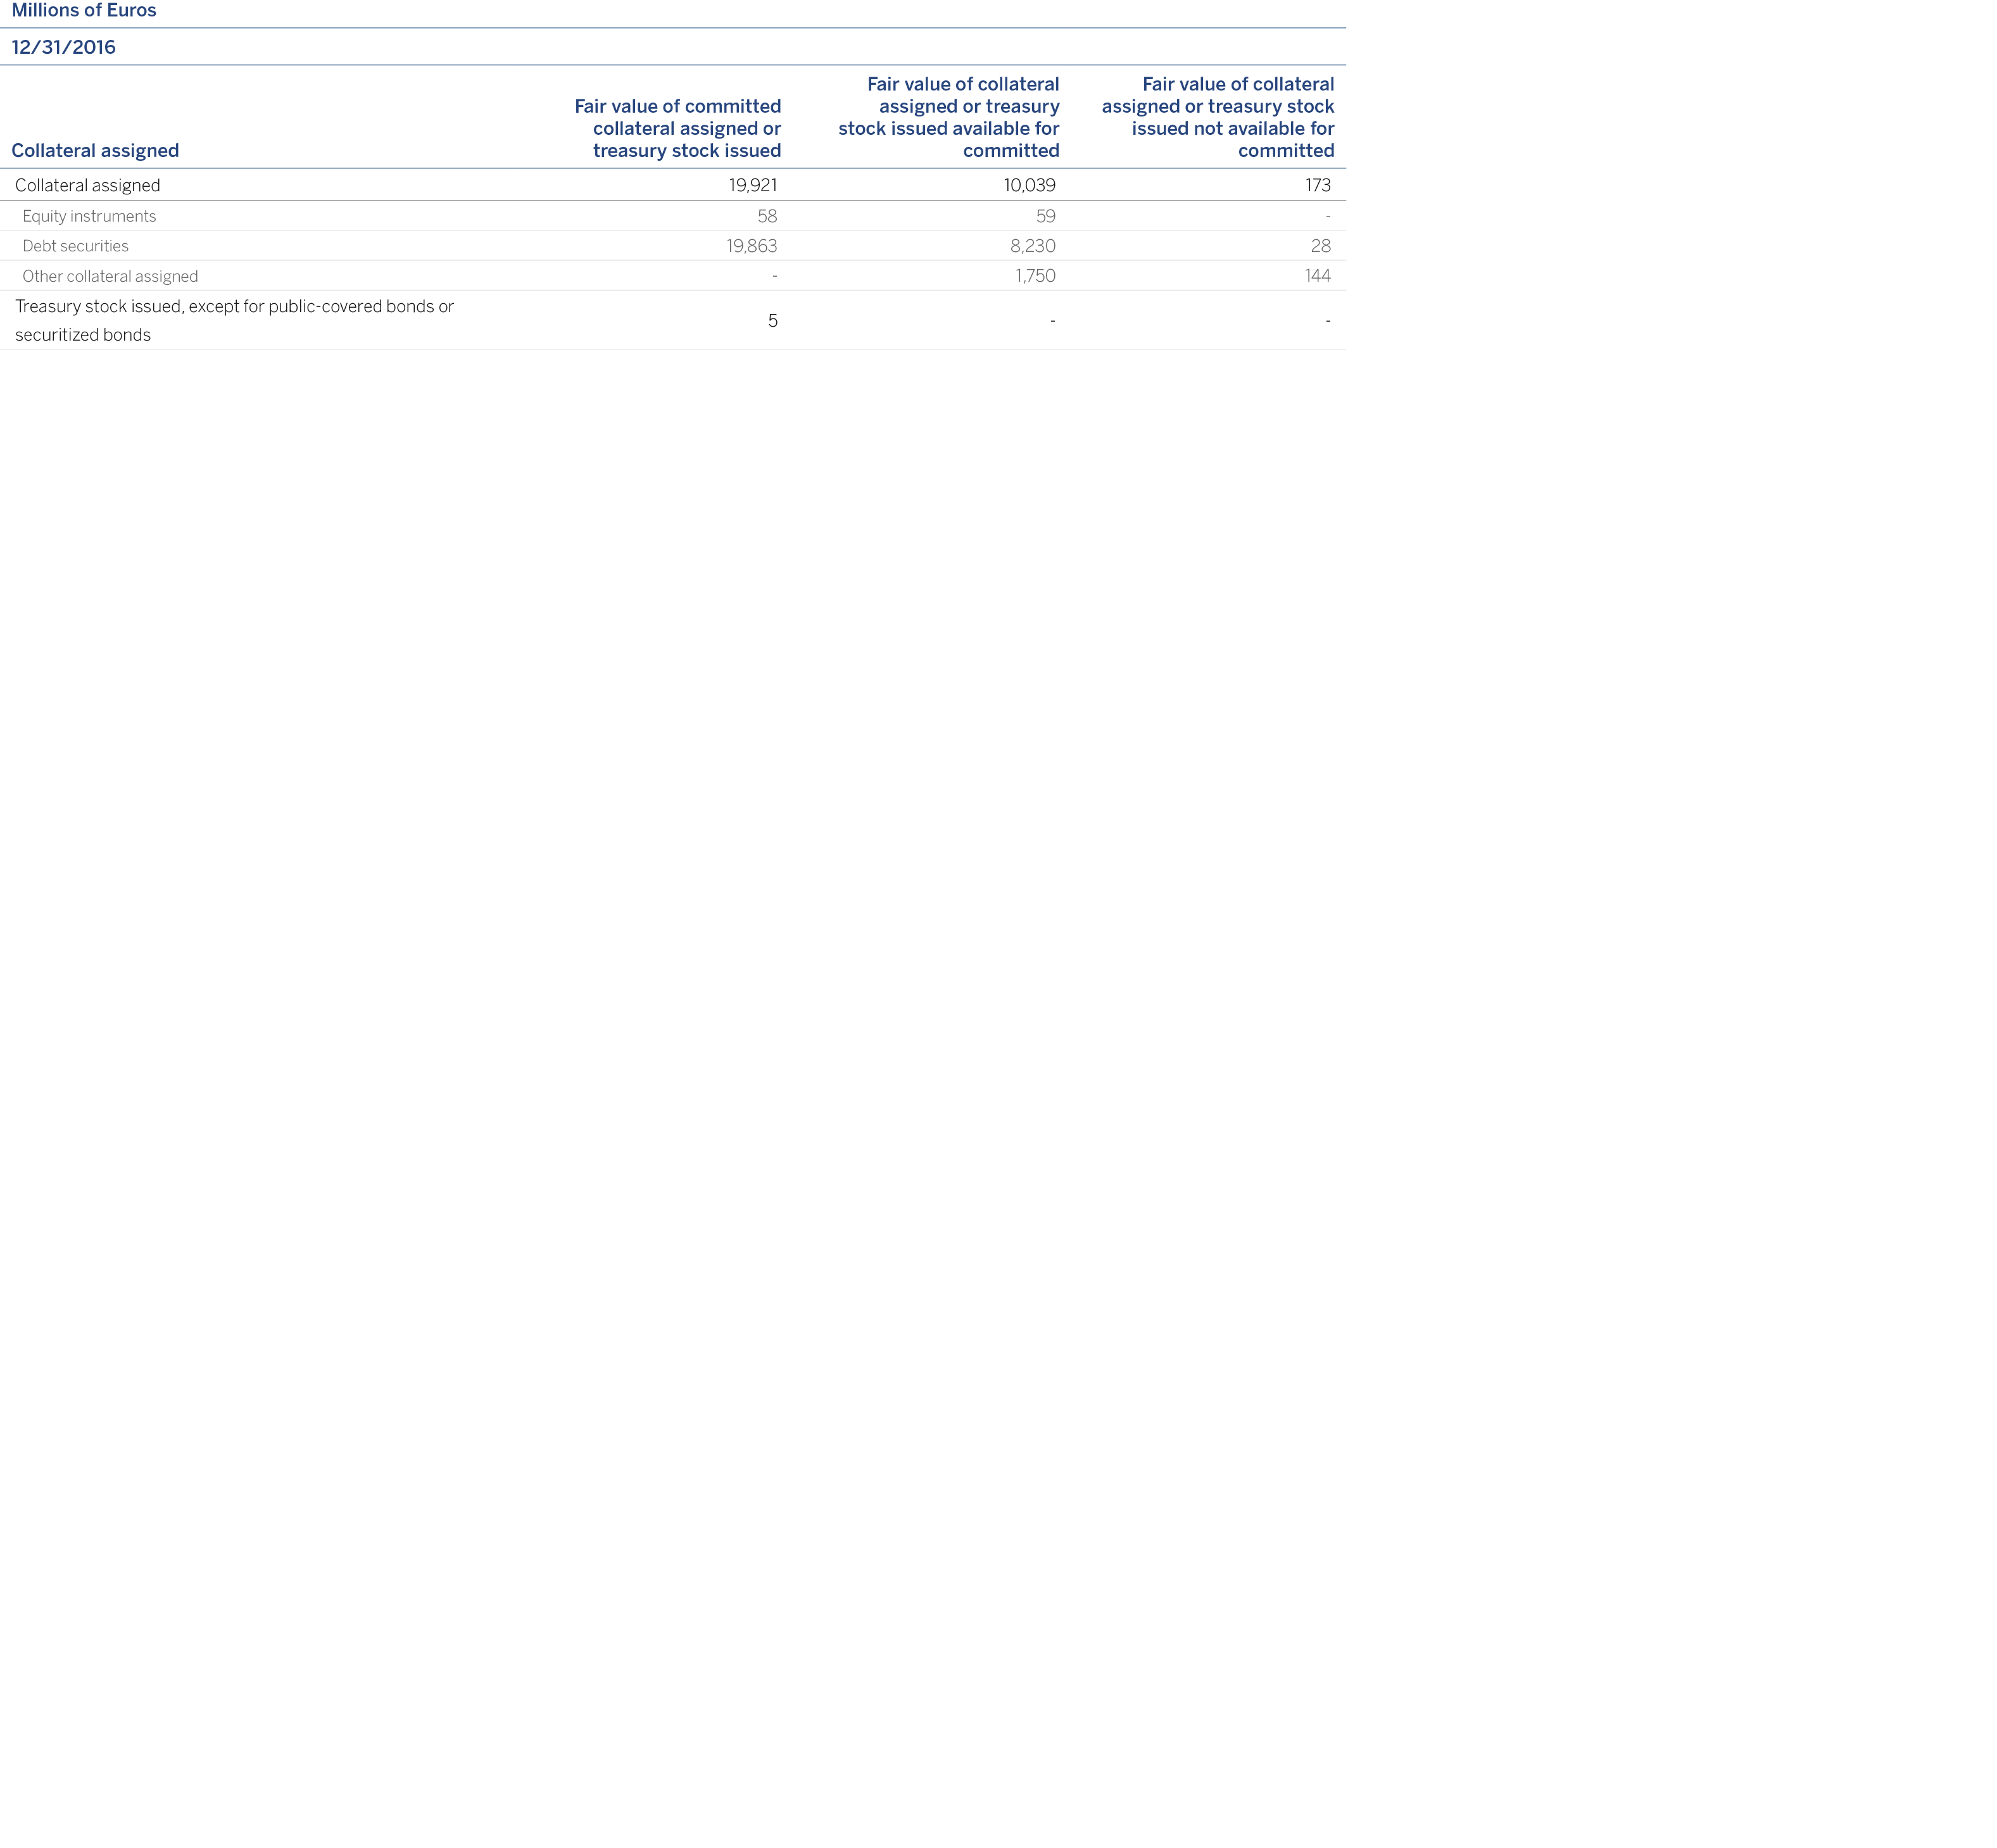
The guarantees received in the form of reverse repurchase agreements or security loans are encumbered through the use of transactions in assets sold under repurchase agreements, similar to debt securities.
As of December, 31 2016, all issued financial liabilities associated with the different encumbered assets in funding operations, including the book value of the latter, are listed below:
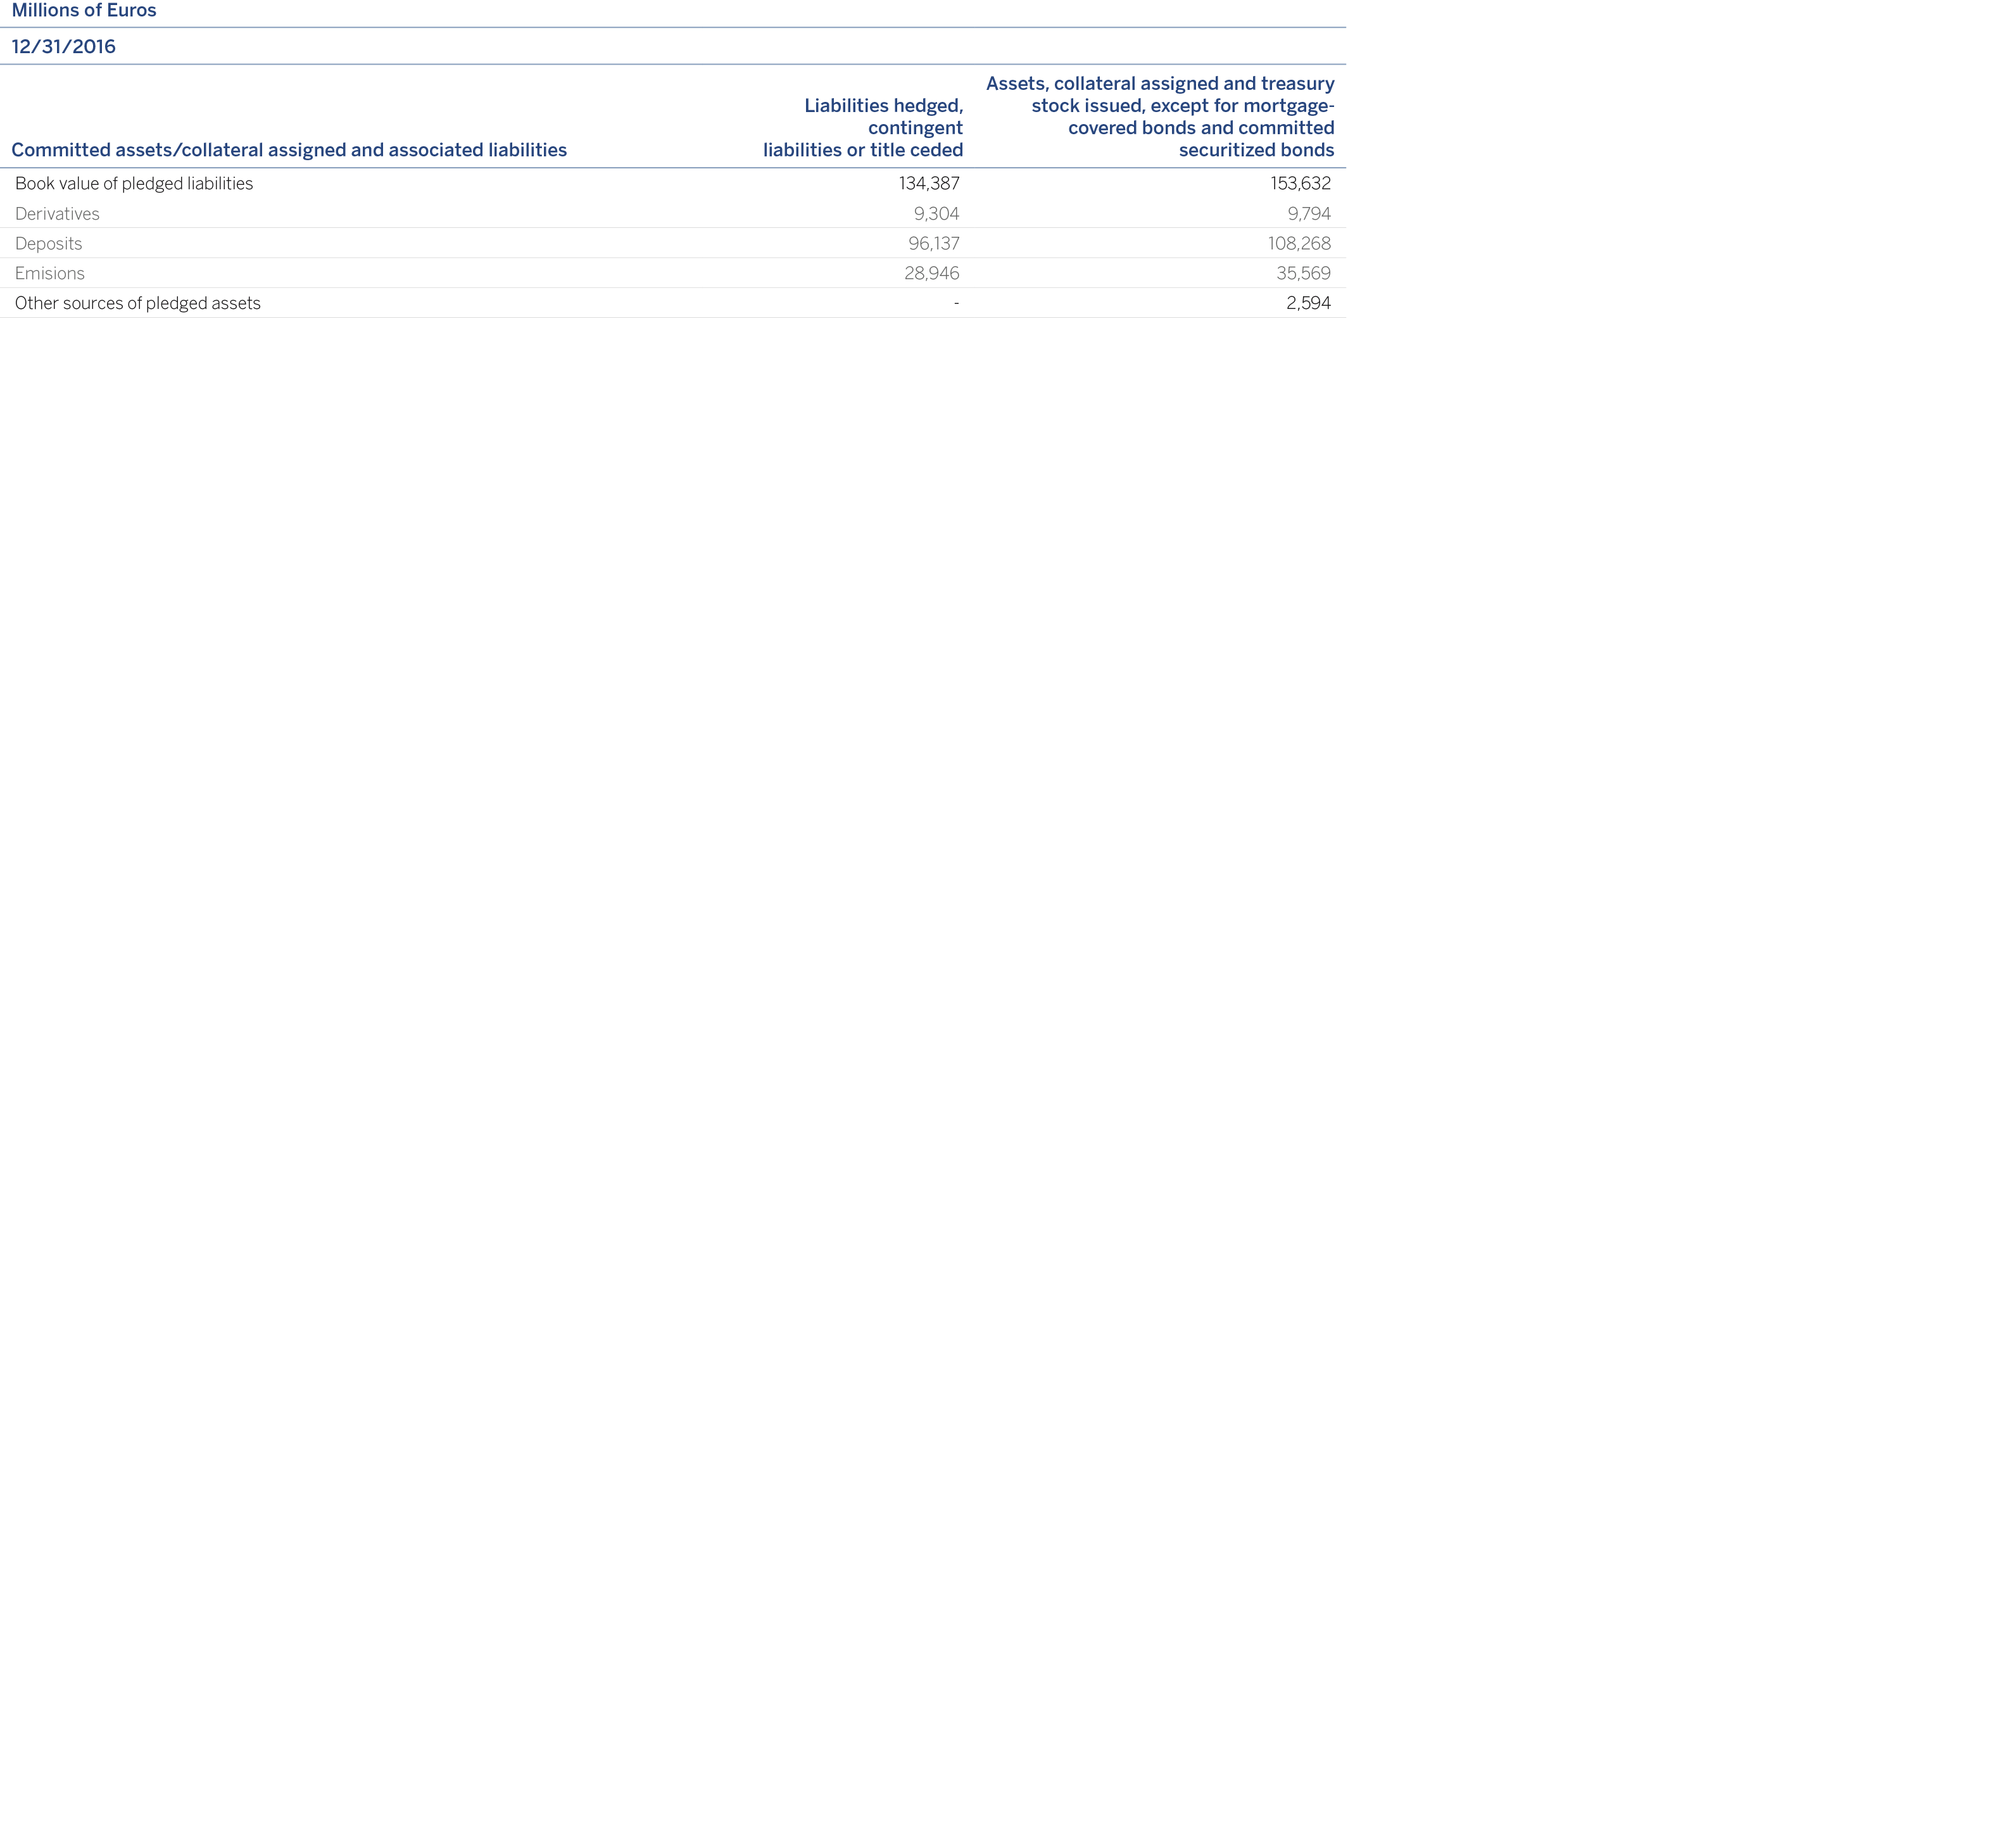
Operational risk is defined as the one that could potentially cause losses due to human errors, inadequate or faulty internal processes, system failures or external events. This definition includes legal risk, but excludes strategic and/or business risk and reputational risk.
Operational risk is inherent to all banking activities, products, systems and processes. Its origins could be highly diverse (processes, internal and external fraud, technology, human resources, commercial practices, disasters and suppliers). Operational risk management is integrated into BBVA Group's global risk management structure. The analysis of the entity's RWA structure shows that 9% corresponds to Operational Risk.
BBVA accepts the definition of Operational Risk proposed by the Bank for International Settlements (BIS) in Basel: "Operational Risk is defined as the one that could potentially cause losses as a result of human errors, inadequate or faulty internal processes, system failures or external events". This definition excludes the strategic and/or business risk and the reputational risk (which is managed separately within BBVA Group).
The definition of Operational Risk in BBVA Group includes the following risk types:
Legal risk: possibility of being sanctioned, fined or obliged to pay punitive damages as a result of supervisory actions or private agreements between the parties.
Regulatory compliance linked to compliance issues4.
Risk of external fraud: Risk as a result of the commission of crimes by third persons, whether customers or not.
Risk of internal fraud: Risk from illegal actions, commission of crimes, disloyalty, abuse of trust, etc., acts of willful misconduct or for gain by members of the entity's internal staff, as well as the performance of other unauthorized activities.
Technological risk: Risk arising from faults in the design or implementation of information systems, problems or delays generated in the execution of specific automatic processes, faulty operation of the Host systems or communications (line outages), information losses in backup devices or applications and developments for not responding to user specifications, shortcomings in the security in data processing buildings and in the security of technological infrastructure, etc.
Supplier risk: Risk originated by shortcomings in the service provided by vendors and subcontracted companies (independent businesses or those whose management is not controlled by the Group)
Fiduciary risk: As regards the administration of third-party assets - including when it acts as trustee
BBVA Group is exposed to a fiduciary risk arising from its condition of investment manager for customers and when it provides consultancy services in investment matters. In both cases, with respect to the management of investments on behalf of third parties, it is the customer who takes on the market and credit risks, while it is the manager or administrator that assumes the fiduciary duty of managing in the best interest of the customer. Non-compliance of the fiduciary duty could lead to losses for the Group. Moreover, the distribution of the investment products can lead to a fiduciary risk for the bank.
The Group has in place an integrated internal control and operational risk methodology.
This methodology identifies risks in organizational areas, generates analyses that prioritize risks according to the estimated residual risk (after incorporating control effects), links risks to processes and establishes an objective risk level for each risk type to identify and manage gaps by comparing it with the residual risk level.
Through its Internal Control & Fiduciary Risk (IC&FR) unit the Corporate Risk Area establishes the criteria applicable for determining BBVA Group companies in which to implement the OR monitoring and management/mitigation tools described in section 3.8.5.2. These criteria are based on both quantitative and qualitative aspects.
The scope of application of the OR management model revolves around the following elements:
Company
Process: in general, OR originates in the different activities/processes carried out in the Group.
Business line: because the type of the different operational risks to which the Group is exposed, and their impact, is substantially different for each line of business, considering this element is fundamental for effective management of OR.
Based on best operational risk management practices, BBVA Group has established and maintains an internal control model organized around three lines of defense (3LoD), as well as a governance scheme called Corporate Assurance. The Group's internal control model has two components.
1. The first one is the model based on three lines of defense, which guarantees compliance with the most advanced internal control standards and is organized as follows:
2. The second component is the Corporate Assurance scheme, which is tasked with providing a comprehensive and standardized approach to the Board of Directors and the management bodies on the Group's internal control situation. This provides timely information on the main control weaknesses that may arise in the different assurance processes and makes it possible to prioritize their solution and monitor the implementation of measures for mitigating them more effectively.
To perform its duties, the model is provided with an orderly mechanism for reporting to management. This mechanism involves a number of committees that meet every four months, in which members of the senior management of the Group and its subsidiaries take part. The committees seek to understand control issues and make decisions that will have a significant impact on the objectives of the various units, both at the local level and for the consolidated Group.

Operational Risk management in BBVA Group must:
Be aligned with the Risk Appetite statement set out by the Board of Directors of BBVA.
Predict the potential operational risks to which the Group may be exposed as a result of the emergence or modification of new products, activities, processes or systems and outsourcing decisions and establish procedures to enable their assessment and reasonable mitigation prior to their implementation.
Establish methodologies and procedures to enable a regular reassessment of the relevant operational risks to which the Group is exposed, in order to adopt appropriate mitigation measures in each case, after considering the identified risk and the cost of mitigation (cost-benefit analysis) and preserving at all times the Group's solvency.
Identify the causes of the operational losses sustained by the Group and establish measures to enable their reduction. To do so, procedures must be in place to enable the capture and analysis of the operational events causing such losses.
Analyze the events that may have caused operational risk losses in other entities in the financial sector and drive, where appropriate, the implementation of the measures necessary to prevent their occurrence in the Group.
Identify, analyze and quantify events with a low probability of occurrence and high impact which, due to their exceptional nature, may possibly not be included in the losses database or, if they are, have unrepresentative impacts, in order to ensure their mitigation.
Have effective governance in which the functions and responsibilities of the Areas and Bodies involved in OR management are clearly defined

These principles reflect BBVA Group's vision of OR, which is based on the premise that the events that occur as a result of OR have an ultimate cause that should always be identified. The control of the causes significantly reduces the impact of the events. The OR management tools provide information on the origin of OR and assist in its mitigation.
Irrespective of the adoption of all possible measures and controls to prevent or reduce both the frequency and severity of OR events, BBVA ensures that it has sufficient capital at all times to cover the expected or unexpected losses that may arise.
IC&FR proposes the general policies that guide management and enable control of the Group's operational risk.
These principles aim to reasonably ensure (cost-benefit analysis) that the relevant operational risks to which the Group is exposed in carrying out its activities are identified, assessed and managed consistently with the risk appetite statement set out by the Board of Directors of BBVA, preserving the Group's solvency.
The OR is managed in BBVA Group from two different and complementary viewpoints:
The “ex-ante” point of view entails identifying, assessing and prioritizing potential operational risks to enable their mitigation.
From this standpoint, OR is managed in a proactive and preventive way by the Areas and Units exposed. This management is integrated into the day-to-day decision-making process and is focused on the analysis of the causes of OR to enable its mitigation.
The “ex-post” point of view entails assessing the exposure to OR and measuring its consequences, i.e. the historical cost of the events that have occurred. From this perspective, OR management uses tools associated with the consequences of OR not only to complement OR management, but also to feed the calculation of capital use for those Group areas that operate under advanced OR measurement approaches.
The elements that enable OR to be managed in BBVA Group from these two standpoints are described below.
Although strictly speaking there is not a true OR admission process, as the one carried out, for example, in Credit Risk, BBVA Group considers that the assimilation presented in this section is useful for controlling this risk and contributes to its mitigation. The aim of this process is to: anticipate the potential operational risks to which the Group may be exposed as a result of the emergence or modification of new products, activities, processes or systems and outsourcing decisions and ensure that they are implemented only after adopting suitable mitigation measures in each case.
The Group has a specific governance model for OR admission embodied in different Committees that are admission vehicles in the different areas in which the emergence of OR is concentrated: new businesses, new products, systems, outsourcing decisions, etc.
An appropriate management of OR requires the establishment of methodologies and procedures to identify, assess and follow this type of risks, in order to implement suitable mitigation measures in each case. This will be done by comparing the level of risk assumed and the cost of mitigation.
BBVA Group's OR management methodology has the following phases:
Establishment of the model's perimeter, identifying the companies and activities that may give rise to significant OR. These companies and activities are associated with their processes using the taxonomy established by the Group. Processes are the starting point for identifying the OR factors.
Identification of potential and real OR factors based on the review of the processes, applying self-assessment techniques that are completed and verified against other relevant information.
Prioritization of the OR factors through the calculation of the inherent risk: estimation of the exposure to risk in an adverse and conservative environment without considering the existence of possible controls. Prioritization is used to separate the critical factors from the non-critical ones by applying cut-off points.
For critical risks, the controls that contribute to their reduction are identified, documented and tested, and based on their effectiveness the residual risk (which incorporates the reducing effect of the controls, where applicable) is calculated.
A specific target is set for each critical risk, that constitutes the level of risk considered acceptable. In those risks in which the residual risk is higher than the target risk there is a gap between both that requires that the risk be mitigated through a mitigation plan.
The aim is to have an evolving and dynamic OR management model that reflects the essential aspects of this risk's situation at any given time.
OR management is coordinated with other risks, considering the credit or market consequences that may have an operational origin.
Dynamic management of OR requires not only a regular self-assessment of OR, but also the definition of a set of indicators to enable the changes in both the risk factors and the effectiveness of the controls to be measured over time, in order to have available information on unexpected changes and enable preventive management of Operational Risk.
In line with the best practices and recommendations of the BIS, BBVA has procedures in place for collecting operational losses that occur both in the different Group entities and in other financial groups (ORX losses database, ORX News service, etc).
Internal operational losses database - SIRO
Through automatic interfaces with accounting and expense and manual capture procedure applications, this tool collects the accounting losses associated with OR events. The losses are captured with no amount limit and constitute an input for calculating the capital use for OR in advanced measurement approaches and a reference for the Risk and Control SelfAssessment, and are analyzed on a regular basis in terms of trends and monitoring of expected losses.
_External operational losses database - ORX_The Bank, together with other leading entities worldwide, subscribed with the ORX consortium, as a founding partner, the creation of an external database for anonymously exchanging information related to operational events. This consortium provides both quantitative and qualitative information on the operational events experienced by the member entities. The information obtained through this means is used both to identify potential ORs and analyze whether appropriate mitigation measures are available, and for the purpose of calculating capital using advanced measurement approaches.
These reflect the exposure to a limited number of situations that may give rise to very significant losses with a reduced estimated frequency of occurrence. The scenarios feed the capital calculation in those Group areas that operate under advanced measurement approaches, and also constitute a reference for OR management.
Mitigation means to reduce the level of exposure to OR. Even though there is always the option of eliminating OR by exiting a given activity, the Group's policy is to attempt to mitigate the risk first by improving the control environment or applying other measures, conducting a rigorous cost-benefit analysis. The different forms of mitigation always have associated costs. It is therefore fundamental to assess the cost of the OR properly before making a decision.
As long as the residual risk exceeds the defined target risk level, mitigation measures will need to be established to keep it within the level. The area responsible for OR will drive its implementation through the Operational Risk Management Committee.
As set out in Regulation (EU) 575/2013 of the European Parliament and of the Council, for calculating the regulatory capital for operational risk under Basel I, advanced measurement approaches (AMA method) are used for a very significant part of the banking perimeter. Specifically, this method is used in Spain and Mexico, which accumulate most of the Group's assets.
In March 2010, BBVA Group received authorization from the supervisor to apply advanced models for calculating regulatory capital by operational risk in Spain and Mexico.
Except for the cases of Garanti and Bolivia, for which the basic approach is applied, the standardized approach is used to calculate capital in the rest of the geographical areas.
The advanced internal model quantifies capital at a confidence level of 99.9% following the LDA (Loss Distribution Approach) methodology. This methodology estimates the distribution of losses by operational event by convoluting the frequency distribution and the loss given default distribution of these events.
The calculations are made using internal data on the Group’s historic losses as its main source of information. To enrich the data from this internal database and to take into account the impact of possible events not yet considered therein, external databases (ORX consortium) are used and the scenarios indicated in point 3.8.5.2.4 are included.
The distribution of losses is constructed for each of the different types of operational risk, which are defined as per Basel Accord cells; i.e. a cross between business line and risk class. In those cases in which there is not sufficient data for a sound analysis, it becomes necessary to undertake cell aggregations, and to do so the business line is chosen as the axis.
In certain cases, a greater disaggregation of the Basel cell has been selected. The objective consists of identifying statistically homogenous groups and a sufficient amount of data for proper modeling. The definition of these groupings is regularly reviewed and updated.
Solvency regulations establish that regulatory capital for operational risk is determined as the sum of individual estimates by type of risk, but allowing the option of incorporating the effect of the correlation among them. This impact has been taken into consideration in BBVA estimates with a conservative approach.
The model of calculating capital in both Spain and Mexico incorporates factors that reflect the business environment and situation of internal control systems. Thus the calculation obtained is higher or lower according to how these factors change in anticipating the result.
The Group has insurance policies that basically cover the risk of cyberattacks, natural and/or provoked disasters and external and internal fraud. For the purpose of calculating capital by the AMA the mitigating effect of the insurance contracted is not included.
The following table below shows the operational risk capital requirements broken down according to the calculation models used and by geographical area, to provide a global vision of capital consumption for this type of risk:
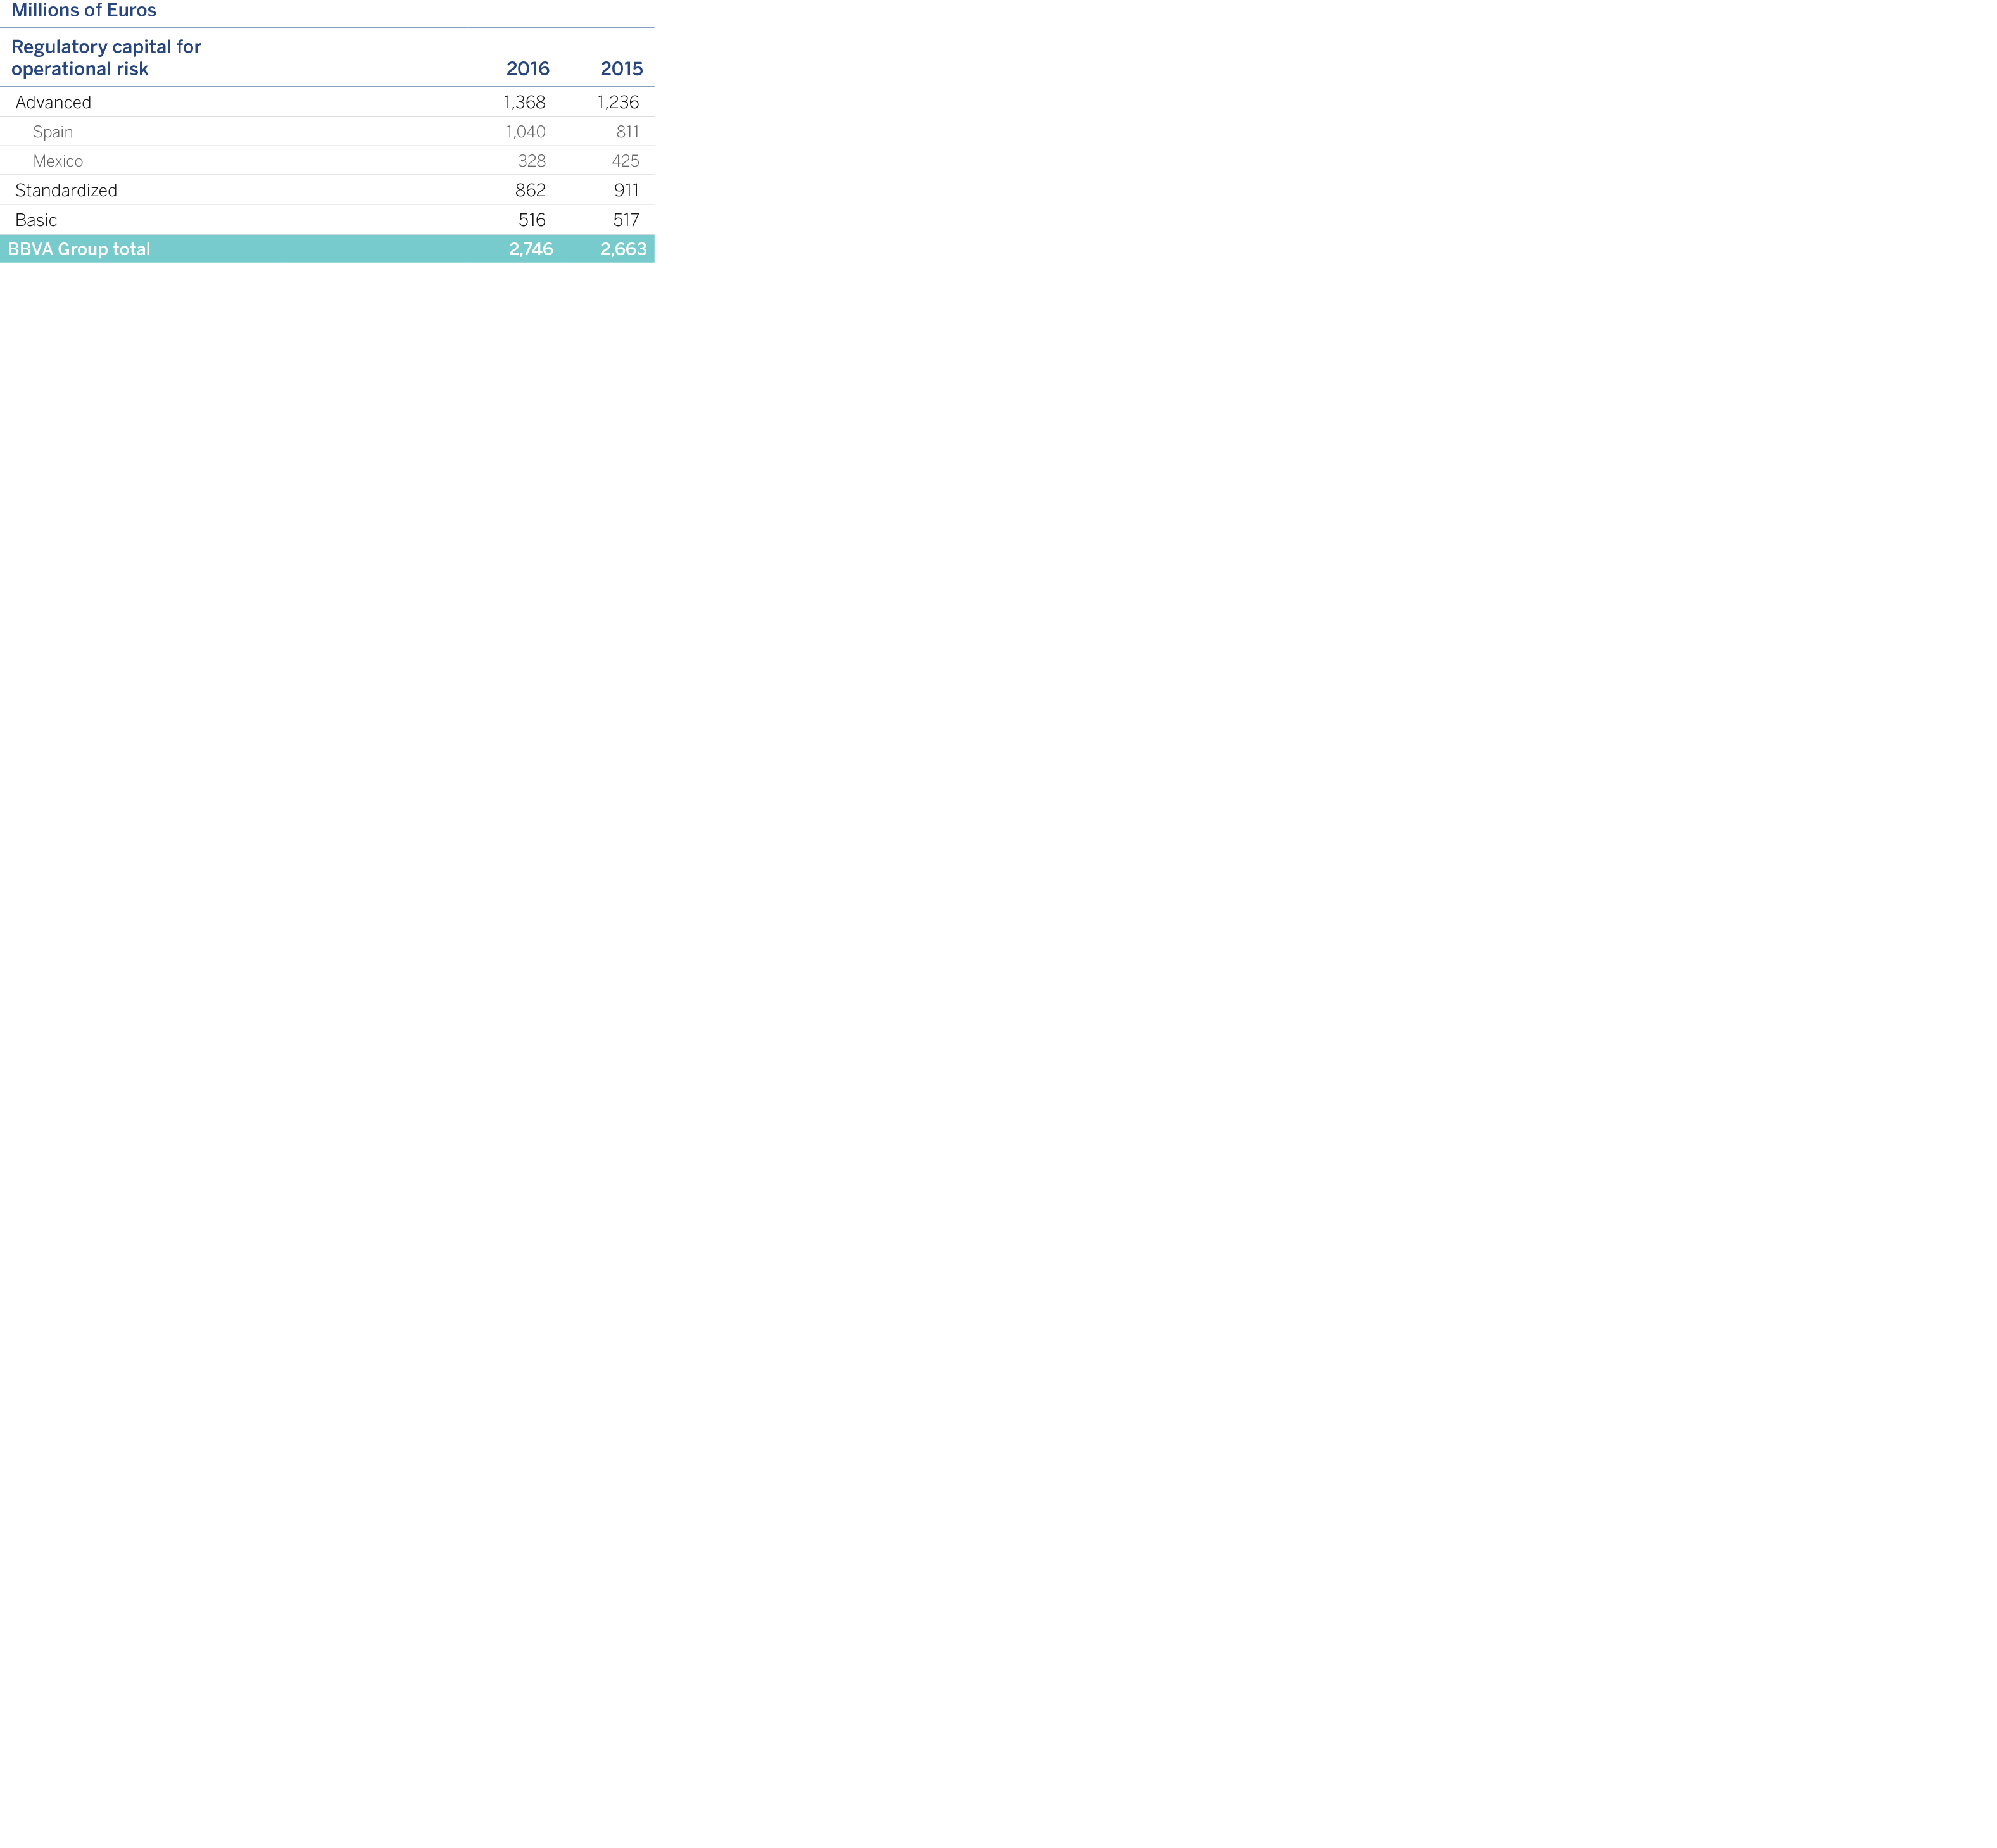

BBVA's operational risk profile is shown below by class of risk after assessing the risks, resulting in the following distribution:

The following charts illustrate the distribution of historical operational losses by risk class and country.


The exchange rate includes the effect of the depreciation of the main currencies in which the Group operates.
In others the impact of updating the calculation period for basic and standard models is included, as is the impact of "mortgage floor causes" in the advanced model for the operational risk in Spain, as mentioned above.

