
Mexico
Highlights
- Growth of all the segments in the loan portfolio, with greater dynamism of the retail segment
- Double digit year-on-year growth in all the income statement margins
- Favorable evolution of the efficiency ratio
- Quarterly net attributable profit continues at high levels
Business activity (1)
(VARIATION AT CONSTANT EXCHANGE RATE COMPARED TO
31-12-22)
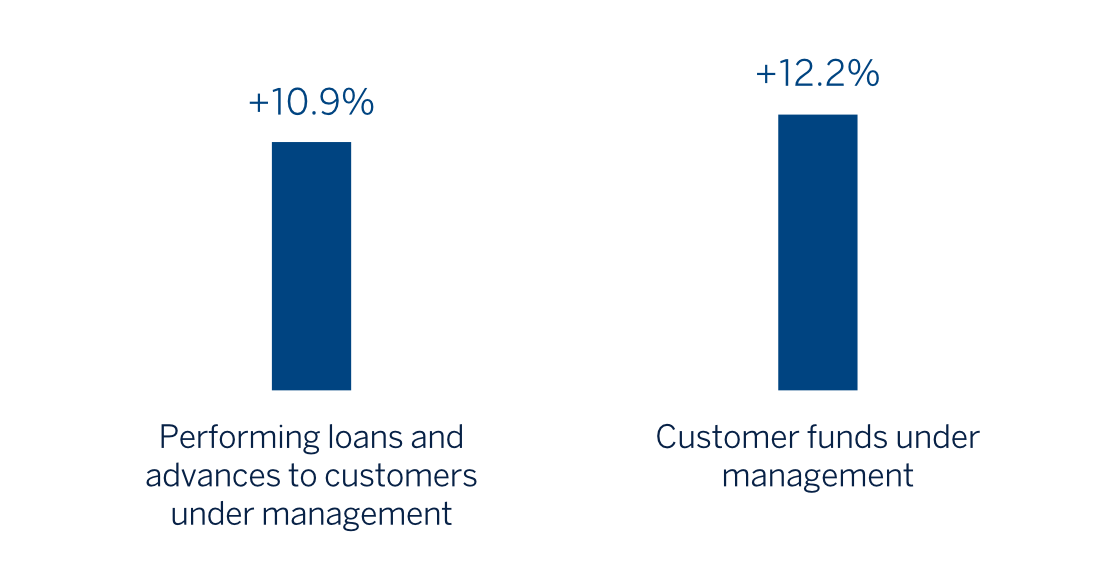
(1) Excluding repos.
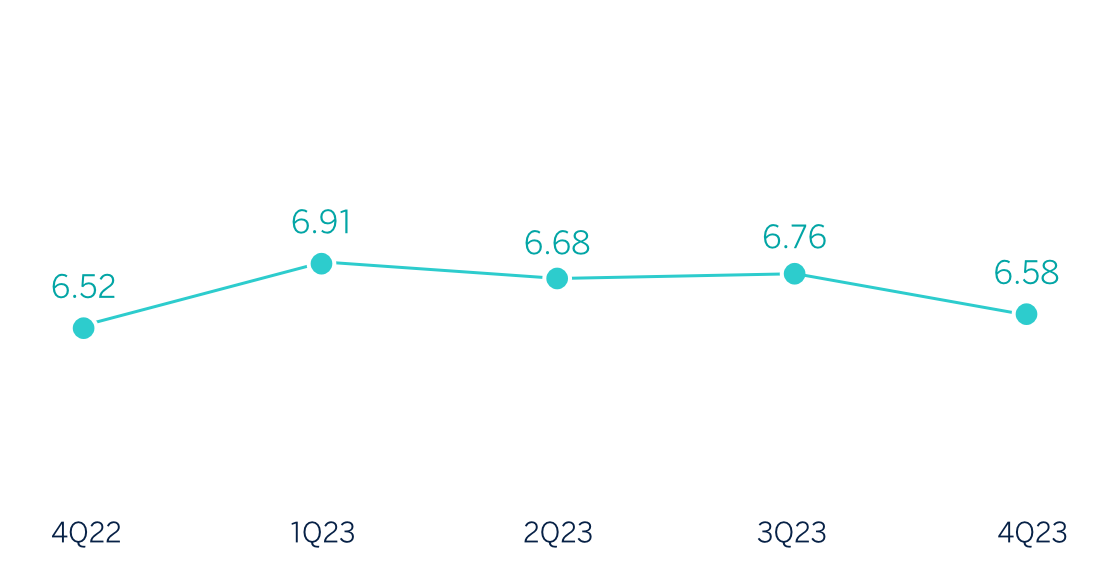
Net interest income / AVERAGE TOTAL ASSETS
(PERCENTAGE AT CONSTANT EXCHANGE RATE)
Operating income
(Millions of euros at constant exchange rate)
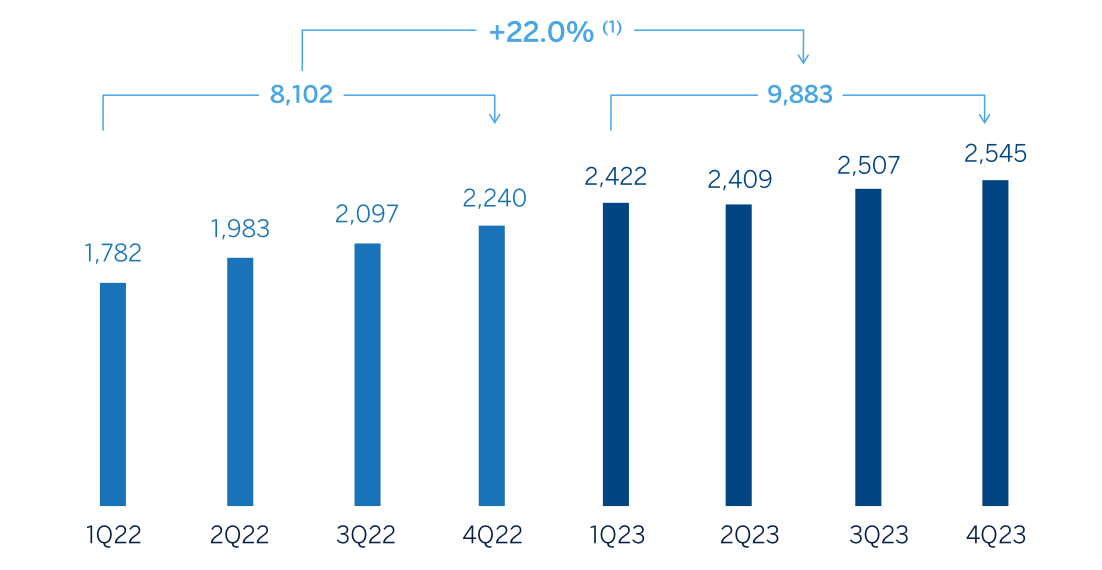
(1) At current exchange rate: +34.7%.
Net attributable profit (LOSS)
(Millions of euros at constant exchange rate)
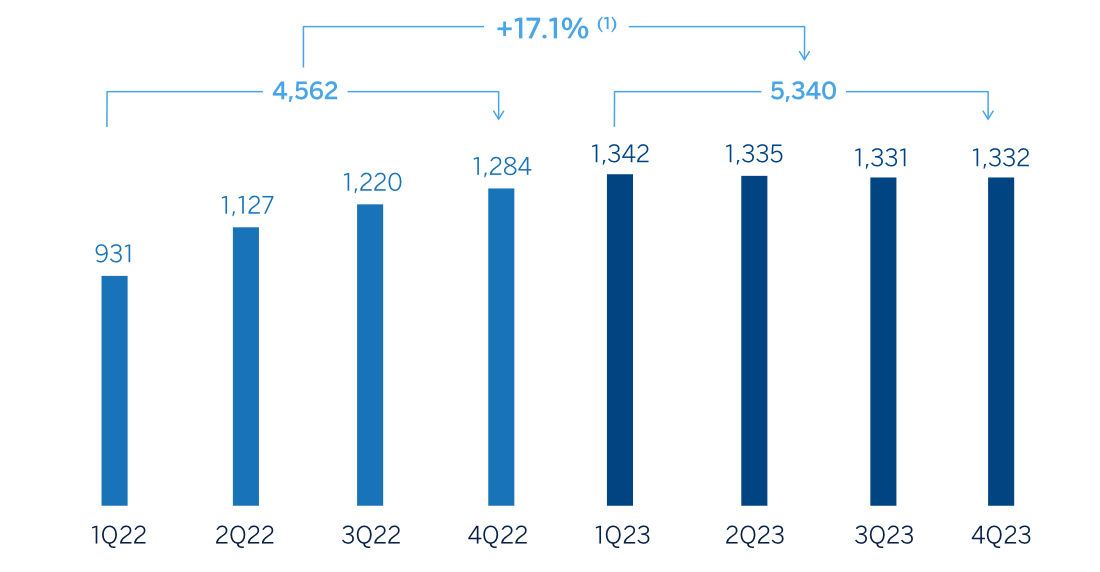
(1) At current exchange rate: +29.3%.
Financial statements and relevant business indicators (Millions of euros and percentage)
| Income statement | 2023 | ∆% | ∆% (1) | 2022(2) |
|---|---|---|---|---|
| Net interest income | 11,054 | 31.9 | 19.5 | 8,378 |
| Net fees and commissions | 2,226 | 37.0 | 24.0 | 1,625 |
| Net trading income | 572 | 30.3 | 18.0 | 439 |
| Other operating income and expenses | 415 | 42.8 | 29.3 | 291 |
| Gross income | 14,267 | 32.9 | 20.4 | 10,734 |
| Operating expenses | (4,384) | 29.1 | 16.9 | (3,397) |
| Personnel expenses | (2,100) | 34.2 | 21.5 | (1,565) |
| Other administrative expenses | (1,816) | 26.6 | 14.6 | (1,434) |
| Depreciation | (469) | 17.9 | 6.8 | (398) |
| Operating income | 9,883 | 34.7 | 22.0 | 7,336 |
| Impairment on financial assets not measured at fair value through profit or loss | (2,499) | 47.6 | 33.7 | (1,693) |
| Provisions or reversal of provisions and other results | (25) | 5.0 | (4.9) | (24) |
| Profit (loss) before tax | 7,359 | 31.0 | 18.6 | 5,620 |
| Income tax | (2,018) | 35.6 | 22.8 | (1,488) |
| Profit (loss) for the period | 5,341 | 29.3 | 17.1 | 4,132 |
| Non-controlling interests | (1) | 29.9 | 17.7 | (1) |
| Net attributable profit (loss) | 5,340 | 29.3 | 17.1 | 4,131 |
| Balance sheets | 31-12-23 | ∆% | ∆% (1) | 31-12-22 (2) |
|---|---|---|---|---|
| Cash, cash balances at central banks and other demand deposits | 10,089 | (23.7) | (31.5) | 13,228 |
| Financial assets designated at fair value | 60,379 | 29.6 | 16.4 | 46,575 |
| Of which: Loans and advances | 5,180 | 243.8 | 208.6 | 1,507 |
| Financial assets at amortized cost | 96,342 | 24.8 | 12.0 | 77,191 |
| Of which: Loans and advances to customers | 88,112 | 23.7 | 11.0 | 71,231 |
| Tangible assets | 2,387 | 21.2 | 8.8 | 1,969 |
| Other assets | 4,293 | 19.5 | 7.3 | 3,593 |
| Total assets/liabilities and equity | 173,489 | 21.7 | 9.3 | 142,557 |
| Financial liabilities held for trading and designated at fair value through profit or loss | 28,492 | 10.3 | (1.0) | 25,840 |
| Deposits from central banks and credit institutions | 8,739 | 98.5 | 78.2 | 4,402 |
| Deposits from customers | 92,564 | 19.1 | 6.9 | 77,750 |
| Debt certificates | 9,719 | 25.3 | 12.5 | 7,758 |
| Other liabilities | 22,756 | 34.0 | 20.3 | 16,976 |
| Regulatory capital allocated | 11,218 | 14.1 | 2.4 | 9,831 |
| Relevant business indicators | 31-12-23 | ∆% | ∆% (1) | 31-12-22 |
|---|---|---|---|---|
| Performing loans and advances to customers under management (3) | 88,688 | 23.5 | 10.9 | 71,788 |
| Non-performing loans | 2,472 | 27.5 | 14.5 | 1,939 |
| Customer deposits under management (3) | 90,926 | 17.9 | 5.8 | 77,117 |
| Off-balance sheet funds (4) | 53,254 | 39.4 | 25.2 | 38,196 |
| Risk-weighted assets | 91,865 | 28.1 | 15.0 | 71,738 |
| Efficiency ratio (%) | 30.7 | 31.7 | ||
| NPL ratio (%) | 2.6 | 2.5 | ||
| NPL coverage ratio (%) | 123 | 129 | ||
| Cost of risk (%) | 2.96 | 2.49 |
(1) At constant exchange rate.
(2) Balances restated according to IFRS 17 - Insurance contracts
(3) Excluding repos.
(4) Includes mutual funds, customer portfolios and other off-balance sheet funds.
Macro and industry trends
The economy has expanded at a relatively high rate, faster than anticipated, during 2023 and, especially during the second half of the year due to the dynamism of private consumption, the resilience of the manufacturing sector, the effects on private investment of the prospects for nearshoring of industrial production outside of China and the impact of higher public spending on the construction sector, in a growth environment in the United States. According to BBVA Research, GDP could grow around 3.4% in 2023 and 2.9% in 2024 (respectively, 20 and 30 basis points above the previous forecasts). Annual inflation eased through 2023, reaching 4.7% in December, and it will probably continue to gradually moderate in the coming quarters, remaining around 3.8% on average in 2024. Policy rates, which stood at 11.25% at the end of 2023, are expected to begin to be cut from the first quarter of 2024, reaching around 9.0% by the end of the year.
With respect to the banking system, at the end of November 2023, the volume of outstanding credit to the non-financial private sector increased by 10.1% in year-on-year terms, with a greater boost from the consumer portfolio (+17.7%), followed by mortgages (+9.2%) and businesses (+7.3%). Growth in total deposits remains at similar levels to those of total credit, with a year-on-year growth of 10.0% at the end of November 2023, with greater dynamism in time deposits (+18.6% year-on-year) than in demand deposits (+6.1 year-on-year). The industry's non-performing loans remained stable at around 2.45% and capital ratios are at comfortable levels.
Unless expressly stated otherwise, all the comments below on rates of change, for both activity and results, will be given at constant exchange rate. These rates, together with changes at current exchange rates, can be found in the attached tables of financial statements and relevant business indicators.
Activity
The most relevant aspects related to the area's activity during 2023 were:
- Lending activity (performing loans under management) grew by 10.9% between January and December 2023. By portfolios, the wholesale portfolio, which includes large companies and public sector, grew by 6.7%, highlighting the dynamism of the business segment (+5.4%), with a positive performance of the public sector segment during the year. On the other hand, the retail portfolio grew at a rate of 14.4%, which supports the trend observed since the beginning of the year. Within this segment, consumer loans grew by 15.8%, credit cards by 21.2%, loans to SMEs by 19.0%, and mortgage loans by 8.7%. The loan portfolio continued to show a favorable diversification, of which 47.6% of the total correspond to the wholesale portfolio and the remaining 52.4% to the retail portfolio.
- Customer deposits under management maintained a positive evolution between January and December of 2023 (+5.8%) despite a high rates environment and the liability cost containment policy implemented by BBVA in Mexico. The growth of off-balance sheet funds was very relevant, particularly in mutual funds, which increased at a rate of 23.7% between January and December 2023.
The most relevant aspects related to the area's activity in the fourth quarter of 2023 were:
- Lending activity (performing loans under management) recorded a quarterly variation of +2.7%, with growth in both the wholesale and retail portfolios (+2.1% and +3.2%, respectively). During the quarter, the dynamism of the retail segment stands out as a result of the strong private consumption, which is supported by the increase in real wages and favored by the end of year campaign that promoted consumption ("Buen Fin"). In the wholesale portfolio, the public sector segment stood out, which increased by 5.5%.
- With regard to the asset quality indicators, the NPL ratio continues to be at comfortable levels and stood at 2.6% at the end of December 2023, which represents a growth of 5 basis points compared to the previous quarter and 10 basis points compared to the end of the year 2022, focused on the retail portfolio and, in the last quarter, affected by the entry of some wholesale borrowers. On the other hand, the NPL coverage ratio decreased to 123% at the end of December 2023, including the impact of the annual review of the model parameters for the losses estimation and, to a lesser extent, the effect of the partial release of additional adjustments not assigned to particular clients or operations due to the performance observed in the portfolios associated with them.
- Customer deposits under management increased compared to the previous quarter (+8.0%), due to higher balances of demand deposits (+10.2%). On the other hand, off-balance sheet funds continued to grow, although at a more moderate rate than in the previous quarter (+2.2%).
Results
In Mexico, BBVA achieved a cumulative net attributable profit of €5,340m by the end of December 2023, representing an increase of 17.1% compared to the previous year, mainly as a result of the significant growth in net interest income, thanks to the strong boost of the activity and the improvement in the customer spread.
The most relevant aspects of the year-on-year changes in the income statement at the end of December 2023 are summarized below:
- Net interest income recorded a significant growth (+19.5%), as a result of strong dynamism of lending activity and a price management efficiency (keeping the cost of deposits contained). Thus, customer spreads associated with a higher bias towards retail portfolio have been successfully maintained.
- Net fees and commissions, boosted by greater transactional banking, continued to increase at double digit (+24.0%), with growth in almost all commissions types, highlighting credit cards, those derived from mutual funds management and from wholesale activity.
- The contribution from NTI increased (+18.0%) mainly as a result of the good performance of Global Markets, with a significant contribution from the foreign currency operations, which offset the bond swap operation associated with balance-sheet management registered in the third quarter of 2023.
- The other operating income and expenses line grew by 29.3%, driven by the evolution of the insurance business.
- Operating expenses increased (+16.9%), with higher personnel expenses due to salary adjustments and an increase in the workforce in a context of strong activity growth, and an increase of general expenses linked to inflation, particularly marketing and technology. Despite the above, the efficiency ratio continued to evolve favorably, with a significant improvement of 92 basis points compared to twelve months earlier.
- Loan-loss provisions increased (+33.7%), mainly due to the higher provisioning needs of the retail portfolio, mainly in consumer and credit cards, partially affected by the strong increase of these segments. On the other hand, the cumulative cost of risk at the end of December 2023 stood at 2.96%, which is practically stable compared to the one registered at the end of September 2023 (+1 basis points).
In the quarter, and excluding the exchange rate effects, BBVA Mexico generated net attributable profit of €1,332m, slightly under the one of the previous quarter (+0.1%). The NTI evolution stands out due to both the bond swap operation included in the third quarter and the Global Markets results in the fourth quarter. On the lower part of the income statement, higher operating expenses were registered, mainly linked to the increase of employee variable compensation and higher general expenses associated with business growth.