

3.3.1. Scope and nature of the market risk measurement and reporting systems
Market risk originates in the possibility that there may be losses in the value of positions held due to movements in the market variables that affect the valuation of financial products and assets in trading activity.
The main risks generated may be classified into the following groups:
- Interest-rate risk: They arise as a result of exposure to the movement in the different interest-rate curves on which there is trading. Although the typical products generating sensitivity to movements in interest rates are money market products (deposits, futures on interest rates, call money swaps, etc.) and the traditional interest-rate derivatives (swaps, interest-rate options such as caps, floors, swaptions, etc.), practically all the financial products have some exposure to movements in interest rates due to the effect of the financial discount in valuing them.
- Equity Risk: Arises as a result of movements in the price of shares. This risk is generated in the spot share price positions, as well as any derivative product whose underlying is a share or equity index. Dividend risk is a sub-risk of equity risk, as an input of any equity option. Its variability may affect the valuation of positions and thus it is a factor that generates risk on the books.
- Currency risk: It occurs due to a movement in the exchange rates of the currencies in which the position is held. As in the case of equity risk, this risk is generated in the spot foreign-currency positions, as well as any derivative product whose underlying is an exchange rate.
- In addition, the quanto effect (transactions where the underlying and the nominal of the transaction are denominated in different currencies) means that in certain transactions where the underlying is not a currency an exchange-rate risk is generated that has to be measured and monitored.
- Credit-spread risk: Credit spread is a market indicator of the credit quality of an issuer. The spread risk takes place due to variations in the levels of spread in corporate or government issuers and affects both bond and credit derivative positions.
- Volatility risk: This occurs as a result of variations in the levels of implied volatility in the price of different market instruments in which derivatives are traded. This risk, unlike the others, is exclusively a component of derivative transactions and is defined as a risk of first-order convexity that is generated in all the possible underlying transactions where there are products with an optionality that require a volatility input for their valuation.
The metrics developed for the control and monitoring of market risk in BBVA Group are aligned with the best market practices and implemented consistently in all the local market risk units.
The standard metric for measuring market risk is Value at Risk (VaR), which indicates the maximum losses that may be incurred in the portfolios at a given confidence level (99%) and time horizon (one day).
Chapter 3.3.4 explains in more detail the risk measurement models used in BBVA Group, focused on internal models approved by the supervisor for BBVA S.A. and BBVA Bancomer for the purpose of calculating the capital for positions in the trading portfolio. Both entities contribute around 80% of the market risk of the Group’s trading portfolio.
For the rest of the geographical areas (South America and Compass), the calculation of capital for the risk positions in the trading portfolio is carried out using the standard model.
The analysis of the entity’s RWA structure shows that 3% corresponds to Market Risk.
3.3.2. Differences in the trading book for the purposes of applying the solvency regulations and accounting criteria
According to the solvency regulations, the trading book shall be made up of all the positions in financial instruments and commodities that the credit institution holds for the purpose of trading or that act as hedging for other elements in this book.
With respect to this book, the rule also refers to the need to establish clearly defined policies and procedures.
For this purpose, regulatory trading book activities defined by the BBVA Group include the positions managed by the Group’s Trading units, for which market risk limits are set and then monitored daily. Moreover, they comply with the other requirements defined in the solvency regulations.
The trading book as an accounting concept is not confined to any business area, but rather follows the true reflection criteria laid down in the accounting regulations. Included in this category are all the financial assets and liabilities originated, acquired or issued with the aim of short-term redemption or repurchase, whether they are part of a jointly-managed portfolio of instruments for which there is evidence of recent action to obtain short-term gains, or derivative instruments that do not comply with the definition of a collateral contract and have not been designated as hedge accounting instruments. Hence, for example, all derivatives are booked as accounting trading book unless they are hedging derivatives, regardless of whether or not they are part of the Trading units’ exposure or they come from other business areas.
3.3.3. Standardized approach
The positions subject to the application of the standardized approach in the calculation of the capital requirements for market risk have a limited weight on the total exposure in the Group’s trading books (around 22%).
The amount of required capital amounts to €968 million, as described in section 2.4 of this document.
With respect to 2014, there is an increase of €27 million in the requirements, due mainly to the increase in the book position.
Below is a presentation of the market risk exposure under the standardized approaches as at December 31, 2015 and 2014:
Table 46.Variations in terms of RWAs for the Market Risk
(Million euros)
| Market Risk | ||
|---|---|---|
| RWA’s Dec 14 |
|
11,823 |
| Effects | Asset size | 333 |
| RWA’s Dec 15 |
|
12,156 |
3.3.4. Internal Models
3.3.4.1. Scope of application
For the purposes of calculating capital as approved by the supervisor, the scope of application of the internal market risk model extends to BBVA S.A. and BBVA Bancomer Trading Floors.
Below are the items on the consolidated balance sheet (for accounting purposes) of the above entities subject to market risk, indicating the part whose measurement falls within the internal VaR models:
Table 47. Trading Book. Items on the balance sheet subject to market risk under internal model
2015
(Million euros)
|
|
Main market risk metrics | |
|---|---|---|
| Items on the Group’s consolidated balance sheet subject to market risk |
VaR | Others* |
| Assets subject to market risk |
|
|
| Trading book | 64,370 | 4,712 |
| Assets at fair value through P/L | - | - |
| Available-for-sale financial assets | 8,234 | 50,088 |
| Of which: Equity instruments of AFS | - | 4,067 |
| Hedging derivatives | 528 | 1,888 |
| Liabilities subject to market risk |
|
|
| Trading book | 42,550 | 6,277 |
| Liabilities at fair value through P/L | - | - |
| Hedging derivatives | 1,128 | 806 |
The trading book subject to the internal model (BBVA S.A. and Bancomer) represents a gross amount of 117,909 million, accounting for 90% of the Group’s total trading book.
3.3.4.2. Features of the models used
The measurement procedures are established in terms of the possible impact of negative market conditions, both under ordinary circumstances and in situations of tension, on the trading book of the Group’s Global Markets units.
The standard metric for measuring market risk is Value at Risk (VaR), which indicates the maximum losses that may be incurred in the portfolios at a given confidence level (99%) and time horizon (one day).
This statistic is widely used in the market and has the advantage of summarizing in a single metric the risks inherent in trading activity, taking into account the relations between all of them, and providing the forecast of the losses that the trading book might incur as a result of price variations in equity markets, interest rates, exchange rates and commodities. In addition, for certain positions, other risks also need to be considered, such as credit spread risk, basis risk, volatility and correlation risk.
With respect to the risk measurement models used in BBVA Group, the supervisor has authorized the use of the internal model for the calculation of capital for the risk positions in the trading book of BBVA, S.A. and BBVA Bancomer which, together, contribute more than 80% of the market risk of the Group’s trading book.
The model used estimates the VaR in accordance with the “historical simulation” methodology, which involves estimating the losses and gains that would have been incurred in the current portfolio if the changing market conditions that occurred over a given period of time were repeated. Based on this information, it infers the maximum foreseeable loss in the current portfolio with a given level of confidence. The model has the advantage of accurately reflecting the historical distribution of the market variables and of not requiring any specific distribution assumption. The historical period used in this model is two years.
VaR figures are estimated following two methodologies:
- VaR without smoothing, which awards equal weight to the daily information for the previous two years. This is currently the official methodology for measuring market risks vis-à-vis limits compliance.
- VaR with smoothing, which weighs more recent market information more heavily. This metric is supplementary to the one above.
VaR with smoothing adapts itself more swiftly to the changes in financial market conditions, whereas VaR without smoothing is, in general, a more stable metric that will tend to exceed VaR with smoothing when the markets show less volatile trends, but be lower when they present upturns in uncertainty.
Furthermore, and following the guidelines established by Spanish and European regulators, BBVA incorporates additional VaR metrics to fulfill the regulatory requirements issued by the supervisor for the purpose of calculating capital for the trading book. Specifically, the new measures incorporated in the Group since December 2011 (which follow the guidelines set out by Basel 2.5) are as follows:
- VaR: In regulatory terms, the charge for VaR Stress is added to the charge for VaR and the sum of both (VaR and VaR Stress) is calculated. This quantifies the loss associated with movements in the risk factors inherent in market operations (interest rate, FX, RV, credit, etc.).
Both VaR and VaR Stress are rescaled by a regulatory multiplier set at three and by the square root of ten to calculate the capital charge.
- Specific Risk: IRC. Quantification of non-performing risk and downgrade risk in the rating of some positions held in the portfolio, such as bonds and credit derivatives. The specific risk capital for IRC is a charge used exclusively for geographical areas with an approved internal model (BBVA S.A. and Bancomer).
The capital charge is determined based on the associated losses (at 99.9% over a time horizon of 1 year under the assumption of constant risk) resulting from the rating migration and/or Exposures in default of the asset’s issuer. Also included is the price risk in sovereign positions for the indicated items.
- Specific Risk: Securitizations and Correlation Portfolios. Capital charge for the securitizations and the correlation portfolio for potential losses associated with the rating level of a given credit structure (rating). Both are calculated using the standardized approach. The perimeter of the correlation portfolios is referred to FTD-type market operations and/or market CDO tranches, and only for positions with an active market and hedging capacity.
Validity tests are performed periodically on the risk measurement models used by the Group. They estimate the maximum loss that could have been incurred in the positions assessed with a certain level of probability (backtesting), as well as measurements of the impact of extreme market events on risk positions (stress testing).
Backtesting is performed at the trading desk level as an additional control measure in order to carry out a more specific monitoring of the validity of the measurement models.
The current market risk management structure includes the monitoring of limits. This monitoring consists of a system of limits based on VaR (Value at Risk) and economic capital (based on VaR measurements) and VaR sub-limits, as well as stop-loss limits for each of the Group’s business units. The global limits are proposed by the market risk unit andapproved by the Executive Committee on an annual basis, once they have been submitted to the GRMC and the Risk Committee. This limits structure is developed by identifying specific risks by type, trading activity and trading desk. Moreover, the market risk unit maintains consistency between the limits. The control structure in place is supplemented by limits on loss and a system of alert signals to anticipate the effects of adverse situations in terms of risk and/or result.
3.3.4.2.1. Market risk evolution in 2015
In 2015, the average VaR was €24 million, slightly higher than in 2014, with a maximum level for the year on March 4 of €30 million.
The following values (maximum, minimum, average and at year end within the statement period) are given based on the different model types used for calculating the capital requirement:
Table 48. VaR by model types
(Million euros)
| IMA values for trading portfolios (2015) | ||
|---|---|---|
| VaR (10 day 99%) | ||
| 1 | Maximum value | 48,635 |
| 2 | Average value | 36,116 |
| 3 | Minimum value | 23,863 |
| 4 | Period value | 36,849 |
| Stressed VaR (10 day 99%) | ||
| 5 | Maximum value | 79,703 |
| 6 | Average value | 50,169 |
| 7 | Minimum value | 34,156 |
| 8 | Period value | 46,884 |
| Incremental Risk Charge (99.9%) | ||
| 9 | Maximum value | 151,841 |
| 10 | Average value | 98,104 |
| 11 | Minimum value | 48,620 |
| 12 | Period value | 65,843 |
The following tables show VaR without smoothing by risk factor for the Group:
Chart 19. Trading Book. Trends in VaR without smoothing

Table 49.Trading Book. VaR without smoothing by risk factors
(Million euros)
| VaR by risk factors | Interest-rate and spread risk |
Exchange- rate risk |
Equity risk | Vega/ correlation risk |
Diversification effect |
Total |
|---|---|---|---|---|---|---|
| 2015 |
|
|
|
|
|
|
| Average VaR for the period |
|
|
|
|
|
24 |
| Maximum VaR for the period | 32 | 5 | 3 | 9 | (18) | 30 |
| Minimum VaR for the period | 20 | 6 | 3 | 9 | (17) | 21 |
| VaR at end of period | 21 | 9 | 3 | 11 | (20) | 24 |
| 2014 |
|
|
|
|
|
|
| Average VaR for the period |
|
|
|
|
|
23 |
| Maximum VaR for the period | 31 | 6 | 4 | 10 | (22) | 28 |
| Minimum VaR for the period | 24 | 4 | 3 | 11 | (23) | 20 |
| VaR at end of period | 30 | 5 | 2 | 7 | (20) | 25 |
By type of market risk assumed by the Group’s trading book, the main risk factor in the Group continues to be the one linked to interest rates, with a weight of 48% of the total at the end of 2015 (this figure includes the spread risk), with the relative weight dropping compared to the close of 2014 (67%). Foreign exchange risk accounts for 21%, increasing their proportion compared with December 2014 (12%), while equity risk and volatility and correlation risk have increased, with a weight of 32% at the close of 2015 (vs. 20% at the end of 2014).
In accordance with article 455 e) of the solvency regulations –corresponding to the breakdown of information on internal market risk models–, the elements comprising the capital requirements referred to in articles 364 and 365 of those regulations are presented below.
Table 50. Trading Book. Market risk. Regulatory capital
2015
(Million euros)
|
|
Regulatory Capital | ||
|---|---|---|---|
| Type of Risk | Item | Spain | Mexico |
| Riesgo Mercado BIS II | VaR/CeR | 91 | 99 |
| Riesgo mercado BIS II.5 | VaR Stress | 137 | 313 |
| IRC | 64 | 42 | |
| of which securitizations | 14 | 12 | |
| of which correlation | 76 | 0 | |
| Total Market Risk |
|
383 | 466 |
2014
(Million euros)
|
|
Regulatory Capital | ||
|---|---|---|---|
| Type of Risk | Item | Spain | Mexico |
| Riesgo Mercado BIS II | VaR/CeR | 102 | 83 |
| Riesgo mercado BIS II.5 | VaR Stress | 140 | 209 |
| IRC | 95 | 82 | |
| of which securitizations | 23 | 7 | |
| of which correlation | 70 | - | |
| Total Market Risk |
|
337 | 375 |
The change is due mainly to the increase in exposure in internal models, specifically an increase in positioning in the bond portfolio and a slight increase in credit spreads.
3.3.4.2.2. Stress testing
All the tasks associated with stress, methodologies, scenarios of market variables or reports are undertaken in coordination with the Group’s Risk Areas.
Different stress test exercises are performed on the BBVA Group’s trading portfolios. Both local and global historical scenarios are used, which replicate the behavior of a past extreme event, for example, the collapse of Lehman Brothers or the Tequila crisis. These stress exercises are supplemented with simulated scenarios which aim to generate scenarios that have a significant impact on the different portfolios, but without being restricted to a specific historical scenario.
Lastly, for certain portfolios or positions, fixed stress test exercises are also prepared that have a significant impact on the market variables that affect those positions.
Historical scenarios
The base historical stress scenario in the BBVA Group is that of Lehman Brothers, whose sudden collapse in September 2008 had a significant impact on the behavior of financial markets at a global level. The most relevant effects of this historical scenario include:
1) Credit shock: reflected mainly in the increase in credit spreads and downgrades of credit ratings.
2) Increased volatility in most financial markets (giving rise to much variation in the prices of the different assets (currencies, equity, debt).
3) Liquidity shock in the financial systems, reflected in major fluctuations in interbank curves, particularly in the shortest sections of the euro and dollar curves.
Table 51. Trading Book. Impact on earnings in Lehman scenario
(Million euros)
|
|
Impact on earnings in Lehman scenario | |
|---|---|---|
|
|
31/12/2015 | 31/12/2014 |
| GM Europe, NY y Asia | –30 | –29 |
| GM Bancomer | –37 | –50 |
| GM Argentina | 0 | –2 |
| GM Chile | –4 | –5 |
| GM Colombia | –4 | –2 |
| GM Perú | –6 | –13 |
| GM Venezuela | –5 | –3 |
Simulated scenarios
Unlike the historical scenarios, which are fixed and, thus, do not adapt to the composition of portfolio risks at any given time, the scenario used to perform the economic stress exercises is based on the Resampling method. This methodology is based on the use of dynamic scenarios that are recalculated on a regular basis according to what the main risks in the trading portfolios are. A simulation exercise is carried out in a data window wide enough to include different stress periods (data is taken from 1-1-2008 until today) by the re-sampling of historical observations. This generates a distribution of gains and losses that allows an analysis of the most extreme events in the selected historical window.
The advantage of this methodology is that the stress period is not pre-established, but rather a function of the portfolio held at any given time; and the large number of simulations (10,000) means that the expected shortfall analysis can include richer information than that available in scenarios included in the VaR calculation.
The main features of this methodology are as follows:
a) The simulations generated follow the data correlation structure.
b) It provides flexibility in terms of including new risk factors.
c) It enables a great deal of variability to be introduced (which is desirable for considering extreme events).
The impact of the stress tests by simulated scenarios (Stress VaR 95% at 20 days, Expected Shortfall 95% at 20 days and Stress VaR 99% at 1 day) is shown below.
Table 52. Trading Book. Stress resampling
(Million euros)
|
|
Europe | Bancomer | Peru | Venezuela | Colombia | Chile |
|---|---|---|---|---|---|---|
| Expected Shortfall | (49) | (43) | (5) | (13) | (6) | (9) |
| 2015 | Stress VaR 95 20 D |
Expected shortfall 95 20 D |
Stress Period | Stress VaR 1D 99% Resampling |
|---|---|---|---|---|
| TOTAL | –67.7 | –91.9 | 08/05/2008-25/09/2012 | –28.1 |
| GM Europa, NY and Asia | –36.9 | –49.0 | 26/10/2010-25/09/2012 | –15.0 |
| GM Bancomer | –30.8 | –42.8 | 08/05/2008-05/05/2010 | –13.1 |
3.3.4.2.3. Backtesting
The Group’s market risk measurement model needs to have a back-testing or self-validation program, which assures that the risk measurements being made are suitable.
The internal market risk model is validated on a regular basis by backtesting in both BBVA S.A. and Bancomer.
The purpose of backtesting is to validate the quality and accuracy of the internal model used by the BBVA Group to estimate the maximum daily loss for a portfolio, for a 99% confidence level and a time horizon of 250 days, by comparing the Group’s results and the risk measures generated by the model.
These tests confirmed that the internal market risk model used by BBVA S.A. and Bancomer is adequate and accurate. Two types of backtesting were performed in 2015:
a. “Hypothetical” backtesting: the daily VaR is compared with the results obtained without taking into account the intraday results or the changes in the portfolio’s positions. This validates that the market risk metric is appropriate for the end-of-day position.
b. “Real” backtesting: the daily VaR is compared with the total results, including intraday operations, but deducting any possible allowances or commissions generated. This type of backtesting incorporates the intraday risk in the portfolios.
In addition, each of these two types of backtesting was performed at risk factor or type of business level, thus providing a more in-depth comparison of results versus risk measures.
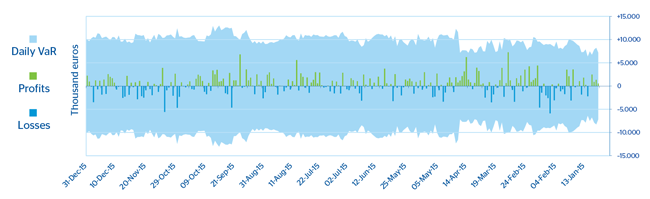
Chart 20. Trading Book. Validation of the Market Risk Measurement model for BBVA, S.A. (Hypothetical backtesting)
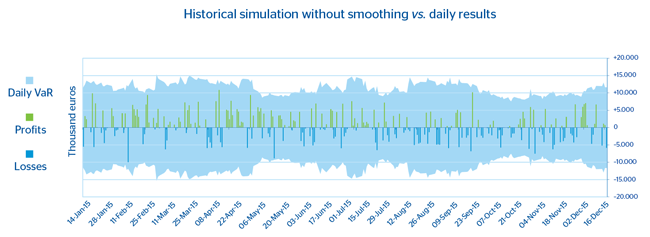
Chart 21. Trading Book. Validation of the Market Risk Measurement model for BBVA, S.A. (Real backtesting)
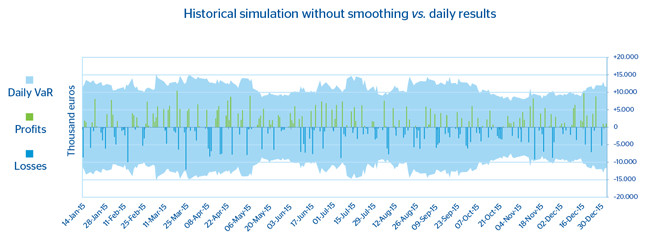
Chart 22. Trading Book. Validation of the Market Risk Measurement model for BBVA Bancomer (Hypothetical backtesting)

Chart 23. Trading Book. Validation of the Market Risk Measurement model for BBVA Bancomer (Real backtesting)
3.3.4.3. Characteristics of the risk management system
The Group has a risk management system in place which is appropriate for the volume of risks managed, complying with the functions set out in the Corporate Policy on Market Risks in Market Activities.
The risk units must have:
- A suitable organization (means, resources and experience) in line with the nature and complexity of the business.
- Segregation of functions and independence in decision-making.
- Performance under integrity and good governance principles, driving the best practices in the industry and complying with the rules, both internal (policies, procedures) and external (regulation, supervision, guidelines).
- The existence of channels for communication with the relevant corporate bodies at local level according to their corporate governance system, as well as with the Corporate Area.
- All market risks existing in the business units that carry out their activity in markets must be adequately identified, measured and assessed, and procedures must be in place for their control and mitigation.
- The Global Market Risk Unit (GMRU), as the unit responsible for managing market risk at Group level, must promote the use of objective and uniform metrics for measuring the different types of risks.