Balance sheet and business activity
The following table presents the changes in the Group's balance sheet and activity, from the opening balance calculated after the initial implementation of IFRS 9 to the close of the first quarter of 2018. This balance sheet includes the new categories included in the above standard.
With respect to the Group's activity, its most significant aspects during the period are summarized below:
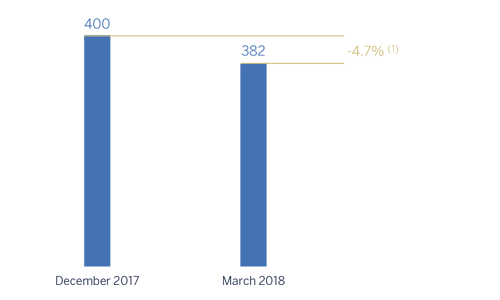
- Reduction of the loans and advances to customers (gross), largely due to changes in the exchange rate against the euro in the geographic areas in which BBVA operates. The United States once more posted a slight increase in lending, the trend in Mexico was flat and there was growth in the other areas (Turkey and South America).
- Non-performing loans fell once more, above all thanks to an improvement in Spain and the United States.
- In deposits from customers there was a slight decrease mainly due to the decline in time deposits.
- In off-balance-sheet funds, investment funds continued with a positive evolution.
Consolidated balance sheet (Million euros)
| 31-03-18 | ∆% | 01-01-18 | |
|---|---|---|---|
| Cash, cash balances at central banks and other demand deposits | 43,167 | 1.1 | 42,680 |
| Financial assets held for trading | 94,745 | 3.1 | 91,854 |
| Non-trading financial assets mandatorily at fair value through profit or loss | 4,360 | 0.5 | 4,337 |
| Financial assets designated at fair value through profit or loss | 1,330 | 30.5 | 1,019 |
| Financial assets at fair value through accumulated other comprehensive income | 59,212 | (4.8) | 62,202 |
| Financial assets at amortized cost | 417,646 | (1.0) | 421,712 |
| Loans and advances to central banks and credit institutions | 17,751 | 0.2 | 17,713 |
| Loans and advances to customers | 367,986 | (1.6) | 374,012 |
| Debt securities | 31.909 | 6.4 | 29,986 |
| Investments in subsidiaries, joint ventures and associates | 1,395 | (12.2) | 1,589 |
| Tangible assets | 6,948 | (3.4) | 7,191 |
| Intangible assets | 8,199 | (3.1) | 8,464 |
| Other assets | 48,439 | 0.1 | 48,368 |
| Total assets | 685,441 | (0.6) | 689,414 |
| Financial liabilities held for trading | 86,767 | 7.4 | 80,783 |
| Other financial liabilities designated at fair value through profit or loss | 6,075 | 10.6 | 5.495 |
| Financial liabilities at amortized cost | 497,298 | (1.7) | 506,118 |
| Deposits from central banks and credit institutions | 63,031 | (8.6) | 68,928 |
| Deposits from customers | 360,213 | (1.0) | 363,689 |
| Debt certificates | 60,866 | (1.3) | 61,649 |
| Other financial liabilities | 13,188 | 11.3 | 11,851 |
| Liabilities under insurance contracts | 9,624 | 4.3 | 9,223 |
| Other liabilities | 33,854 | (4.3) | 35,392 |
| Total liabilities | 633,618 | (0.5) | 637,010 |
| Non-controlling interests | 6,592 | (5.9) | 7,008 |
| Accumulated other comprehensive income | (9,201) | 3.5 | (8,889) |
| Shareholders’ funds | 54,432 | 0.3 | 54,285 |
| Total equity | 51,823 | (1.1) | 52,404 |
| Total liabilities and equity | 685,441 | (0.6) | 689,414 |
| Memorandum item: | |||
| Guarantees gives | 47,519 | (0.3) | 47,668 |
Loans and advances to customers (Million euros)
| IFRS 9 | IAS 39 | |||||
|---|---|---|---|---|---|---|
| 31-03-18 | ∆% | 31-12-17 | ||||
| Public administration | 28,176 | (8.0) | 30,626 | |||
| Individuals | 169,541 | 3.5 | 163,873 | |||
| Residential mortgages | 101,670 | (9.4) | 112,274 | |||
| Consumer | 22,449 | (30.0) | 32,092 | |||
| Credit cards | 13,263 | (2.7) | 13,630 | |||
| Other business | 32,159 | n.s | 5,877 | |||
| Business | 165,398 | (11.3) | 186,479 | |||
| Non-performing loans | 18,569 | (4.2) | 19,390 | |||
| Loans and advances to customers (gross) | 381,683 | (4.7) | 400,369 | |||
| Loan-loss provisions | (13,697) | 7.4 | (12,748) | |||
| Loans and advances to customers | 367,986 | (5.1) | 387,621 | |||
Loans and advances to customers (gross)
(Billion euros)

(1) At constant exchange rates: -3.7%.
Customer funds
(Billion euros)

(1) At constant exchange rates: -3.6%.
Customer funds
(Million euros)
| NIF 9 | NIC 39 | |||||
|---|---|---|---|---|---|---|
| 31-03-18 | ∆% | 31-12-17 | ||||
| Deposits from customers | 360,213 | (4.3) | 376,379 | |||
| Of which current accounts | 239,358 | (0.6) | 240,750 | |||
| Of which time deposits | 113,469 | (2.0) | 115,761 | |||
| Other customer funds | 130,440 | (3.3) | 134,906 | |||
| Mutual funds and investment companies | 64,327 | 5.6 | 60,939 | |||
| Pension funds | 33,604 | (1.1) | 33,985 | |||
| Other off-balance sheet funds | 2,445 | (20,7) | 3,081 | |||
| Customer portfolios | 30,064 | (18.5) | 36,901 | |||
| Total customer funds | 490,653 | (4.0) | 511,285 | |||