Anexo
Corporate & Investment Banking
Highlights
- The context of pressure on margins and excess liquidity is maintained.
- Slight decline in quarter activity, in lending and funding.
- Earnings affected by lower activity and supported by cost containment.
- Stability of risk indicators.
Business activity (1)
(Year on year change at constant exchange rates. Data as of 31-03-2018)
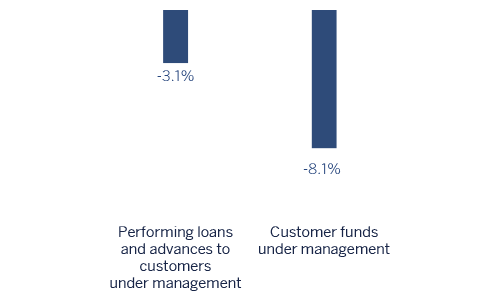
(1) Excluding repos.
Gross income/ATAs
(Percentage. Constant exchange rates)

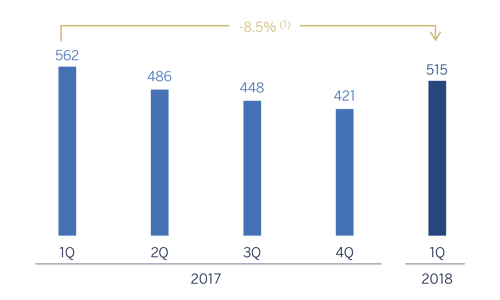
Operating income
(Million euros at constant exchange rates)
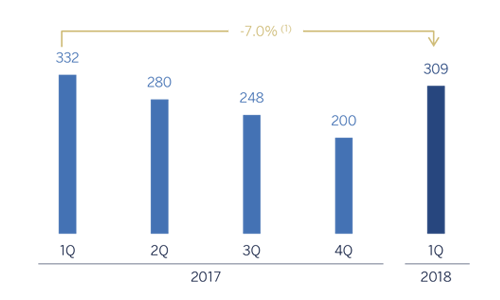
Net attributable profit
(Million euros at constant exchange rates)
(1) At current exchange rate: -15.6%.
(1) A tipos de cambio corrientes: -13,1%.
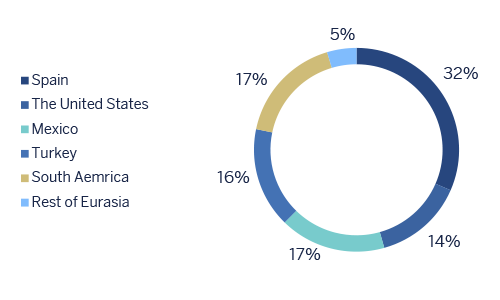
Breakdown of performing loans under management (1)
(31-03-2018)
(1) Excluding repos.
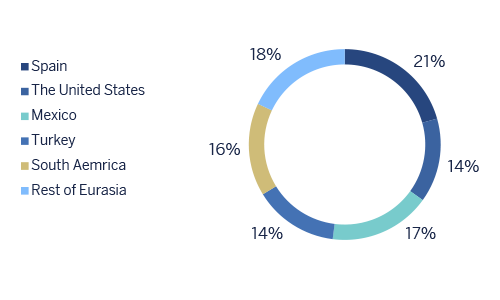
Breakdown of customer funds under management (1)
(31-03-2018)
(1) Excluding repos.
Financial market trends
The first quarter of the year was marked by an upturn in implied stock-market volatility. This situation led to synchronized falls in equity markets, but contagion to other risk assets was limited. Volatility has slowed since then, but it has not reversed. This could indicate that the low volatility environment of recent years is now a thing of the past.
In this context, the Federal Reserve (Fed) and the European Central Bank (ECB) have continued to make very cautious progress in normalizing their política monetaria, prompting slight upticks in sovereign debt yields in the United States, and to a lesser extent, in Europe. In contrast risk premiums have narrowed in the European periphery and emerging countries. In the case of Spain, the spread in 10-year yields with Germany moderated to levels below 70 basis points after the rating agencies Fitch and S&P upgraded Spanish debt by one notch to A-.
The euro appreciated against the dollar, which was hampered by doubts arising from the new trade policy and fiscal expansion in the United States. In general, emerging currencies appreciated against the dollar, except for the Argentine peso and the Turkish lira. All of them, however, except for the Mexican and Colombian peso, depreciated against the euro.
Activity
All the comments below on rates of change for both activity and earnings, will be given at constant exchange rate, unless expressly stated otherwise. These rates, together with changes at the current exchange rate, can be seen in the attached tables of financial statements and relevant business indicators.
The market context remains unchanged, with margins squeezed and excess liquidity. Lending (performing loans under management) has remained flat since March 2017 (up 0.1%). However, there has been a decrease of 2.2% year-to-date. Performance has varied by geographic area: outstanding growth in the Rest of Europe, Asia, Mexico, Argentina and Chile, and a decline in Spain, the United States, Colombia and Peru. With respect to asset quality, the NPL ratio stood at 0.6% at the close of March 2018, while the NPL coverage ratio stood at 93%. The cost of risk was -0.04%.
Customer funds also declined in the quarter by 10.5%, with gains in Spain and Turkey that were not offset by the reduction observed in the United States, Mexico, South America and the Rest of Eurasia.
From the point of view of the mergers & acquisitions (M&A) business, activity in Spain and Portugal continued in line with the positive trends which began in 2017, driving figures close to their highest levels in the last five years. Despite a slight slowdown with respect to the first quarter of the previous year, the market is expected to continue to grow due to the availability of liquidity, good financing conditions and the economic growth in Spain.
In the Equity Capital Markets (ECM) UNIT, BBVA acted as global coordinator in the Metrovacesa IPO, the only operation one completed in Spain in the first quarter of the year. The Group was also Agent Bank for the Repsol scrip dividend.
Lastly, BBVA continued to demonstrate its leadership in the area of green loans, with 11 deals carried out in the last twelve months, making it the most active financial institution in this field in the world. These 11 deals amounted to a total of €8.9 billion in a market of some €15.5 billion (approximately 57% of the total).
Results
CIB registered a net attributable profit in the quarter of €309m, up 54.2% on the previous quarter and down 7.0% on the first quarter of 2017. The highlights of the year-on-year changes in the income statement in this area are summarized below:
The decline in net interest income and net fees and commissions (-1.1% on year-on-year terms) due to a lower volume of lending than in 2017.
Good performance from Global Markets, thanks to the increase in recurring activity with customers and an adequate risk management arising from these transactions. Thus, with respect to the first quarter of 2017, the gross income increases up to 11.5%.
Cumulative operating expenses declined by 1.3% on a year-on-year comparison, and a 5.1% with respect to the first quarter of 2017. They key elements were once more personnel and discretionary expenses growth and the increase in costs associated with investment in technology.
Financial statements and relevant business indicators (Million euros and percentage)
| IFRS 9 | IAS 39 | ||||
|---|---|---|---|---|---|
| Income statement | 1Q 18 | ∆% | ∆%(1) | 1Q 17 | |
| Net interest income | 331 | (4.9) | 3.5 | 348 | |
| Net fees and commissions | 180 | (15.7) | (8.5) | 214 | |
| Net trading income | 270 | (12.4) | (6.4) | 308 | |
| Other income/expenses | (8) | n.s. | n.s. | 18 | |
| Gross income | 773 | (12.9) | (6.2) | 888 | |
| Operating expenses | (258) | (7.0) | (1.3) | (278) | |
| Personnel expenses | (121) | (9.8) | (5.2) | (135) | |
| Other administrative expenses | (110) | (6.9) | 1.0 | (118) | |
| Depreciation | (27) | 6.6 | 8.5 | (26) | |
| Operating income | 515 | (15.6) | (8.5) | 610 | |
| Impaiment on financial assets not measured at fair value through profit or loss (net) | 10 | n.s. | n.s. | (10) | |
| Provisions or reversal of provisions and other results | (26) | 66.1 | 68.9 | (15) | |
| Profit/(loss) before tax | 500 | (14.6) | (7.6) | 585 | |
| Income tax | (133) | (14.1) | (7.8) | (155) | |
| Profit/(loss) for the year | 366 | (14.8) | (7.6) | 430 | |
| Non-controlling interests | (58) | (23.0) | (10.2) | (75) | |
| Net attributable profit | 309 | (13.1) | (7.0) | 355 | |
| IFRS 9 | IAS 39 | ||||
|---|---|---|---|---|---|
| Balance sheets | 31-03-18 | ∆% | ∆%(1) | 31-12-17 | |
| Cash, cash balances at central banks and other demand deposits | 3,403 | (19.0) | (16.4) | 4.200 | |
| Financial assets designated at fair value | 101,640 | 39.5 | 38.3 | 72.878 | |
| of which Loans and advances | 24,265 | n.s. | n.s. | 648 | |
| Financial assets at amortized cost | 63,090 | (32.8) | (32.4) | 93.948 | |
| of which loans and advances to customers | 55,238 | (18.2) | (17.6) | 67.529 | |
| Inter-area positions | - | - | - | - | |
| Tangible assets | 32 | (7.1) | (7.2) | 35 | |
| Other assets | 3,221 | 37.5 | 38.2 | 2,342 | |
| Total assets/liabilities and equity | 171,386 | (1.2) | (1.1) | 173,403 | |
| Financial liabilities held for trading and designated at fair value through profit or loss | 90,116 | 83.7 | 83.3 | 49,060 | |
| Deposits from central banks and credit institutions | 14,597 | (67.9) | (68.2) | 45,792 | |
| Deposits from customers | 39,159 | (19.7) | (19.2) | 48,792 | |
| Debt certificates | 898 | 71.7 | 72.1 | 523 | |
| Inter-area positions | 17,596 | (18.9) | (17.7) | 21,687 | |
| Other liabilities | 5,309 | 35.9 | 34.4 | 3,908 | |
| Economic capital allocated | 3,711 | (7.4) | (7.0) | 4,007 | |
| IFRS 9 | IAS 39 | ||||
|---|---|---|---|---|---|
| Relevant business indicators | 31-03-18 | ∆% | ∆%(1) | 31-12-17 | |
| Performing loans and advances to customers under management (2) | 55,184 | (2.0) | (1.1) | 56,315 | |
| Non-performing loans and guarantees given | 543 | (7.0) | (6.8) | 584 | |
| Customer deposits under management (2) | 39,035 | (11.5) | (10.8) | 44,095 | |
| Off-balance sheet funds (3) | 1,366 | 0.6 | 1.1 | 1,357 | |
| Efficiency ratio (%) | 33.4 | 34.1 | |||
| NPL ratio (%) | 0.6 | 0.7 | |||
| NPL coverage ratio (%) | 93 | 112 | |||
| Cost of risk (%) | (0.04) | 0.24 | |||
- (1) Figures at constant exchange rates.
- (2) Excluding repos.
- (3) Includes mutual funds, pension funds and other off-balance-sheet funds.