The United States
Highlights
- Lending growth supported by consumer loans.
- Positive performance of net interest income. Lower provisions.
- Improvement of efficiency.
- Net attributable profit affected by the tax reform at the end of 2017.
Business activity (1)
(Year-on-year change at constant exchange rate. Data as of 31-03-2018)
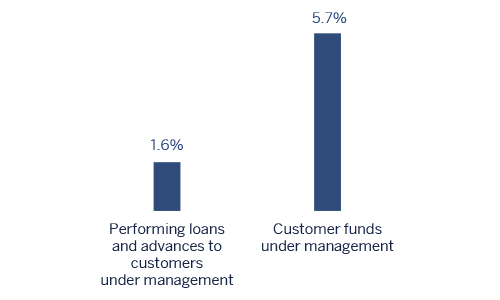
(1) Excluding repos.
Net interest income/ATAs
(Percentage. Constant exchange rate)

Operating income
(Million euros at constant exchange rate)

(1) At current exchange rate: +22.9%.
Net attributable profit
(Million euros at constant exchange rate)
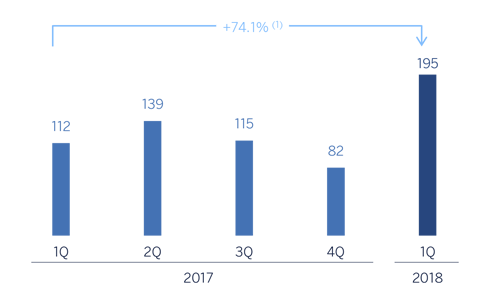
(1) At current exchange rate: +11.3%.
Breakdown of performing loans under management (1)
(31-03-2018)

Breakdown of customer funds under management (1)
(31-03-2018)

(1) Excluding repos.
(1) Excluding repos.
Macro and industry trends
According to the latest available information from the Bureau of Economic Analysis (BEA), U.S. GDP grew by 2.3% in 2017, driven by investment and, above all, by strong private consumption. Increased consumer confidence had a positive impact on the figures for business activity and foreign trade at the start of 2018, adding to the positive short-term effects of a more expansive fiscal policy
Stronger domestic demand and the depreciation of the dollar worldwide have driven prices and wages up, although inflation still remains under control. Against this backdrop, the Federal Reserve (Fed) has continued with the process of normalizing monetary policy, with further hikes in the base rate to 1.75%. The trend of gradual normalization is expected to continue in 2018. Despite the fact that economic fundamentals early in the year could suggest the dollar should show gains, recent increased uncertainty and financial volatility, which may be associated with fears of a higher fiscal deficit and recent protectionist measures, continue to depreciate the value of the U.S. currency.
The general situation of the country's banking system is still very positive. According to the latest available data from the Fed through February 2018, the total volume of bank credit in the system increased by 3.7% over the last twelve months, with growth in all the main portfolios. At the same time, deposits fell slightly year-on-year by 1.3%. Lastly, non-performing loans remained under control, with an NPL ratio of 1.8% at the end of the fourth quarter of 2017, practically the same figure as in the previous quarter.
Activity
All the comments below on rates of change, for both activity and earnings, will be given at constant exchange rate, unless expressly stated otherwise. These rates, together with changes at current exchange rate, can be seen in the attached tables of financial statements and relevant business indicators.
Lending activity in the area (performing loans under management) it remains stable (-0.2% in the quarter, + 1.6% yearon-year). By portfolio, higher interest rates led to a decline in mortgages and loans to developers (construction real estate). In contrast, consumer loans , which have higher margins and are therefore more profitable, increased by 7.4% since the end of the previous year (+13.6% year-on-year).
With respect to asset quality,risk indicators in the area continued to be solid. The NPL ratio remained at 1.2%. The coverage ratio closed the quarter at 98% (104% as of 31-Dec-2017).
With regard to the Customer depositsunder management, they showed a decrease of 1.1% in comparison to the figure of December 2017, although they experienced a year-on-year increase of 5.7%, thanks to deposit-gathering campaigns launched in 2017.
Results
The United States generated a cumulative net attributable profit through March 2018 of €195m, up 74.1% on the same period last year, due mainly to the increase in net interest income, lower provisions and lower tax expenses as a result of a reduction in the effective tax rate following the tax reform approved in the last quarter of 2017. Also worth noting are the following:
- Net interest income continued to perform positively, with the cumulative figure up by 15.0% year-on-year and 3.6% with respect to the fourth quarter of 2017. This was due partly to the Fed's interest-rate hikes, but also the strategic measures adopted by BBVA Compass to improve loan yields (boosting consumer finance) and reduce the cost of deposits (improvement in the deposit mix and wholesale funding).
- Net fees and commissions declined by 2.4% with respect to the same quarter of last year, due to a lower sums from markets, investment banking and money transfers; However, there was an increase of 1.1% over the last three months.
- NTI was down by 14.6% on the figure for the first three months of the previous year, due to lower gains from exchange rates and derivatives.
- Improvement in operating expenses, which fell by 3.2% over the quarter, basically due that in the previous quarter included additional expenses for digital transformation.
- Impairment losses on financial assets fell by 67.9% in the last twelve months and 52.7% over the quarter, due to the lower provisioning requirements in retail portfolios affected by hurricanes in 2017. As a result, the cumulative cost of risk through 31-Mar-2018 declined to 0.16%.
Financial statements and relevant business indicators
(Million euros and percentage)
| IFRS 9 | IAS 39 | ||||
|---|---|---|---|---|---|
| Income statement | 1Q 18 | ∆% | ∆%(1) | 1Q 17 | |
| Net interest income | 524 | (0.4) | 15.0 | 526 | |
| Net fees and commissions | 148 | (15.4) | (2.4) | 175 | |
| Net trading income | 24 | (26.0) | (14.6) | 33 | |
| Other income/expenses | 3 | n.s. | n.s. | (12) | |
| Gross income | 699 | (3.2) | 11.8 | 722 | |
| Operating expenses | (435) | (7.1) | 7.3 | (468) | |
| Personnel expenses | (252) | (6.5) | 8.0 | (269) | |
| Other administrative expenses | (141) | (6.3) | 8.2 | (150) | |
| Depreciation | (42) | (12.9) | 0.6 | (48) | |
| Operating income | 264 | 4.0 | 20.0 | 254 | |
| Impaiment on financial assets not measured at fair value through profit or loss | (20) | (72.2) | (67.9) | (73) | |
| Provisions or reversal of provisions and other results | 8 | n.s. | n.s. | (4) | |
| Profit/(loss) before tax | 251 | 42.3 | 64.3 | 177 | |
| Income tax | (56) | 18.9 | 37.3 | (47) | |
| Profit/(loss) for the year | 195 | 50.9 | 74.1 | 129 | |
| Non-controlling interests | - | - | - | - | |
| Net attributable profit | 195 | 50.9 | 74.1 | 129 | |
| IFRS 9 | IAS 39 | ||||
|---|---|---|---|---|---|
| Balance sheets | 31-03-18 | ∆% | ∆%(1) | 31-12-17 | |
| Cash, cash balances at central banks and other demand deposits | 4,890 | (31.5) | (29.6) | 7,138 | |
| Financial assets designated at fair value | 10,012 | (9.5) | (7.1) | 11,068 | |
| of which Loans and advances | 62 | 10.8 | 13.9 | 56 | |
| Financial assets at amortized cost | 54,468 | (0.4) | 2.3 | 54,705 | |
| of which loans and advances to customers | 52,721 | (1.9) | 0.8 | 53,718 | |
| Inter-area positions | - | - | - | - | |
| Tangible assets | 633 | (3.8) | (1.2) | 658 | |
| Other assets | 2,276 | 3.1 | 6.0 | 2,207 | |
| Total assets/liabilities and equity | 72,280 | (4.6) | (2.0) | 75,775 | |
| Financial liabilities held for trading and designated at fair value through profit or loss | 172 | 23.4 | 26.8 | 139 | |
| Deposits from central banks and credit institutions | 3,060 | (14.5) | (12.2) | 3,580 | |
| Deposits from customers | 58,431 | (3.9) | (1.3) | 60,806 | |
| Debt certificates | 1,940 | (3.8) | (1.2) | 2,017 | |
| Inter-area positions | 1,116 | 0.6 | 3.4 | 1.110 | |
| Other liabilities | 4,929 | (9.2) | (6.8) | 5,431 | |
| Economic capital allocated | 2,631 | (2.3) | 0.4 | 2,693 | |
| Relevant business indicators | 31-03-18 | ∆% | ∆%(1) | 31-12-17 |
|---|---|---|---|---|
| Performing loans and advances to customers under management (2) | 52,501 | (2.8) | (0.2) | 54,036 |
| Non-performing loans and guarantees given | 654 | (6.1) | (3.6) | 696 |
| Customer deposits under management (2) | 58,522 | (3.8) | (1.1) | 60,806 |
| Off-balance sheet funds (3) | - | - | - | - |
| Risk-weighted assets | 57,262 | (2.4) | 0.2 | 58,688 |
| Efficiency ratio (%) | 62.2 | 64.4 | ||
| NPL ratio (%) | 1.2 | 1.2 | ||
| NPL coverage ratio (%) | 98 | 104 | ||
| Cost of risk (%) | 0.16 | 0.43 |
- (1) Figures at constant exchange rate.
- (2) Excluding repos.
- (3) Includes mutual funds, pension funds and other off-balance-sheet funds.