
Spain
Highlights
- Growth in lending and customer funds in the quarter
- Favorable evolution of the recurring income and improvement of the efficiency ratio
- Recording of the tax on credit institutions corresponding to the fiscal year 2024
- Stability of the risk indicators
BUSINESS ACTIVITY (1)
(VARIATION COMPARED TO 31-12-23)
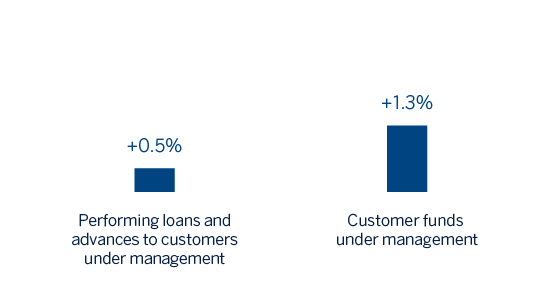
(1) Excluding repos.
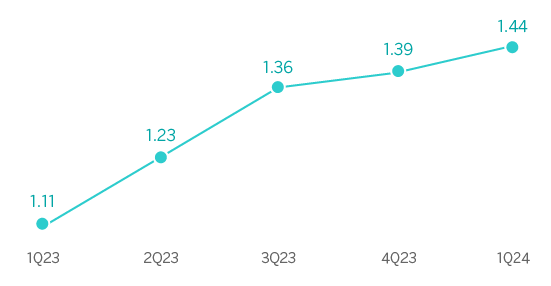
NET INTEREST INCOME / AVERAGE TOTAL ASSETS
(PERCENTAGE)
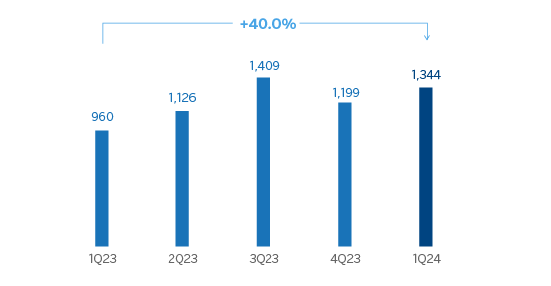
OPERATING INCOME
(MILLIONS OF EUROS)
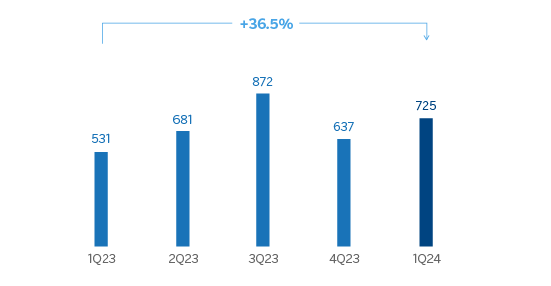
NET ATTRIBUTABLE PROFIT (LOSS)
(MILLIONS OF EUROS)
| FINANCIAL STATEMENTS AND RELEVANT BUSINESS INDICATORS (MILLIONS OF EUROS AND PERCENTAGE) | |||
|---|---|---|---|
| Income statement | 1Q24 | ∆ % | 1Q23 (1) |
| Net interest income | 1,599 | 35.2 | 1,183 |
| Net fees and commissions | 566 | 5.6 | 536 |
| Net trading income | 205 | 71.6 | 120 |
| Other operating income and expenses | (209) | 85.9 | (112) |
| Of which: Insurance activities | 97 | (2.4) | 99 |
| Gross income | 2,162 | 25.2 | 1,726 |
| Operating expenses | (818) | 6.7 | (767) |
| Personnel expenses | (419) | 1.8 | (412) |
| Other administrative expenses | (305) | 17.0 | (260) |
| Depreciation | (94) | (0.7) | (94) |
| Operating income | 1,344 | 40.0 | 960 |
| Impairment on financial assets not measured at fair value through profit or loss | (164) | 44.4 | (114) |
| Provisions or reversal of provisions and other results | (32) | 264.6 | (9) |
| Profit (loss) before tax | 1,148 | 37.1 | 837 |
| Income tax | (423) | 38.2 | (306) |
| Profit (loss) for the period | 725 | 36.5 | 532 |
| Non-controlling interests | (1) | 31.6 | (1) |
| Net attributable profit (loss) | 725 | 36.5 | 531 |
Balance sheets | 31-03-24 | ∆ % | 31-12-23 |
| Cash, cash balances at central banks and other demand deposits | 43,416 | (2.8) | 44,653 |
| Financial assets designated at fair value | 147,143 | 0.7 | 146,136 |
| Of which: Loans and advances | 69,202 | (1.5) | 70,265 |
| Financial assets at amortized cost | 221,240 | 2.3 | 216,334 |
| Of which: Loans and advances to customers | 174,094 | 0.5 | 173,169 |
| Inter-area positions | 33,121 | (22.7) | 42,869 |
| Tangible assets | 2,842 | (1.5) | 2,884 |
| Other assets | 4,466 | (4.9) | 4,697 |
| Total assets/liabilities and equity | 452,227 | (1.2) | 457,573 |
| Financial liabilities held for trading and designated at fair value through profit or loss | 103,945 | (6.9) | 111,701 |
| Deposits from central banks and credit institutions | 37,027 | (15.3) | 43,694 |
| Deposits from customers | 227,410 | 4.7 | 217,235 |
| Debt certificates | 54,059 | 5.0 | 51,472 |
| Inter-area positions | - | - | - |
| Other liabilities | 14,518 | (21.9) | 18,579 |
| Regulatory capital allocated | 15,267 | 2.5 | 14,892 |
Relevant business indicators | 31-03-24 | ∆ % | 31-12-23 |
| Performing loans and advances to customers under management (2) | 170,611 | 0.5 | 169,712 |
| Non-performing loans | 8,262 | 0.9 | 8,189 |
| Customer deposits under management (2) | 216,659 | 0.3 | 216,005 |
| Off-balance sheet funds (3) | 100,561 | 3.4 | 97,253 |
| Risk-weighted assets | 122,056 | 0.2 | 121,779 |
| Efficiency ratio (%) | 37.8 | 40.5 | |
| NPL ratio (%) | 4.1 | 4.1 | |
| NPL coverage ratio (%) | 55 | 55 | |
| Cost of risk (%) | 0.38 | 0.37 | |
(1) Restated balances. For more information, please refer to the “Business Areas” section.
(2) Excluding repos.
(3) Includes mutual funds, customer portfolios and pension funds.
Macro and industry trends
Financial indicators show dynamism in economic activity in general, but mostly in consumption and exports of services, that will favor a revision of BBVA Research's forecast for GDP growth in 2024 from 1.5% to 2.1%. According to this, despite the fact that the growth could slow down from 2023, when GDP reached 2.5%, it will remain significantly above that of the Eurozone, partly due to factors such as gains in competitiveness in the services sector, migratory influxes and the effect of European recovery funds. On the other hand, annual inflation, which fell from particularly high values in 2022 to 3.2% in March 2024, is expected to remain close to this level during 2024.
As for the banking system, data at the end of February 2024 showed that the volume of credit to the private sector declined by 2.7% year-on-year. At the end of February, household and non-financial corporate loan portfolios fell by 1.8% and 3.9% year-on-year, respectively. Customer deposits increased by 4.3% year-on-year as of the end of February 2024, due to a 3.8% reduction in demand deposits, more than offset by the growth in time deposits (102.5% year-on-year). The NPL ratio stood at 3,62% in February 2024, practically the same as in the same month of the previous year. Furthermore, the system maintains comfortable solvency and liquidity levels.
Activity
The most relevant aspects related to the area's activity during the first quarter of 2024 were:
- Lending activity grew slightly compared to the end of 2023 (+0.5%), mainly due to the dynamism in loans to large corporations (+4.9% in the first quarter of 2024). This evolution was partly offset by the deleveraging of smaller companies. On the other hand, mortgage loans remained flat during the quarter (+0.2%), with good levels of new production and supported by a slower pace of mortgage cancellations, and consumer loans ( +0.3% including credit cards) and loans to the public sector (+0.1%) also showed stability.
- Regarding credit quality, the NPL ratio remains unchanged compared to the end of 2023 and stood at 4.1%, where increase in retail portfolios have been mitigated by the good wholesale trends and a portfolio sale. The NPL coverage ratio has remained at 55%, the same ratio as the registered by the end of 2023.
- Total customer funds increased in the first quarter of the year (+1.3%), which is mainly explained by the increase in off-balance sheet funds (+3.4%), which registered positive net contributions, as well as a favorable market effect, and, to a lesser extent, by the growth in time deposits (+18.1%).
Results
Spain generated a net attributable profit of €725m in the first quarter of 2024, 36.5% higher than in the same period of the previous year, mainly supported by the favorable evolution of the net interest income, and to a lesser extent, by the net trading income (NTI).
The most relevant aspects of the year-on-year changes in the area's income statement at the end of March 2024 were:
- Net interest income increased 35.2%, mainly due to the increase in the customer spread in a context of higher benchmark interest rates compared to the first quarter of 2023.
- Net fees and commissions grew by 5.6% compared to the first quarter of 2023, favored by the contribution of revenues associated with asset management, insurance and securities, as well as CIB operations.
- Growth in the NTI contribution (+71.6%), mainly supported by the management of the portfolios.
- The other operating income and expenses line includes the total annual estimated amount for the temporary tax on credit institutions and financial credit institutions for year 2024 of €285m, which is €60m higher than that registered in the same period of the previous year.
- Operating expenses increased by 6.7%, mainly due to an increase in general expenses, as a result of inflation, especially higher IT expenses. This increase of operating expenses is well under the gross income increase (+25.2%), which allowed for a very significant improvement of the efficiency ratio by 658 basis points in the last twelve months.
- Impairment on financial assets increased by 44.4%, mainly due to higher recurrent flows in retail portfolios in the face of high rates. As a result of the above, the cumulative cost of risk at the end of March 2024 stood at 0.38%, remaining stable in comparison with the cumulative cost of risk by the end of 2023 (+1 basis points).