South America
Highlights
- Growth in lending activity and customer funds in the quarter
- Favorable performance of recurring income
- Year-on-year improvement in the efficiency of the area at constant exchange rates
- Higher adjustment for hyperinflation in Argentina
BUSINESS ACTIVITY (1)
(VARIATION AT CONSTANT EXCHANGE RATES COMPARED TO 31-12-23)

(1) Excluding repos.
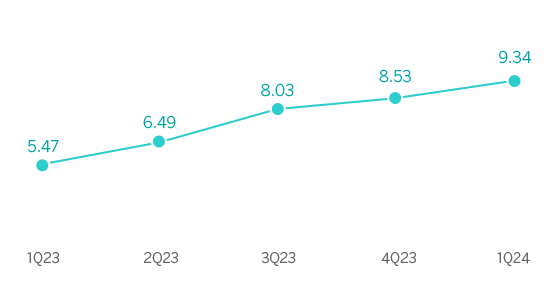
NET INTEREST INCOME / AVERAGE TOTAL ASSETS
(PERCENTAGE AT CONSTANT EXCHANGE RATES)

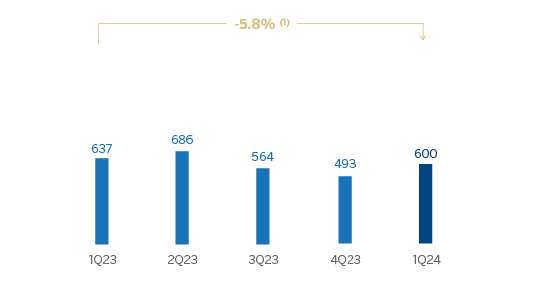
OPERATING INCOME
(MILLIONS OF EUROS AT CURRENT EXCHANGE RATES)

(1) At constant exchange rates: +64.8%.
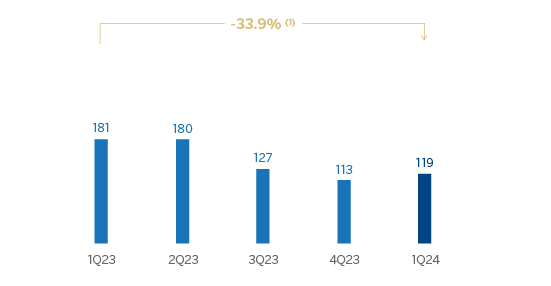
NET ATTRIBUTABLE PROFIT (LOSS)
(MILLIONS OF EUROS AT CURRENT EXCHANGE RATES)

(1) At constant exchange rates: +54.6%.
| FINANCIAL STATEMENTS AND RELEVANT BUSINESS INDICATORS (MILLIONS OF EUROS AND PERCENTAGE) | ||||
|---|---|---|---|---|
| Income statement | 1Q24 | ∆ % | ∆ % (2) | 1Q23 (1) |
| Net interest income | 1,555 | 30.7 | 95.2 | 1,190 |
| Net fees and commissions | 193 | 4.7 | 26.5 | 184 |
| Net trading income | 196 | 54.4 | 81.1 | 127 |
| Other operating income and expenses | (744) | 127.9 | 169.5 | (326) |
| Gross income | 1,201 | 2.2 | 53.6 | 1,175 |
| Operating expenses | (600) | 11.7 | 43.8 | (537) |
| Personnel expenses | (273) | 8.4 | 44.1 | (252) |
| Other administrative expenses | (279) | 14.9 | 49.1 | (243) |
| Depreciation | (49) | 13.3 | 18.4 | (43) |
| Operating income | 600 | (5.8) | 64.8 | 637 |
| Impairment on financial assets not measured at fair value through profit or loss | (354) | 55.7 | 75.2 | (227) |
| Provisions or reversal of provisions and other results | (45) | n.s. | n.s. | (9) |
| Profit (loss) before tax | 201 | (49.8) | 27.5 | 401 |
| Income tax | (7) | (94.6) | (82.3) | (122) |
| Profit (loss) for the period | 195 | (30.2) | 61.1 | 279 |
| Non-controlling interests | (75) | (23.4) | 72.6 | (98) |
| Net attributable profit (loss) | 119 | (33.9) | 54.6 | 181 |
Balance sheets | 31-03-24 | ∆ % | ∆ % (2) | 31-12-23 |
| Cash, cash balances at central banks and other demand deposits | 7,626 | 15.8 | 14.4 | 6,585 |
| Financial assets designated at fair value | 9,823 | (6.5) | (7.8) | 10,508 |
| Of which: Loans and advances | 114 | (80.7) | (81.0) | 592 |
| Financial assets at amortized cost | 47,353 | 6.4 | 5.1 | 44,508 |
| Of which: Loans and advances to customers | 42,762 | 3.8 | 2.3 | 41,213 |
| Tangible assets | 1,132 | 20.6 | 19.5 | 939 |
| Other assets | 2,785 | 24.4 | 24.2 | 2,239 |
| Total assets/liabilities and equity | 68,719 | 6.1 | 4.8 | 64,779 |
| Financial liabilities held for trading and designated at fair value through profit or loss | 2,587 | (21.4) | (22.7) | 3,289 |
| Deposits from central banks and credit institutions | 5,136 | (0.1) | (0.1) | 5,140 |
| Deposits from customers | 44,638 | 4.9 | 3.1 | 42,567 |
| Debt certificates | 3,057 | 2.4 | 3.1 | 2,986 |
| Other liabilities | 7,028 | 56.1 | 57.0 | 4,502 |
| Regulatory capital allocated | 6,273 | (0.3) | (1.2) | 6,294 |
Relevant business indicators | 31-03-24 | ∆ % | ∆ % (2) | 31-12-23 |
| Performing loans and advances to customers under management (3) | 42,489 | 3.6 | 2.2 | 41,013 |
| Non-performing loans | 2,448 | 6.3 | 4.8 | 2,302 |
| Customer deposits under management (4) | 44,638 | 4.9 | 3.1 | 42,567 |
| Off-balance sheet funds (5) | 6,028 | 9.1 | 8.6 | 5,525 |
| Risk-weighted assets | 52,360 | 6.6 | 5.3 | 49,117 |
| Efficiency ratio (%) | 50.0 | 45.0 | ||
| NPL ratio (%) | 5.0 | 4.8 | ||
| NPL coverage ratio (%) | 86 | 88 | ||
| Cost of risk (%) | 3.11 | 2.51 | ||
(1) Restated balances. For more information, please refer to the “Business Areas” section.
(2) At constant exchange rate.
(3) Excluding repos.
(4) Excluding repos and including specific marketable debt securities.
(5) Includes mutual funds, customer portfolios in Colombia and Peru.
| SOUTH AMERICA. DATA PER COUNTRY (MILLIONS OF EUROS) | ||||||||
|---|---|---|---|---|---|---|---|---|
Country | ||||||||
| 1Q24 | ∆ % | ∆ % (1) | 1Q23 (2) | 1Q24 | ∆ % | ∆ % (1) | 1Q23 (2) | |
| Argentina | 111 | (34.3) | n.s. | 169 | 34 | (33.2) | n.s. | 51 |
| Colombia | 146 | 19.4 | (0.5) | 122 | 20 | (50.6) | (58.8) | 40 |
| Peru | 285 | 11.1 | 10.8 | 256 | 42 | (24.3) | (24.5) | 56 |
| Other countries (3) | 59 | (34.7) | (31.8) | 90 | 23 | (31.1) | (30.2) | 34 |
| Total | 600 | (5.8) | 64.8 | 637 | 119 | (33.9) | 54.6 | 181 |
(1) Figures at constant exchange rates.
(2) Restated balances. For more information, please refer to the “Business Areas” section.
(3) Chile (Forum), Uruguay and Venezuela. Additionally, it includes eliminations and other charges.
| SOUTH AMERICA. RELEVANT BUSINESS INDICATORS PER COUNTRY (MILLIONS OF EUROS) | ||||||
|---|---|---|---|---|---|---|
| 31-03-24 | 31-12-23 | 31-03-24 | 31-12-23 | 31-03-24 | 31-12-23 | |
| Performing loans and advances to customers under management (1) (2) | 2,857 | 2,175 | 17,203 | 17,235 | 17,863 | 17,563 |
| Non-performing loans (1) | 48 | 37 | 958 | 906 | 1,272 | 1,229 |
| Customer deposits under management (1) (3) | 5,129 | 3,910 | 18,356 | 18,174 | 17,226 | 17,317 |
| Off-balance sheet funds (1) (4) | 1,603 | 1,391 | 2,598 | 2,548 | 1,824 | 1,608 |
| Risk-weighted assets | 6,292 | 4,997 | 19,792 | 19,467 | 20,483 | 18,825 |
| Efficiency ratio (%) | 64.7 | 54.1 | 50.1 | 47.5 | 37.9 | 36.7 |
| NPL ratio (%) | 1.6 | 1.6 | 5.1 | 4.8 | 5.7 | 5.5 |
| NPL coverage ratio (%) | 140 | 136 | 86 | 89 | 82 | 84 |
| Cost of risk (%) | 4.57 | 2.18 | 2.85 | 2.13 | 3.40 | 3.04 |
(1) Figures at constant exchange rates.
(2) Excluding repos.
(3) Excluding repos and including specific marketable debt securities.
(4) Includes mutual funds and customer portfolios (in Colombia and Peru).
Unless expressly stated otherwise, all the comments below on rates of change, for both activity and results, will be given at constant exchange rates. These rates, together with the changes at current exchange rates, can be found in the attached tables of the financial statements and relevant business indicators.
Activity and results
The most relevant aspects related to the area's activity during the first quarter of the year 2024 have been:
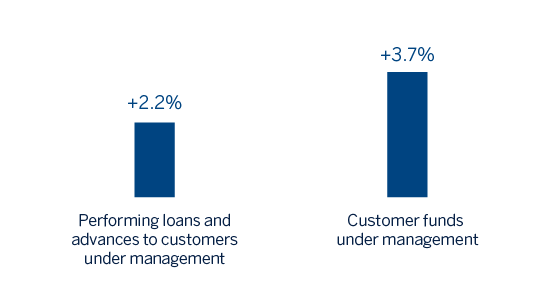
- Lending activity (performing loans under management) recorded a variation of +2.2%, mainly boosted by the momentum of corporate loans (+2.8%), credit cards (+7.0%) and mortgage loans (+2.2%).
- With regard to asset quality, the NPL ratio stood at 5.0%, with an increase of 15 basis points in the quarter at the regional level as a result of NPL entries, mostly in the retail portfolio, affecting the NPL coverage ratio, which stood at 86%.
- Customer funds under management increased by 3.7%, mainly due to the increase of low cost transactional funds, which are demand deposits (+3.4%) supported by higher balances of time deposits (+2.6%) and the evolution of off-balance sheet funds (+8.6 %).
South America generated a cumulative net attributable profit of €119m at the end of the first quarter of 2024, which represents a year-on-year increase of +54.6%, driven by the good performance of recurring income (+84.1%) and the area's NTI, which offset the increase in expenses and the more negative impact of "Other operating income and expenses". This line mainly includes the impact of the adjustment for hyperinflation in Argentina, whose net monetary loss stood at €655m in the period from January-March 2024, which is higher than the €236m registered in the period from January-March 2023.
More detailed information on the most representative countries of the business area is provided below.
Argentina
Macro and industry trends
The new government substantially modified the economic policy framework and focused its efforts on a strong fiscal and monetary adjustment to reduce inflation. The reduction of fiscal deficit in the first months of the year, the relative currency stability observed after the significant depreciation of the Argentinean peso in December 2023, in a context of accumulation of international reserves, and the contraction of economic activity have allowed a recent moderation of the inflation measured monthly, which, however, still remains high. In spite of the uncertainty and related risks, it is likely, according to BBVA Research, that these factors, eventually complemented by additional measures in the context of the release of a more integral stabilization program, could set the bases for an inflation slowdown in the following months. On the other hand, although the sharp deterioration of economic activity could be reversed by mid-year if the adjustment plan is successful, it is expected that, after falling by 1.6% in 2023, GDP will be drop by 4.0% in 2024 (unchanged since the last forecast).
The banking system continues to grow at a stable pace but is affected by high inflation. At the end of February 2024, total credit had grown by 167% compared to the same month in 2023, favored by both consumer and corporate portfolios, which reached year-on-year growth rates of 147% and 200%, respectively. On the other hand, deposits continued the trend of the previous months and at the end of February had grown by 138% year-on-year at the end of February. Finally, the NPL ratio increased slightly to 3.5% as of January 2024 (30 basis points more than the same month in 2023).
Activity and results
- Between January and March 2024, performing loans under management increased by 31.3%, showing growth in both the wholesale portfolio (+35.0%) and the retail portfolio (+27.4%), highlighting in the latter the growth in credit cards (+24.6%). The NPL ratio stood at 1.6%, which represents a decrease of 2 basis points compared to the previous quarter, positively affected by activity growth. On the other hand, the NPL coverage ratio stood at 140%.
- Balance sheet funds grew by 31.2% between January and March 2024, with growth of both demand deposits (+26.5%) and time deposits (+44.3%). Mutual funds also had a good performance (+15.3% in the same period).
- The cumulative net attributable profit at the end of March 2024 stood at €34m. Net interest income continued to be driven by both higher activity and prices, offsetting the rising costs of funds. On the other hand, there was a more negative adjustment for hyperinflation (mainly reflected in the other operating income and expenses line) and higher expenses, both in personnel due to salary revisions, and general expenses.
Colombia
Macro and industry trends
After a period of weakness in economic activity, during the year 2023 and to some extent also at the beginning of 2024, BBVA Research forecasts a recovery starting in the middle of this year. A further decrease in inflation, which reached 7.4% in March and would fall to around 5.4% in December, and in interest rates, from 12.25% in March to around 7.5% in December, would likely allow GDP growth to increase to 1.5% this year (unchanged from the previous forecast) from 0.6% in 2023.
Total credit growth for the banking system stood at 1.5% year-on-year in February 2024. As in previous months, system's credit continues to be driven by the growth in corporate lending and mortgages at 2.2% and 8.9% respectively. Noteworthy is the slowdown in consumer credit, which changed from a year-on-year growth rate of 20% during 2022, to year-on-year decreases since October 2023. In February 2024, consumer credit has decreased by 3.6% compared to the same month in 2023. Total deposits showed a year-on-year growth rate of 6.7% at the end of February 2024, with a strong shift towards time deposits (up 16.4% year-on-year) and a fall in demand deposits (-0.9%). The NPL ratio of the system has climbed in recent months to 5.15% in February 2024, 103 basis points higher than in the same month of 2023.
Activity and results
- Lending activity remained practically stable compared to the end of 2023 (-0.2%), mainly due to the reduction in consumer loans by 1.9%, partially offset by the growth in both corporate (+1.0%) and mortgage loans (+0.5%). In terms of asset quality, the NPL ratio stood at 5.1%, increasing compared to the previous quarter (+26 basis points), affected by the activity deceleration and NPL inflows in the retail portfolio, mainly in the consumer portfolio. On the other hand, the NPL coverage ratio declined to 86% due to the new NPL inflows as mentioned.
- In the first quarter of 2024, customer deposits increased by 1.0% compared to the end of 2023, mainly thanks to the favorable evolution of time deposits (+3.6%) and, to a lesser extent, off-balance sheet funds (+2.0%).
- The cumulative net attributable profit at the end of March 2024 stood at €20m, that is 58.8% lower than the same period of the previous year. The significant growth of the net interest income (+17.3%) stands out, mainly explained by the increase of costumer spread, due to the improvement of the cost of funds. This situation was offset by NTI, which was penalized by the results from derivatives and fixed income, the operating expenses increase and greater needs for impairment on financial assets due to higher portfolios requirements.
Peru
Macro and industry trends
In a context marked by adverse weather shocks and the effects of high inflation and of a contractionary monetary policy, GDP contracted by 0.6% in 2023. BBVA Research expects economic activity to gradually recover in 2024, as weather conditions become more favorable (there are signs that the "El Niño" phenomenon will be more moderate than previously expected), inflation, which peaked at 3.1% in March 2024, is expected to continue to decline to 2.6% in December, and interest rates are expected to be cut further from 6.0% in April to approximately 4.75% at year-end. In this context, GDP is expected to grow by around 2.7% this year (70 basis points over the previous forecast).
Total credit in the Peruvian banking system fell by 2.0% year-on-year in February 2024. Performance by portfolios is uneven, with the biggest slowdown in corporate lending, with a year-on-year contraction of 6.1%. In contrast, consumer finance remained buoyant, growing by 4.3% year-on-year as of February 2024, while the mortgage portfolio maintained a stable growth rate of around 5.3% year-on-year, in line with previous months. Total deposits in the system increased at the end of February 2024 by 2.0% year-on-year, showing a continued shift towards time deposits (+9.6% year-on-year) to the detriment of demand deposits (-1.9% year-on-year). The NPL ratio across the banking system rose very slightly to 4.43% since the end of 2023.
Activity and results
- Lending activity increased compared to the end of December 2023 (+1.7%), mainly due to the positive evolution of corporate loans (+1.8%, favored by CIB operations), and, to a lesser extent, consumer loans (+3.1%) and mortgages (+2.3%). In terms of credit quality indicators, the NPL ratio increased by 16 basis points in the quarter and stood at 5.7%, with entries mainly in the retail portfolio, credit cards and SMEs. On the other hand, the NPL coverage ratio stood at 82%, impacted by the increase in NPLs and write-offs.
- Customers funds under management increased slightly during the first quarter of 2024 (+0.7%), boosted by the good performance of demand deposits (+2.2%) and by off-balance sheet funds (+13.5%).
- BBVA Peru's net attributable profit stood at €42m at the end of March 2024, 24.5% below the figure achieved at the end of the first quarter of 2023. Good performance of the net interest income, with an increasing customer spread, and of commissions, while the NTI performance was below the same period of the previous year, affected by a lower result from Global Markets. The increase of provisions for impairment of financial assets (+68.9%) stands out negatively, with higher requirements mainly due to the impairment of the retail portfolio.