
Group
Quarterly evolution of results
The results obtained by the BBVA Group in the second quarter of 2024 stood at 2,794 million euros, 27.0% above the previous quarter, with the following trends standing out:
- Favorable evolution of recurring income, with Turkey´s performance standing out.
- Excellent performance of NTI, due to the exchange rate hedges of the Corporate Center.
- Favorable evolution of the other operating income and expenses line, mainly explained by a lower hyperinflation adjustment in Argentina, and by the temporary tax on credit institutions and financial credit institutions, recorded in the first quarter of the year 2024.
- Increase of operating expenses and in impairment on financial assets, in line with the growth strategy in the most profitable segments.
| CONSOLIDATED INCOME STATEMENT: QUARTERLY EVOLUTION (MILLIONS OF EUROS) | |||||||
|---|---|---|---|---|---|---|---|
| 2Q | 1Q | 4Q | 3Q | 2Q | 1Q | ||
| Net interest income | 6,481 | 6,512 | 5,246 | 6,434 | 5,768 | 5,642 | |
| Net fees and commissions | 1,955 | 1,887 | 1,694 | 1,685 | 1,470 | 1,439 | |
| Net trading income | 1,114 | 772 | 753 | 658 | 334 | 438 | |
| Other operating income and expenses | (324) | (952) | (255) | (820) | (383) | (561) | |
| Gross income | 9,227 | 8,218 | 7,438 | 7,956 | 7,189 | 6,958 | |
| Operating expenses | (3,477) | (3,383) | (3,068) | (3,303) | (2,922) | (3,016) | |
| Personnel expenses | (1,855) | (1,778) | (1,693) | (1,756) | (1,530) | (1,551) | |
| Other administrative expenses | (1,238) | (1,229) | (1,025) | (1,169) | (1,054) | (1,127) | |
| Depreciation | (384) | (375) | (349) | (378) | (337) | (339) | |
| Operating income | 5,751 | 4,835 | 4,370 | 4,654 | 4,267 | 3,942 | |
| Impairment on financial assets not measured at fair value through profit or loss | (1,479) | (1,361) | (1,225) | (1,210) | (1,025) | (968) | |
| Provisions or reversal of provisions | 19 | (57) | (163) | (81) | (115) | (14) | |
| Other gains (losses) | 31 | 40 | (49) | 2 | 50 | (16) | |
| Profit (loss) before tax | 4,322 | 3,458 | 2,932 | 3,365 | 3,178 | 2,944 | |
| Income tax | (1,374) | (1,151) | (799) | (1,226) | (1,028) | (950) | |
| Profit (loss) for the period | 2,949 | 2,307 | 2,133 | 2,139 | 2,150 | 1,994 | |
| Non-controlling interests | (154) | (107) | (75) | (56) | (118) | (148) | |
| Net attributable profit (loss) | 2,794 | 2,200 | 2,058 | 2,083 | 2,032 | 1,846 | |
| Adjusted earning (loss) per share (euros) (1) | 0.47 | 0.37 | 0.34 | 0.34 | 0.34 | 0.30 | |
| Earning (loss) per share (euros) (1) | 0.47 | 0.36 | 0.33 | 0.33 | 0.33 | 0.29 | |
(1) Adjusted by additional Tier 1 instrument remuneration. For more information, see Alternative Performance Measures at the end of this report.
Year-on-year evolution of results
The BBVA Group generated a net attributable profit of €4,994m in the first half of 2024, again driven by the performance of recurring revenues of the banking business. Thus, the net interest income grew at a year-on-year rate of 13.9% and net fees and commissions by 32.1%. These results represent an increase of 28.8% compared to the same period of the previous year.
These results include the recording for the total annual amount paid for the temporary tax on credit institutions and financial credit institutions6 for €285m, included in the other operating income and expenses line of the income statement.
| CONSOLIDATED INCOME STATEMENT (MILLIONS OF EUROS) | ||||
|---|---|---|---|---|
| 1H24 | ∆ % | ∆ % at constant exchange rates | 1H23 | |
| Net interest income | 12,993 | 13.9 | 20.3 | 11,410 |
| Net fees and commissions | 3,842 | 32.1 | 35.4 | 2,909 |
| Net trading income | 1,886 | 144.2 | 183.0 | 773 |
| Other operating income and expenses | (1,276) | 35.2 | 35.6 | (944) |
| Gross income | 17,446 | 23.3 | 30.5 | 14,148 |
| Operating expenses | (6,859) | 15.5 | 19.5 | (5,938) |
| Personnel expenses | (3,633) | 17.9 | 22.5 | (3,081) |
| Other administrative expenses | (2,467) | 13.1 | 17.9 | (2,181) |
| Depreciation | (759) | 12.3 | 11.8 | (676) |
| Operating income | 10,586 | 29.0 | 38.8 | 8,209 |
| Impairment on financial assets not measured at fair value through profit or loss | (2,839) | 42.5 | 42.8 | (1,993) |
| Provisions or reversal of provisions | (38) | (70.3) | (65.1) | (129) |
| Other gains (losses) | 71 | 107.8 | 94.6 | 34,0 |
| Profit (loss) before tax | 7,780 | 27.1 | 39.8 | 6,122 |
| Income tax | (2,525) | 27.6 | 40.4 | (1,978) |
| Profit (loss) for the period | 5,255 | 26.8 | 39.6 | 4,144 |
| Non-controlling interests | (261) | (1.9) | 108.2 | (266) |
| Net attributable profit (loss) | 4,994 | 28.8 | 37.2 | 3,878 |
| Adjusted earning (loss) per share (euros) (1) | 0.84 | 0.64 | ||
| Earning (loss) per share (euros) (1) | 0.83 | 0.62 | ||
(1) Adjusted by additional Tier 1 instrument remuneration. For more information, see Alternative Performance Measures at the end of this report.
Unless expressly indicated otherwise, for a better understanding of the changes under the main headings of the Group's income statement, the rates of change provided below refer to constant exchange rates. When comparing two dates or periods in this report, the impact of changes in the exchange rates against the euro of the currencies of the countries in which BBVA operates is sometimes excluded, assuming that exchange rates remain constant. For this purpose, the average exchange rate of the currency of each geographical area of the most recent period is used for both periods, except for those countries whose economies have been considered hyperinflationary, for which the closing exchange rate of the most recent period is used.
The accumulated net interest income as of June 30, 2024 was higher than in the same period of the previous year (+20.3%), with increases in all business areas except for Turkey, as a result of the dynamism that lending activity has shown during the first half of the year. The good evolution in South America and Spain is noteworthy.
Positive evolution in the net fees and commissions line, which increased by 35.4% in year-on-year terms due to the favorable performance in payment systems and, to a lesser extent, asset management. The contribution of Turkey and, to a lesser extent, of Mexico stand out in this line.
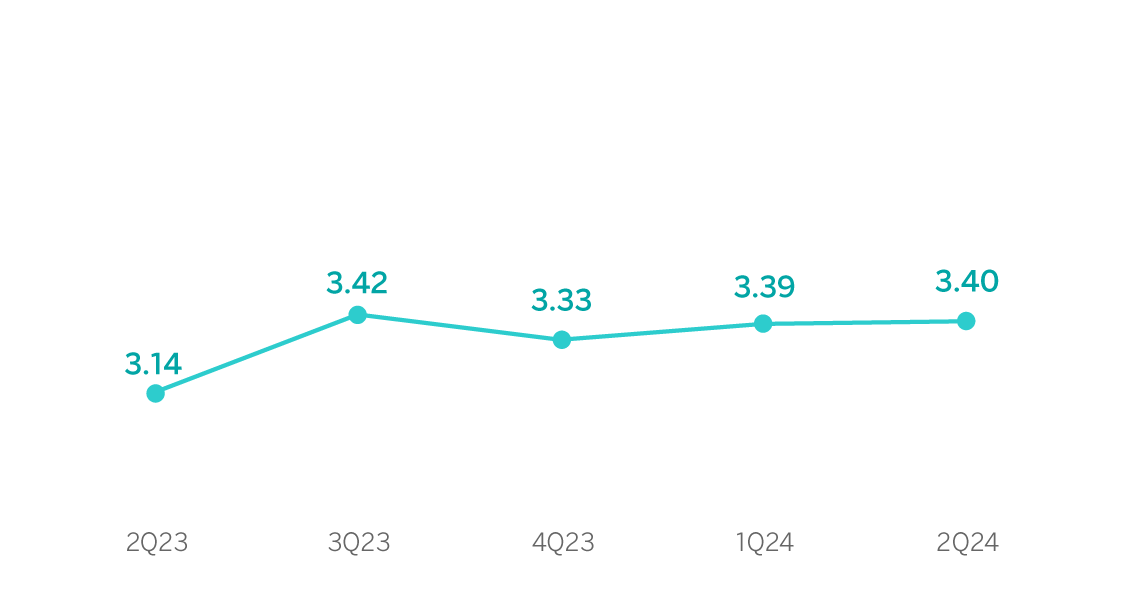
NET INTEREST INCOME / AVERAGE TOTAL ASSETS
(PERCENTAGE AT CONSTANT EXCHANGE RATES)
NET INTEREST INCOME PLUS NET FEES AND COMMISSIONS
(MILLIONS OF EUROS AT CONSTANT EXCHANGE RATES)
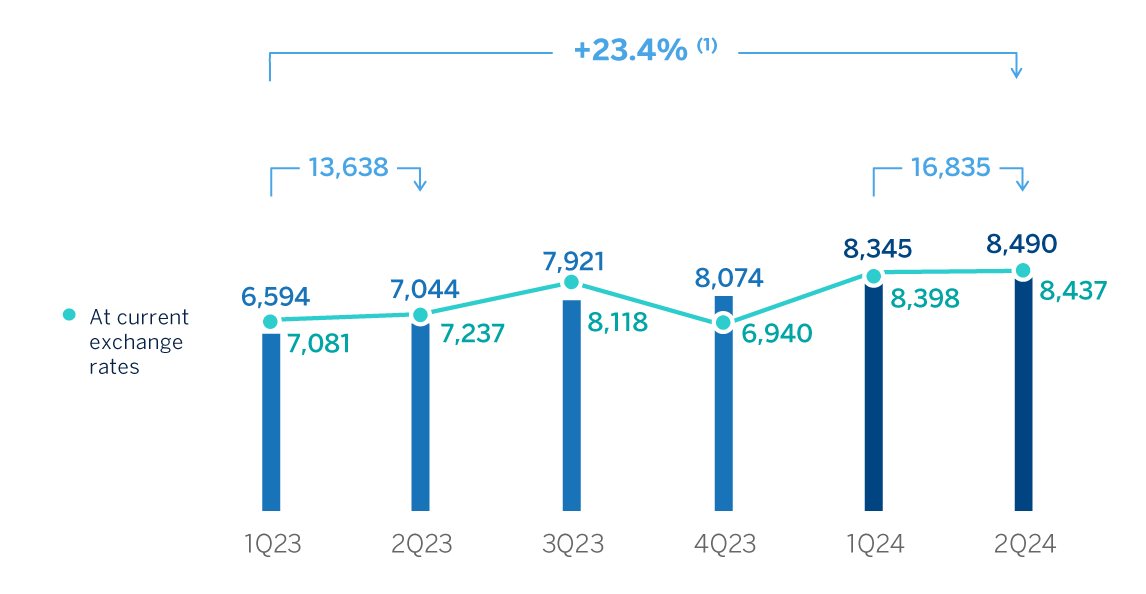
(1) At current exchange rates: +17.6%.
At the end of June 2024, NTI grew by 183.0%, mainly explained by the favorable results from hedging foreign currency positions especially of the Mexican peso, recorded in the Corporate Center and, to a lesser extent, by the positive performance of this line in all business areas. Regarding the contribution of Global Markets, included in this line, the evolution of Spain and Mexico stands out.
The other operating income and expenses line accumulated as of June 30, 2024 a result that compares negatively with the same date of the same period of last year, mainly due to the recording in the line of a more negative adjustment for hyperinflation in Argentina in this exercise, partially offset by the lack of contribution to the European Single Resolution Fund after completion of its construction stage7. This line also reflects the total estimated amount of the temporary tax on credit institutions and financial credit institutions for year 2024 registered in the first quarter of the year and 60 million higher than the annual amount estimated for year 2023, registered in the first quarter of that year. For its part, the results of the insurance business had a favorable evolution.
GROSS INCOME
(MILLIONS OF EUROS AT CONSTANT EXCHANGE RATES)
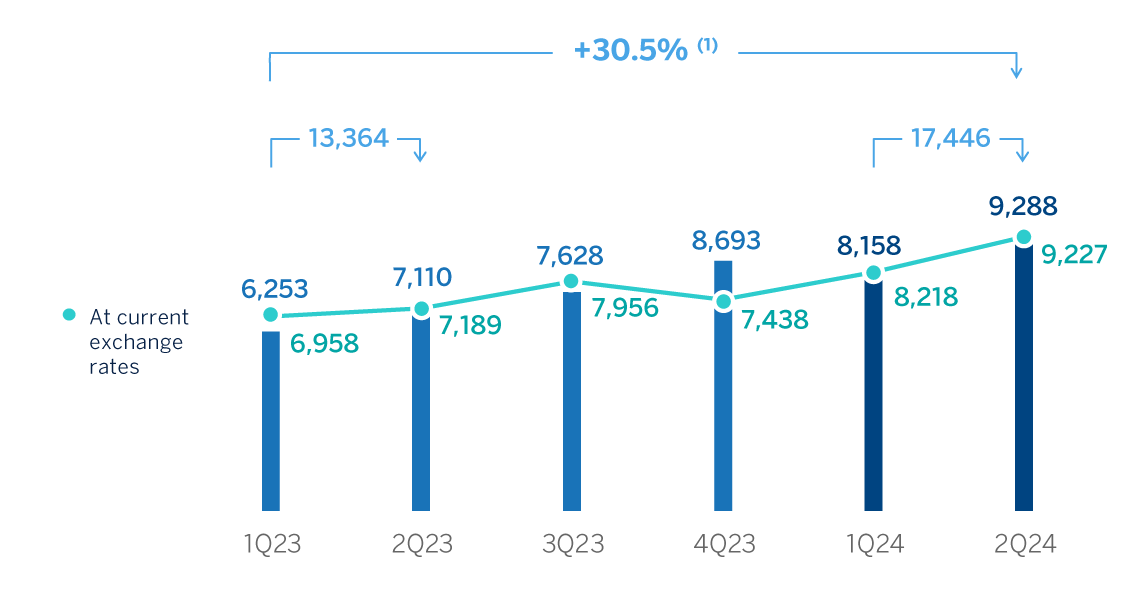
(1) At current exchange rates: +23.3%.
On a year-on-year basis, the increase in operating expenses increased at the Group level stood at 19.5%, a rate that is below the inflation rates observed in the countries in which the Group operates (an average of 21.3% on average in the last 12 months8).
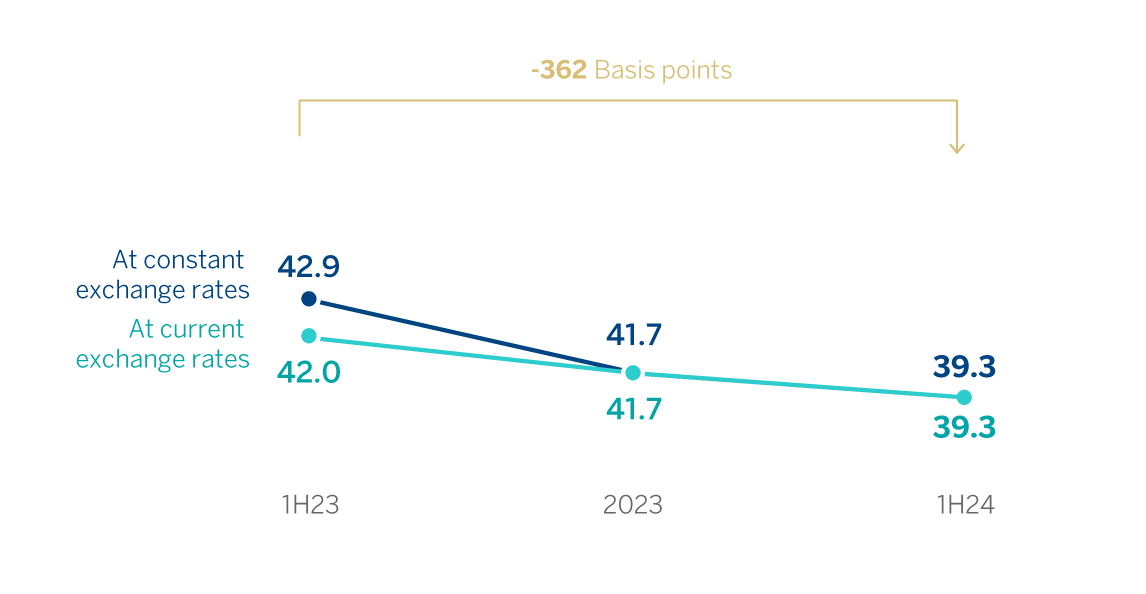
Thanks to the remarkable growth in gross income (+30.5%, in constant terms), the efficiency ratio stood at 39.3% as of June 30, 2024, with an improvement of 362 basis points compared to the ratio recorded 12 months earlier.
OPERATING EXPENSES
(MILLIONS OF EUROS AT CONSTANT EXCHANGE RATES)
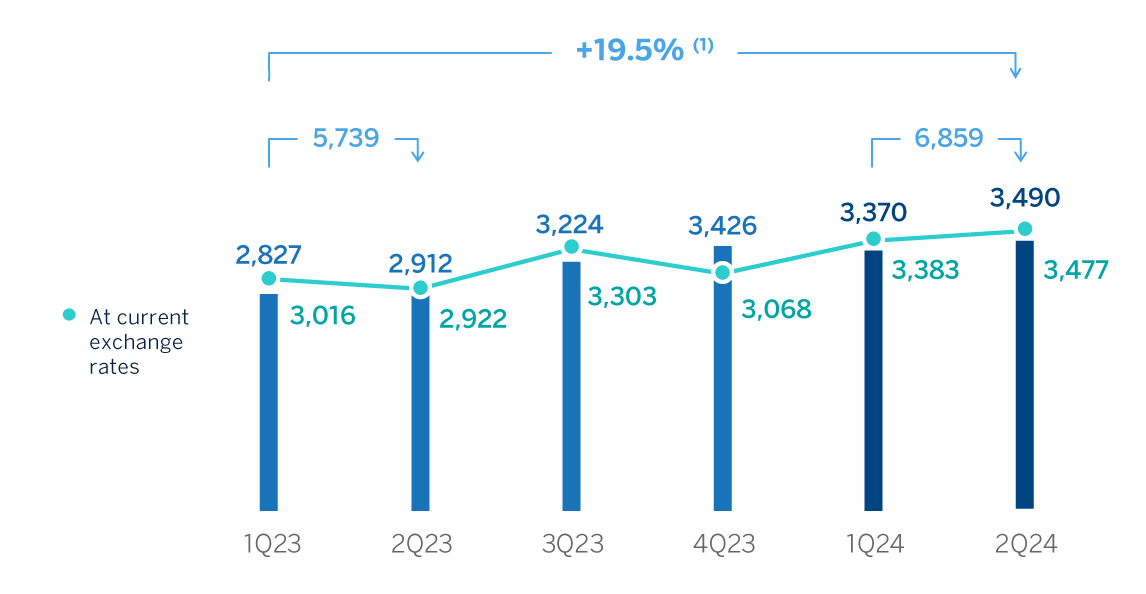
(1) At current exchange rates: +15.5%.
EFFICIENCY RATIO
(PERCENTAGE)
The impairment on financial assets not measured at fair value through profit or loss (impairment on financial assets) at the end of June 2024 was 42.8% higher than in the same period of the previous year, with higher requirements linked to the growth in retail products, the most profitable in line with the Group´s strategy. All business areas required greater loan-loss provisions, highlighting Mexico and South America.
OPERATING INCOME
(MILLIONS OF EUROS AT CONSTANT EXCHANGE RATES)
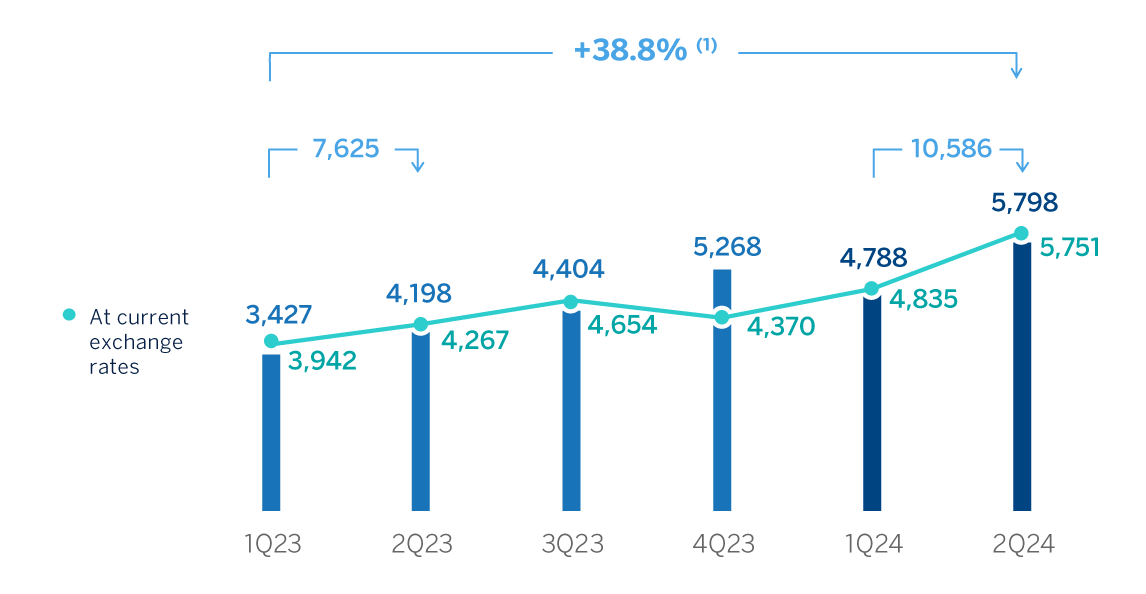
(1) At current exchange rates: +29.0%.
IMPAIRMENT ON FINANCIAL ASSETS
(MILLIONS OF EUROS AT CONSTANT EXCHANGE RATES)
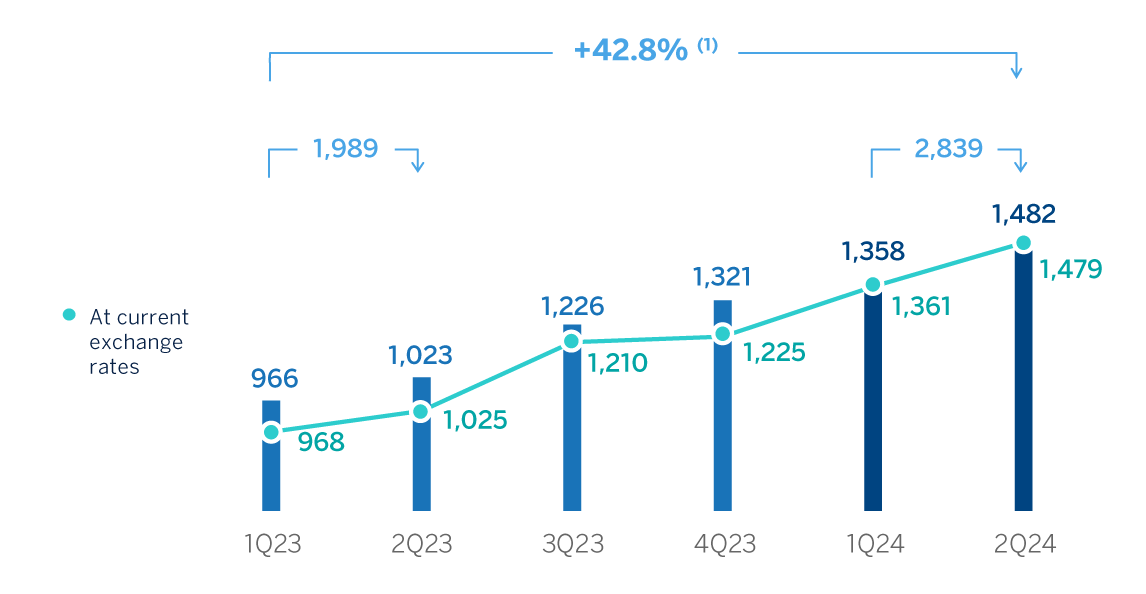
(1) At current exchange rates: +42.5%.
The provisions or reversal of provisions line (hereinafter, provisions) registered at the end of June 30, 2024 lower provisions compared to the same period of the previous year, mainly originated in Turkey.
On the other hand, the other gains (losses) line ended June 2024 with a balance of €71m, which compares favorably with the result of the previous year when collecting the positive impact of the evaluation of real state in Turkey and the reversal of impairments for investments in associates, recorded in Corporate Center.
As a result of the above, the BBVA Group generated a net attributable profit of €4,994m between January and June of the year 2024, which compares very positively with the result of the same period of the previous year (+37.2%). These solid results are supported by the favorable evolution of the banking business recurring income, which offsets the higher operating expenses and the increase in provisions for impairment losses on financial assets.
The cumulative net attributable profits, in millions of euros and accumulated at the end of June 2024 for the business areas that compose the Group were as follows: €1,790m in Spain, €2,858m in Mexico, €351m in Turkey, €317m in South America and €235m in Rest of Business.
NET ATTRIBUTABLE PROFIT
(LOSS) (MILLIONS OF EUROS AT CONSTANT EXCHANGE RATES)
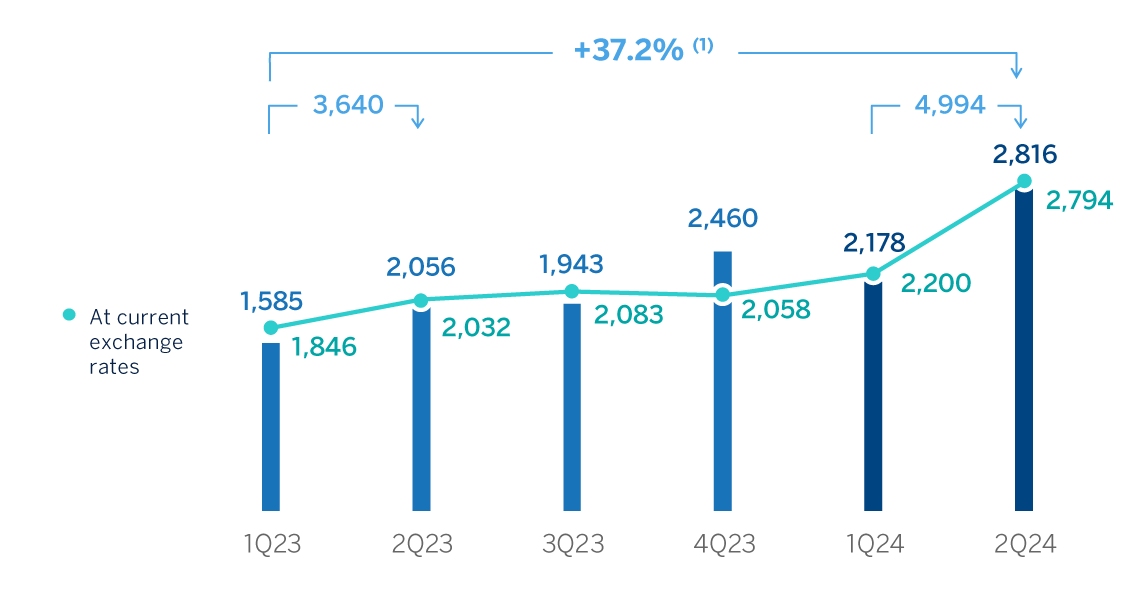
(1) At current exchange rates: +28.8%
The Group's excellent performance has also allowed to accelerate value creation, as reflected in the growth of the tangible book value per share and dividends, which as of the end of June 2024 was 19.7% higher than in the same period of the previous year.
TANGIBLE BOOK VALUE PER SHARE AND DIVIDENDS
(EUROS)
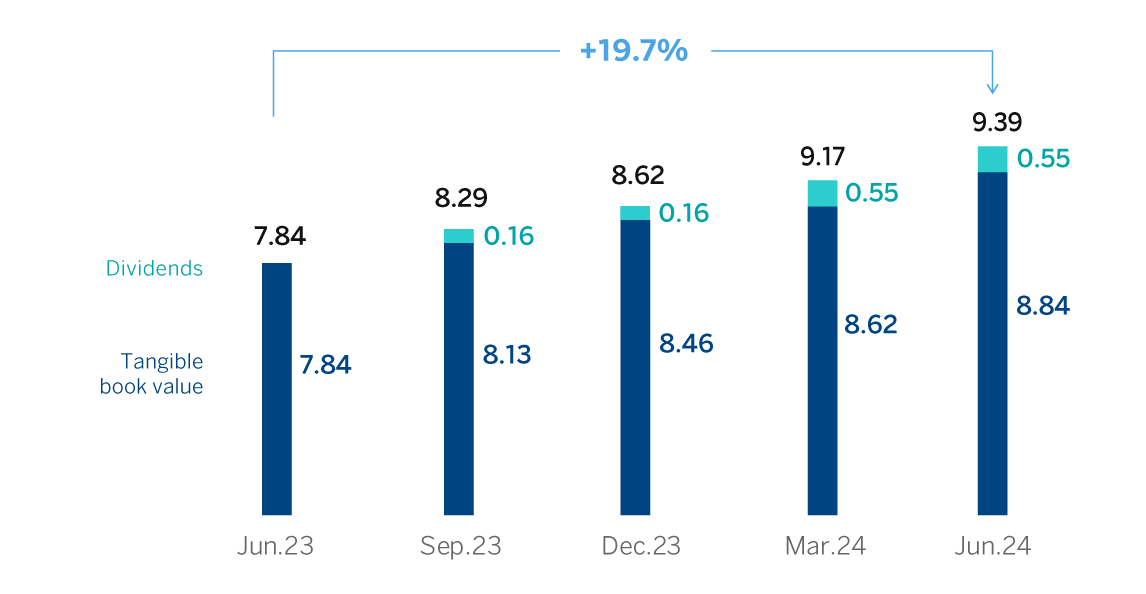
General note: replenishing dividends paid in the period. For more information, see Alternative Performance Measures at the end of this report.
EARNING (LOSS) PER SHARE
(EUROS)
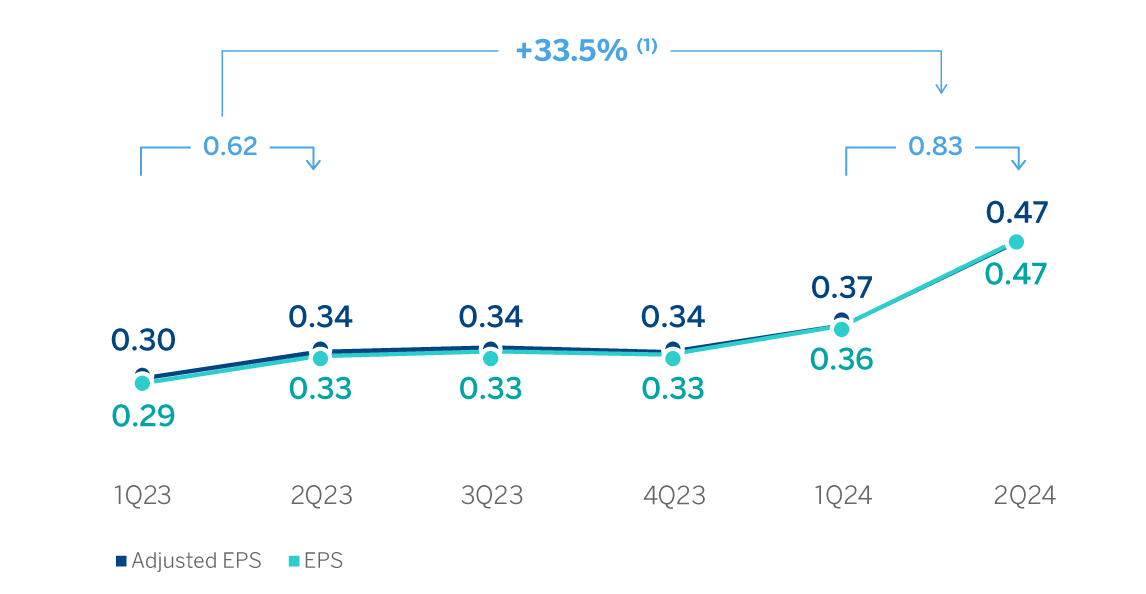
General note: Adjusted by additional Tier 1 instrument remuneration. For more information, see Alternative Performance Measures at the end of this report.
(1) The year-on-year variation of adjusted EPS stand at +30.6%.
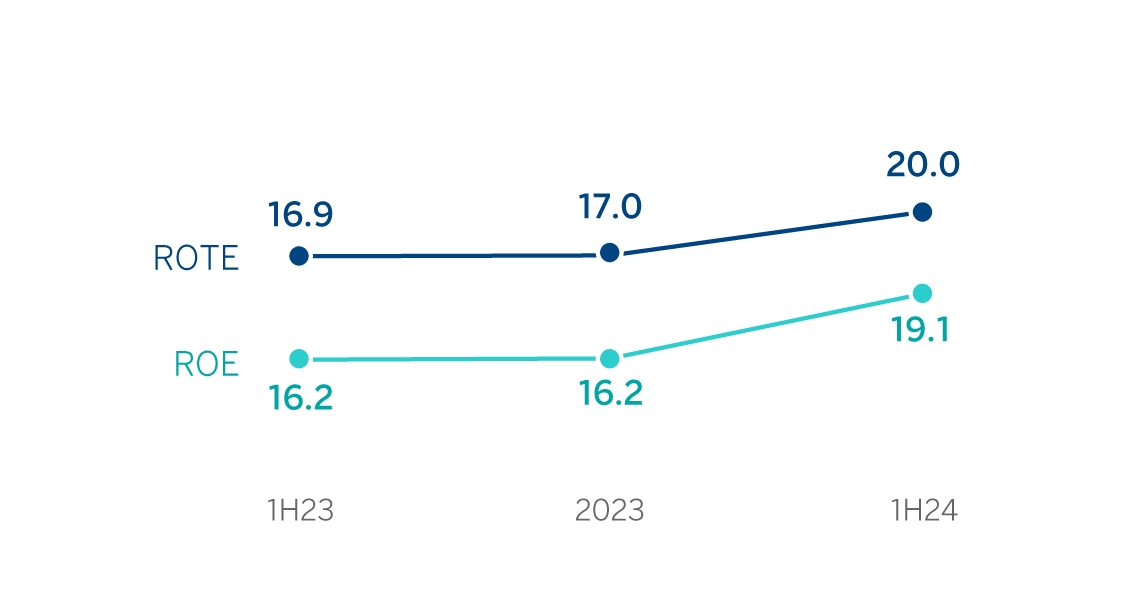
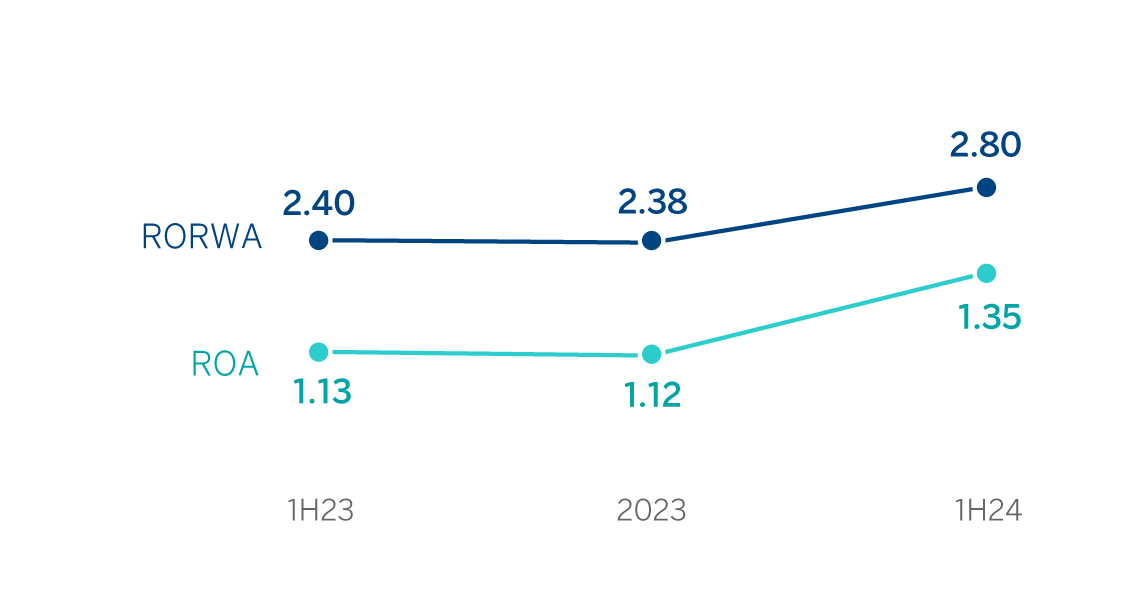
Lastly, the Group’s profitability indicators improved in year-on-year terms supported by the favorable performance of results.
ROE AND ROTE
(PERCENTAGE)
ROA AND RORWA
(PERCENTAGE)
6 In compliance with Law 38/2022, of December 27, which establishes the obligation to pay a patrimonial benefit of a public and non-taxable nature during the years 2023 and 2024 for credit institutions that operate in Spanish territory whose sum of total interest income and fee and commission income corresponding to the year 2019 is equal to or greater than €800m.
7 The Single Resolution Fund, whose funds would be allocated to the resolution of financial entities in certain circumstances, has been increasing during a transitional period of eight years (2016-2023) with the objective of reaching at least 1% of the deposits covered by the Member States that make up the Single Resolution Mechanism at the end of 2023.
8 Weighted by operating expenses and excluding Venezuela.