
Mexico
Highlights
- Growth in lending activity, with higher dynamism in the wholesale segment in the quarter
- Recurring revenue growth in the first half of 2024
- Improvement of the efficiency ratio in the first six months of 2024
- Quarterly net attributable profit remains at high levels
BUSINESS ACTIVITY (1)
(VARIATION AT CONSTANT EXCHANGE RATE COMPARED TO 31-12-23)
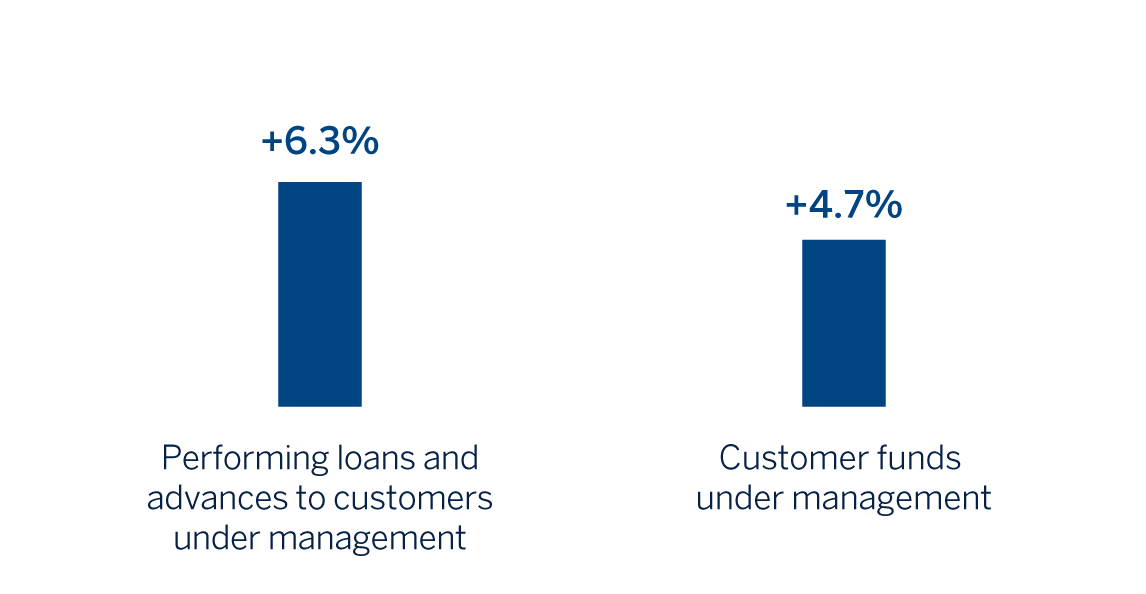
(1) Excluding repos.
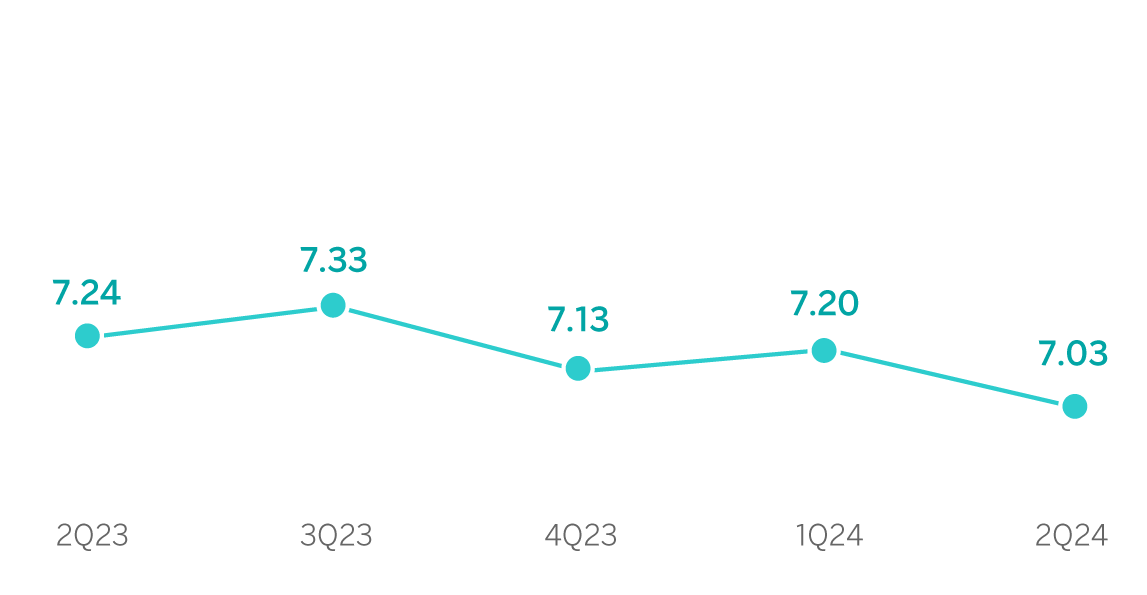
NET INTEREST INCOME / AVERAGE TOTAL ASSETS
(PERCENTAGE AT CONSTANT EXCHANGE RATE)
OPERATING INCOME
(MILLIONS OF EUROS AT CONSTANT EXCHANGE RATE)
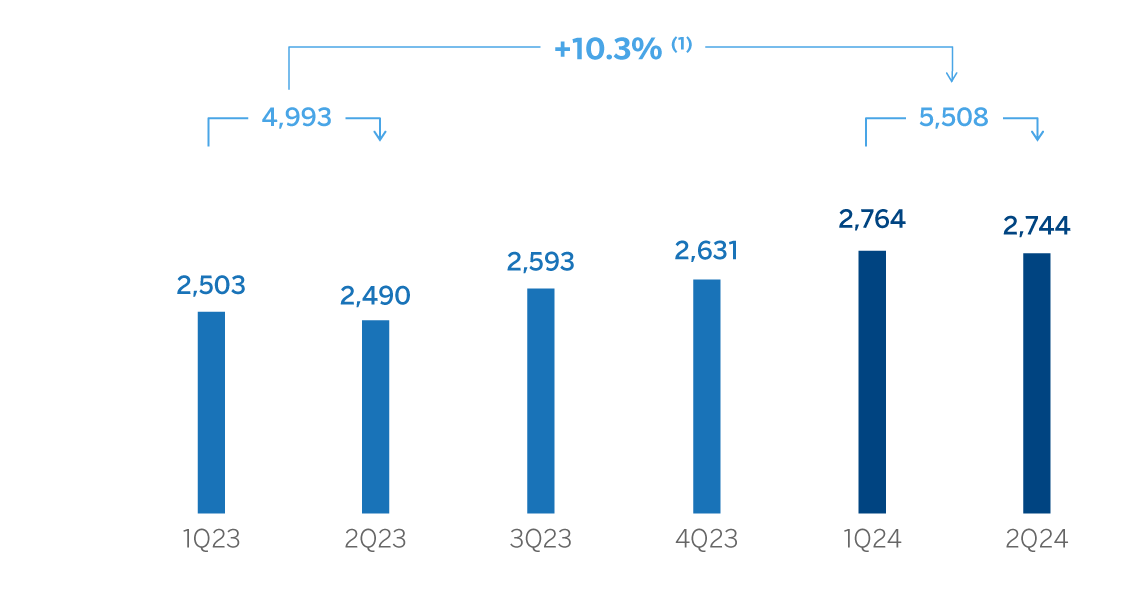
(1) At current exchange rate: +17.1%.
NET ATTRIBUTABLE PROFIT (LOSS)
(MILLIONS OF EUROS AT CONSTANT EXCHANGE RATE)
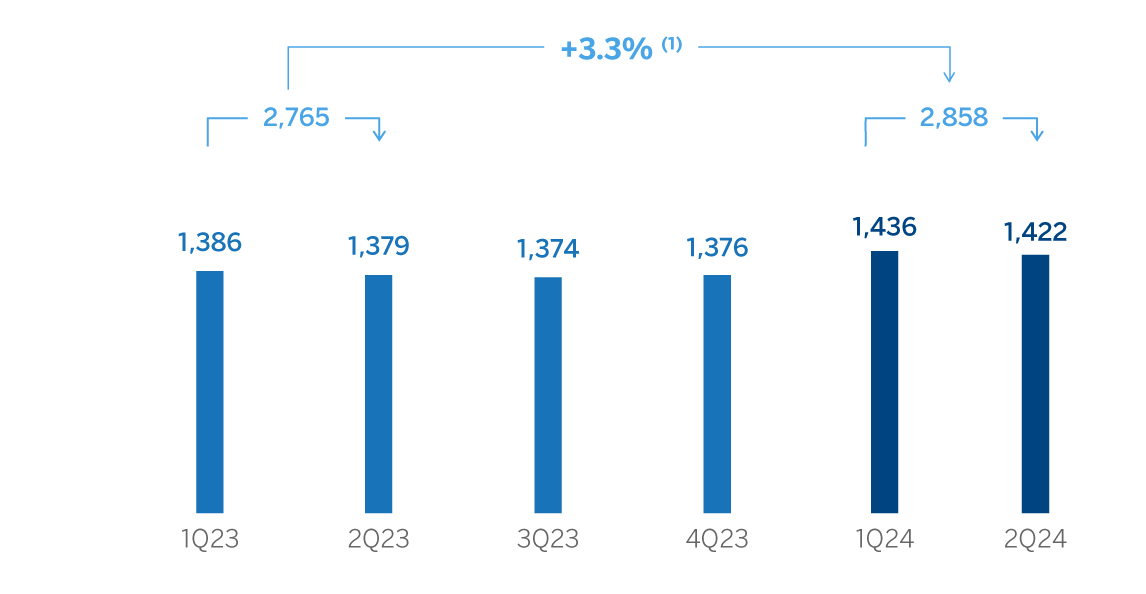
(1) At current exchange rate: +9.8%.
| FINANCIAL STATEMENTS AND RELEVANT BUSINESS INDICATORS (MILLIONS OF EUROS AND PERCENTAGE) | ||||
|---|---|---|---|---|
| Income statement | 1H24 | ∆ % | ∆ % (2) | 1H23 (1) |
| Net interest income | 5,968 | 13.4 | 6.8 | 5,264 |
| Net fees and commissions | 1,269 | 24.8 | 17.5 | 1,017 |
| Net trading income | 397 | 26.1 | 18.8 | 315 |
| Other operating income and expenses | 276 | 54.7 | 45.7 | 178 |
| Gross income | 7,910 | 16.8 | 10.0 | 6,774 |
| Operating expenses | (2,403) | 16.0 | 9.2 | (2,072) |
| Personnel expenses | (1,144) | 20.1 | 13.1 | (953) |
| Other administrative expenses | (1,006) | 12.2 | 5.7 | (896) |
| Depreciation | (253) | 13.4 | 6.7 | (223) |
| Operating income | 5,508 | 17.1 | 10.3 | 4,702 |
| Impairment on financial assets not measured at fair value through profit or loss | (1,553) | 36.6 | 28.6 | (1,136) |
| Provisions or reversal of provisions and other results | (17) | n.s. | n.s. | 5 |
| Profit (loss) before tax | 3,938 | 10.3 | 3.9 | 3,570 |
| Income tax | (1,079) | 11.8 | 5.2 | (966) |
| Profit (loss) for the period | 2,858 | 9.8 | 3.3 | 2,604 |
| Non-controlling interests | (1) | 8.6 | 2.3 | (0) |
| Net attributable profit (loss) | 2,858 | 9.8 | 3.3 | 2,604 |
Balance sheets | 30-06-24 | ∆ % | ∆ % (2) | 31-12-23 |
| Cash, cash balances at central banks and other demand deposits | 7,676 | (23.9) | (20.5) | 10,089 |
| Financial assets designated at fair value | 59,191 | (2.0) | 2.4 | 60,379 |
| Of which: Loans and advances | 1,496 | (71.1) | (69.8) | 5,180 |
| Financial assets at amortized cost | 96,641 | 0.3 | 4.8 | 96,342 |
| Of which: Loans and advances to customers | 89,733 | 1.8 | 6.4 | 88,112 |
| Tangible assets | 2,255 | (5.5) | (1.3) | 2,387 |
| Other assets | 4,742 | 10.5 | 15.4 | 4,293 |
| Total assets/liabilities and equity | 170,505 | (1.7) | 2.7 | 173,489 |
| Financial liabilities held for trading and designated at fair value through profit or loss | 34,395 | 20.7 | 26.1 | 28,492 |
| Deposits from central banks and credit institutions | 7,411 | (15.2) | (11.4) | 8,739 |
| Deposits from customers | 86,048 | (7.0) | (2.9) | 92,564 |
| Debt certificates | 10,533 | 8.4 | 13.2 | 9,719 |
| Other liabilities | 19,664 | (13.6) | (9.7) | 22,756 |
| Regulatory capital allocated | 12,454 | 11.0 | 16.0 | 11,218 |
Relevant business indicators | 30-06-24 | ∆ % | ∆ % (2) | 31-12-23 |
| Performing loans and advances to customers under management (3) | 90,244 | 1.8 | 6.3 | 88,688 |
| Non-performing loans | 2,525 | 2.2 | 6.8 | 2,472 |
| Customer deposits under management (3) | 85,312 | (6.2) | (2.0) | 90,926 |
| Off-balance sheet funds (4) | 59,179 | 11.1 | 16.1 | 53,254 |
| Risk-weighted assets | 94,157 | 2.5 | 7.1 | 91,865 |
| Efficiency ratio (%) | 30.4 | 30.9 | ||
| NPL ratio (%) | 2.6 | 2.6 | ||
| NPL coverage ratio (%) | 120 | 123 | ||
| Cost of risk (%) | 3.34 | 2.96 | ||
(1) Revised balances. For more information, please refer to the “Business Areas” section.
(2) At constant exchange rate.
(3) Excluding repos.
(4) Includes mutual funds, customer portfolios and other off-balance sheet funds.
Macro and industry trends
Economic growth has lost some of its dynamism in the first half of 2024, in a context of economic slowdown in the United States, still high interest rates and slowing investment. Thus, after growing 3.2% in 2023, GDP growth will moderate to 2.5% in 2024 (unchanged from the previous forecast) and would remain supported by robust private consumption. Annual inflation rose temporarily in recent months, to 5.0% in June, but is expected to resume its downward trend soon. According to BBVA Research, inflation will close 2024 at around 4.3%. Policy rates, which stood at 11.0% in June 2024 after a cut of 25 basis points in March, are expected to continue to decrease, albeit at a slower pace than previously expected, to around 10.5% by the end of the year. In addition, following the general elections held in June, turbulence was observed in the financial markets. Although financial volatility has moderated more recently, there is still uncertainty about future public policies.
With respect to the banking system, at the end of May 2024, the volume of outstanding credit to the non-financial private sector increased by 11.4% in year-on-year terms, with a greater boost from the consumer portfolio (+19.9%), followed by mortgages (+8.2%) and loans to businesses (+9.1%). Growth in total (demand and time) deposits remains at similar levels to those of total credit, with a year-on-year growth of 9.9% at the end of April 2024, with greater dynamism in time deposits (+12.4% year-on-year) than in demand deposits (+8.6% year-on-year). The industry's non-performing loans slightly improved at around 2.25% in April 2024 and capital ratios are at comfortable levels.
Unless expressly stated otherwise, all the comments below on rates of change, for both activity and results, will be given at constant exchange rate. These rates, together with changes at current exchange rates, can be found in the attached tables of financial statements and relevant business indicators.
Activity
The most relevant aspects related to the area's activity in the first half of 2024 were:
- Lending activity (performing loans under management) grew by 6.3% between January and June 2024, with a more dynamic growth in the retail portfolio. The wholesale portfolio, which includes large companies and public sector, grew by 6.2% in the first half, with dynamism in the corporate banking segment. For its part, the retail portfolio grew at a rate of 6.4%. Within this segment, consumer loans are noteworthy, which grew by 9.4%.
- Customer deposits under management increased 4.7% in the first half of 2024, as a result of the growth of mutual funds and other off-balance sheet funds, which increased at a rate of 16.1% in the first half of 2024, thanks to the commercial boost in a highly competitive environment to attract liabilities.
The most relevant aspects related to the area's activity in the second quarter of 2024 were:
- Lending activity (performing loans under management) grew by 5.6% in the second quarter of 2024, with greater dynamism in the wholesale portfolio, which grew at a rate of 7.8% favored by the performance of the corporates segment with business strategies which favored its growth at a rate of 9.3%. For its part, the retail portfolio grew 3.9%, highlighting the increase in consumer credits (+5.0%, driven by the product "Nómina y Personales BBVA"), and to a lesser extent mortgage loans (+2.5%) and SMEs (+5.8%). As a result, the weight of the retail portfolio, which is the most profitable for BBVA Mexico, stood at 52.5% at the end of June 2024.
- With regard to the asset quality indicators, the NPL ratio stood at 2.6% at the end of June 2024, which represents a reduction of -6 basis points compared to the end of March, mainly due to the good performance of the wholesale portfolio, as a result of both improved activity and the containment of the non-performing loans. On the other hand, the NPL coverage ratio increased to 120% at the end of June 2024.
- Customer deposits under management increased by 2.8%, mainly favored by the growth of off-balance sheet funds, which increased by 5.7% in the quarter, at the expense of time deposits (-7.8%). With respect to demand deposits, they grew by 2.7%.
Results
BBVA Mexico achieved a cumulative net attributable profit of €2,858m by the end of June 2024, representing an increase of 3.3% compared to the same period of the previous year, mainly due to the strength of the recurring income from the banking business.
The most relevant aspects of the year-on-year changes in the income statement as of the end of June 2024 are summarized below:
- Net interest income increased by 6.8%, as a result of growth in lending activity.
- Net fees and commissions, boosted by greater transactions, continued to increase at double digit (+17.5%), with favorable evolution in almost all commissions types, highlighting credit cards, those derived from mutual funds management and from wholesale activity.
- The contribution from NTI increased (+18.8%) mainly as a result of the performance of Global Markets.
- The other operating income and expenses line grew by 45.7%, driven by the evolution of the insurance business.
- Operating expenses increased (+9.2%), mainly due to higher personnel expenses associated with the increase in the headcount over the course of 2023, and, to a lesser extent, the increase of general expenses, particularly technology expenditure.
- Loan-loss provisions increased (+28.6%), affected by the higher provisioning needs of the retail portfolio, mainly in consumer and credit cards, due to the growth of these profitable segments. Consequently, the cumulative cost of risk at the end of June 2024 stood at 3.34%, which represents a growth of 7 basis points compared to the one registered at the end of March 2024.
In the quarter, and excluding the effect of exchange rate fluctuations, BBVA Mexico generated net attributable profit of €1,422m, which represents a -1.0% variation with respect to the previous quarter. This evolution is due to lower recurrent revenues and lower NTI, offset by a better performance in the other operating income and expenses line, mainly thanks to the positive performance of the insurance business. On the lower of the income statement, there was an increase in operating expenses and higher provisions for impairment of financial assets.